Cheyenne vs Houma Disability Age Over 75
COMPARE
Cheyenne
Houma
Disability Age Over 75
Disability Age Over 75 Comparison
Cheyenne
Houma
50.9%
DISABILITY AGE OVER 75
0.0/ 100
METRIC RATING
312th/ 347
METRIC RANK
56.2%
DISABILITY AGE OVER 75
0.0/ 100
METRIC RATING
341st/ 347
METRIC RANK
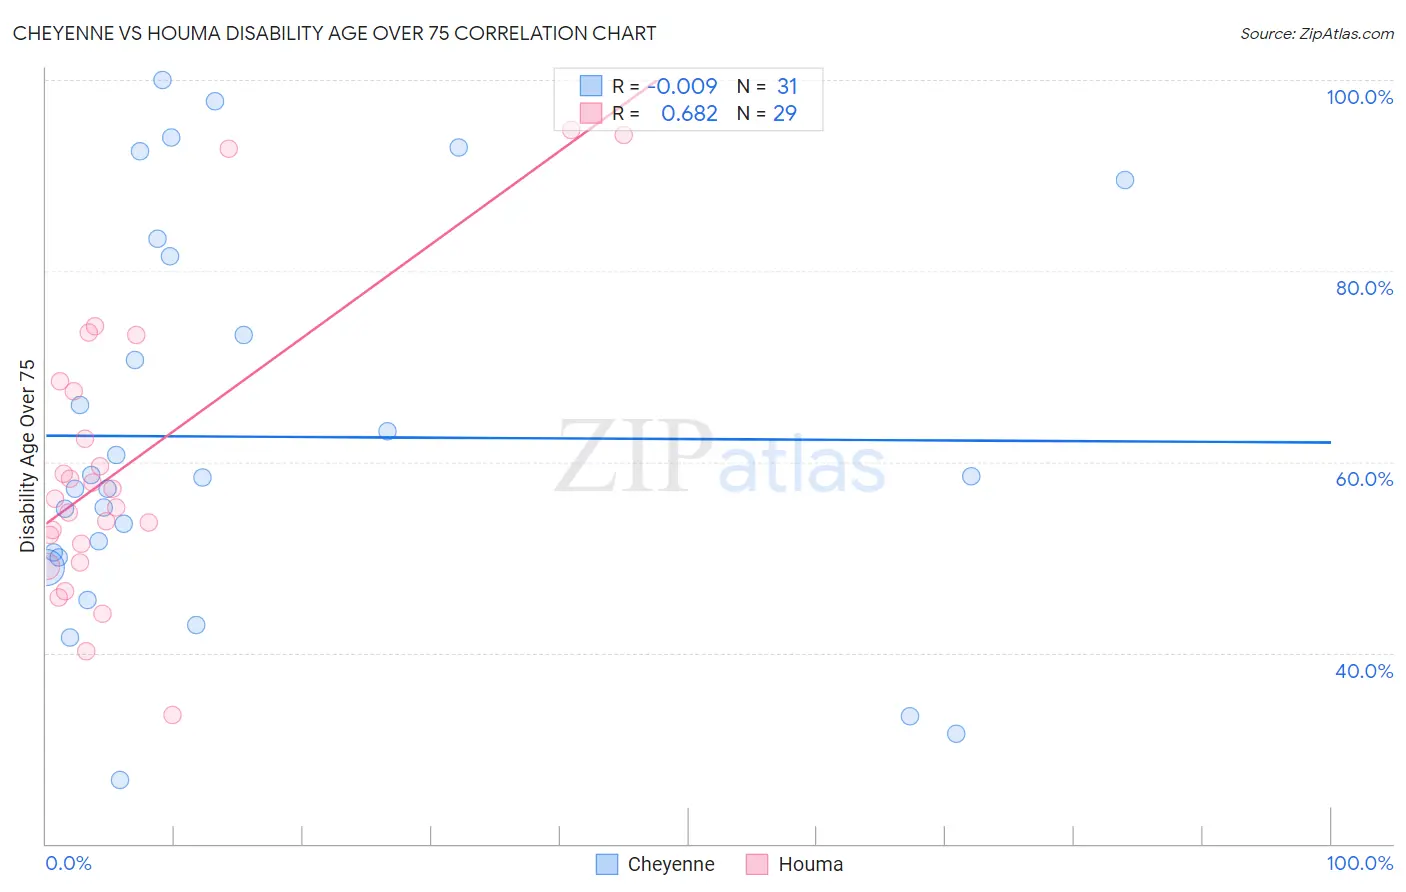
Cheyenne vs Houma Disability Age Over 75 Correlation Chart
The statistical analysis conducted on geographies consisting of 80,679,697 people shows no correlation between the proportion of Cheyenne and percentage of population with a disability over the age of 75 in the United States with a correlation coefficient (R) of -0.009 and weighted average of 50.9%. Similarly, the statistical analysis conducted on geographies consisting of 36,766,477 people shows a significant positive correlation between the proportion of Houma and percentage of population with a disability over the age of 75 in the United States with a correlation coefficient (R) of 0.682 and weighted average of 56.2%, a difference of 10.4%.
Disability Age Over 75 Correlation Summary
| Measurement | Cheyenne | Houma |
| Minimum | 26.7% | 33.5% |
| Maximum | 100.0% | 94.7% |
| Range | 73.3% | 61.3% |
| Mean | 62.6% | 59.7% |
| Median | 58.3% | 56.1% |
| Interquartile 25% (IQ1) | 50.0% | 50.4% |
| Interquartile 75% (IQ3) | 81.5% | 67.9% |
| Interquartile Range (IQR) | 31.5% | 17.5% |
| Standard Deviation (Sample) | 20.2% | 15.2% |
| Standard Deviation (Population) | 19.9% | 14.9% |
Similar Demographics by Disability Age Over 75
Demographics Similar to Cheyenne by Disability Age Over 75
In terms of disability age over 75, the demographic groups most similar to Cheyenne are Immigrants from the Azores (50.9%, a difference of 0.050%), Immigrants from Mexico (51.1%, a difference of 0.42%), Cajun (50.7%, a difference of 0.45%), Mexican (51.1%, a difference of 0.47%), and Tlingit-Haida (50.6%, a difference of 0.55%).
| Demographics | Rating | Rank | Disability Age Over 75 |
| Central American Indians | 0.0 /100 | #305 | Tragic 50.5% |
| Immigrants | Central America | 0.0 /100 | #306 | Tragic 50.5% |
| Immigrants | Fiji | 0.0 /100 | #307 | Tragic 50.6% |
| Hispanics or Latinos | 0.0 /100 | #308 | Tragic 50.6% |
| Aleuts | 0.0 /100 | #309 | Tragic 50.6% |
| Tlingit-Haida | 0.0 /100 | #310 | Tragic 50.6% |
| Cajuns | 0.0 /100 | #311 | Tragic 50.7% |
| Cheyenne | 0.0 /100 | #312 | Tragic 50.9% |
| Immigrants | Azores | 0.0 /100 | #313 | Tragic 50.9% |
| Immigrants | Mexico | 0.0 /100 | #314 | Tragic 51.1% |
| Mexicans | 0.0 /100 | #315 | Tragic 51.1% |
| Chickasaw | 0.0 /100 | #316 | Tragic 51.2% |
| Yakama | 0.0 /100 | #317 | Tragic 51.3% |
| Seminole | 0.0 /100 | #318 | Tragic 51.5% |
| Creek | 0.0 /100 | #319 | Tragic 51.5% |
Demographics Similar to Houma by Disability Age Over 75
In terms of disability age over 75, the demographic groups most similar to Houma are Lumbee (56.2%, a difference of 0.16%), Pueblo (55.9%, a difference of 0.51%), Pima (55.8%, a difference of 0.59%), Tohono O'odham (56.7%, a difference of 1.0%), and Colville (55.4%, a difference of 1.4%).
| Demographics | Rating | Rank | Disability Age Over 75 |
| Apache | 0.0 /100 | #333 | Tragic 53.6% |
| Alaskan Athabascans | 0.0 /100 | #334 | Tragic 54.0% |
| Kiowa | 0.0 /100 | #335 | Tragic 54.2% |
| Immigrants | Armenia | 0.0 /100 | #336 | Tragic 54.3% |
| Yuman | 0.0 /100 | #337 | Tragic 54.4% |
| Colville | 0.0 /100 | #338 | Tragic 55.4% |
| Pima | 0.0 /100 | #339 | Tragic 55.8% |
| Pueblo | 0.0 /100 | #340 | Tragic 55.9% |
| Houma | 0.0 /100 | #341 | Tragic 56.2% |
| Lumbee | 0.0 /100 | #342 | Tragic 56.2% |
| Tohono O'odham | 0.0 /100 | #343 | Tragic 56.7% |
| Navajo | 0.0 /100 | #344 | Tragic 58.3% |
| Inupiat | 0.0 /100 | #345 | Tragic 58.4% |
| Tsimshian | 0.0 /100 | #346 | Tragic 59.2% |
| Yup'ik | 0.0 /100 | #347 | Tragic 61.1% |