Central American vs Immigrants from Costa Rica Disability Age 35 to 64
COMPARE
Central American
Immigrants from Costa Rica
Disability Age 35 to 64
Disability Age 35 to 64 Comparison
Central Americans
Immigrants from Costa Rica
11.2%
DISABILITY AGE 35 TO 64
59.1/ 100
METRIC RATING
168th/ 347
METRIC RANK
10.7%
DISABILITY AGE 35 TO 64
91.7/ 100
METRIC RATING
137th/ 347
METRIC RANK
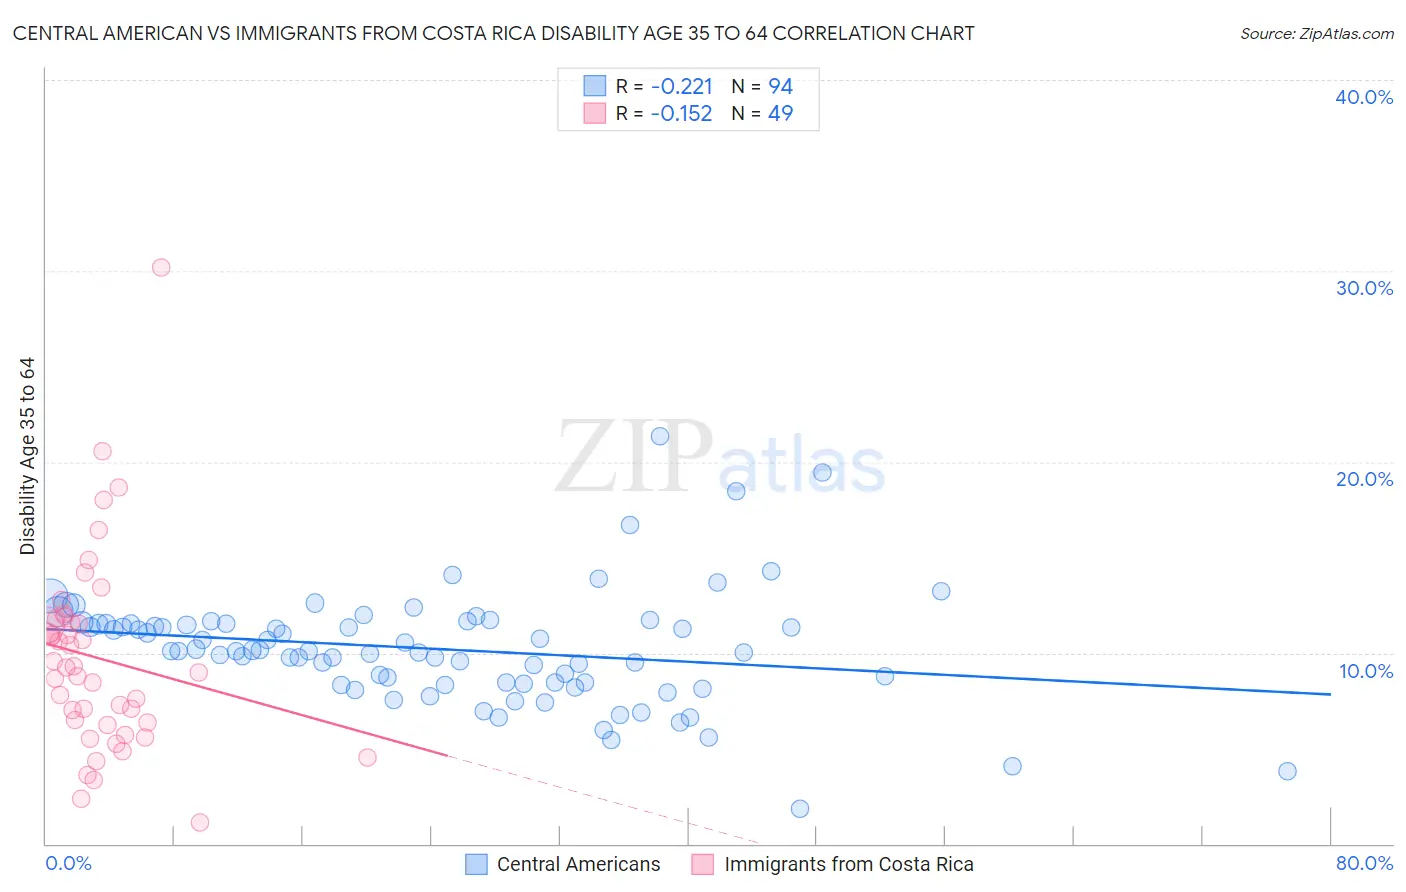
Central American vs Immigrants from Costa Rica Disability Age 35 to 64 Correlation Chart
The statistical analysis conducted on geographies consisting of 503,944,688 people shows a weak negative correlation between the proportion of Central Americans and percentage of population with a disability between the ages 34 and 64 in the United States with a correlation coefficient (R) of -0.221 and weighted average of 11.2%. Similarly, the statistical analysis conducted on geographies consisting of 204,238,582 people shows a poor negative correlation between the proportion of Immigrants from Costa Rica and percentage of population with a disability between the ages 34 and 64 in the United States with a correlation coefficient (R) of -0.152 and weighted average of 10.7%, a difference of 4.3%.
Disability Age 35 to 64 Correlation Summary
| Measurement | Central American | Immigrants from Costa Rica |
| Minimum | 1.8% | 1.1% |
| Maximum | 21.3% | 30.2% |
| Range | 19.5% | 29.1% |
| Mean | 10.2% | 9.7% |
| Median | 10.1% | 9.2% |
| Interquartile 25% (IQ1) | 8.4% | 6.3% |
| Interquartile 75% (IQ3) | 11.5% | 11.7% |
| Interquartile Range (IQR) | 3.1% | 5.4% |
| Standard Deviation (Sample) | 3.0% | 5.1% |
| Standard Deviation (Population) | 3.0% | 5.1% |
Similar Demographics by Disability Age 35 to 64
Demographics Similar to Central Americans by Disability Age 35 to 64
In terms of disability age 35 to 64, the demographic groups most similar to Central Americans are Haitian (11.2%, a difference of 0.010%), Immigrants from Uganda (11.2%, a difference of 0.090%), Immigrants from Trinidad and Tobago (11.2%, a difference of 0.26%), Italian (11.2%, a difference of 0.29%), and Austrian (11.1%, a difference of 0.35%).
| Demographics | Rating | Rank | Disability Age 35 to 64 |
| Immigrants | Guyana | 70.1 /100 | #161 | Good 11.1% |
| Immigrants | Grenada | 68.4 /100 | #162 | Good 11.1% |
| Immigrants | St. Vincent and the Grenadines | 66.6 /100 | #163 | Good 11.1% |
| Pakistanis | 65.8 /100 | #164 | Good 11.1% |
| Immigrants | Western Europe | 65.2 /100 | #165 | Good 11.1% |
| Immigrants | Haiti | 63.8 /100 | #166 | Good 11.1% |
| Austrians | 63.2 /100 | #167 | Good 11.1% |
| Central Americans | 59.1 /100 | #168 | Average 11.2% |
| Haitians | 59.0 /100 | #169 | Average 11.2% |
| Immigrants | Uganda | 58.0 /100 | #170 | Average 11.2% |
| Immigrants | Trinidad and Tobago | 55.9 /100 | #171 | Average 11.2% |
| Italians | 55.6 /100 | #172 | Average 11.2% |
| Lebanese | 51.8 /100 | #173 | Average 11.3% |
| Immigrants | Fiji | 50.0 /100 | #174 | Average 11.3% |
| Czechs | 47.9 /100 | #175 | Average 11.3% |
Demographics Similar to Immigrants from Costa Rica by Disability Age 35 to 64
In terms of disability age 35 to 64, the demographic groups most similar to Immigrants from Costa Rica are Immigrants from Southern Europe (10.7%, a difference of 0.050%), Costa Rican (10.7%, a difference of 0.060%), Salvadoran (10.7%, a difference of 0.070%), Immigrants from Scotland (10.7%, a difference of 0.12%), and Greek (10.7%, a difference of 0.18%).
| Demographics | Rating | Rank | Disability Age 35 to 64 |
| Immigrants | Syria | 93.0 /100 | #130 | Exceptional 10.7% |
| Immigrants | El Salvador | 92.8 /100 | #131 | Exceptional 10.7% |
| Immigrants | Albania | 92.5 /100 | #132 | Exceptional 10.7% |
| Immigrants | Immigrants | 92.5 /100 | #133 | Exceptional 10.7% |
| Immigrants | Ecuador | 92.5 /100 | #134 | Exceptional 10.7% |
| Greeks | 92.3 /100 | #135 | Exceptional 10.7% |
| Salvadorans | 91.9 /100 | #136 | Exceptional 10.7% |
| Immigrants | Costa Rica | 91.7 /100 | #137 | Exceptional 10.7% |
| Immigrants | Southern Europe | 91.5 /100 | #138 | Exceptional 10.7% |
| Costa Ricans | 91.4 /100 | #139 | Exceptional 10.7% |
| Immigrants | Scotland | 91.3 /100 | #140 | Exceptional 10.7% |
| Australians | 90.7 /100 | #141 | Exceptional 10.8% |
| Immigrants | Saudi Arabia | 90.6 /100 | #142 | Exceptional 10.8% |
| Sierra Leoneans | 89.7 /100 | #143 | Excellent 10.8% |
| Lithuanians | 88.7 /100 | #144 | Excellent 10.8% |