Celtic vs Spanish Disability Age 65 to 74
COMPARE
Celtic
Spanish
Disability Age 65 to 74
Disability Age 65 to 74 Comparison
Celtics
Spanish
24.2%
DISABILITY AGE 65 TO 74
6.4/ 100
METRIC RATING
229th/ 347
METRIC RANK
24.6%
DISABILITY AGE 65 TO 74
2.2/ 100
METRIC RATING
243rd/ 347
METRIC RANK
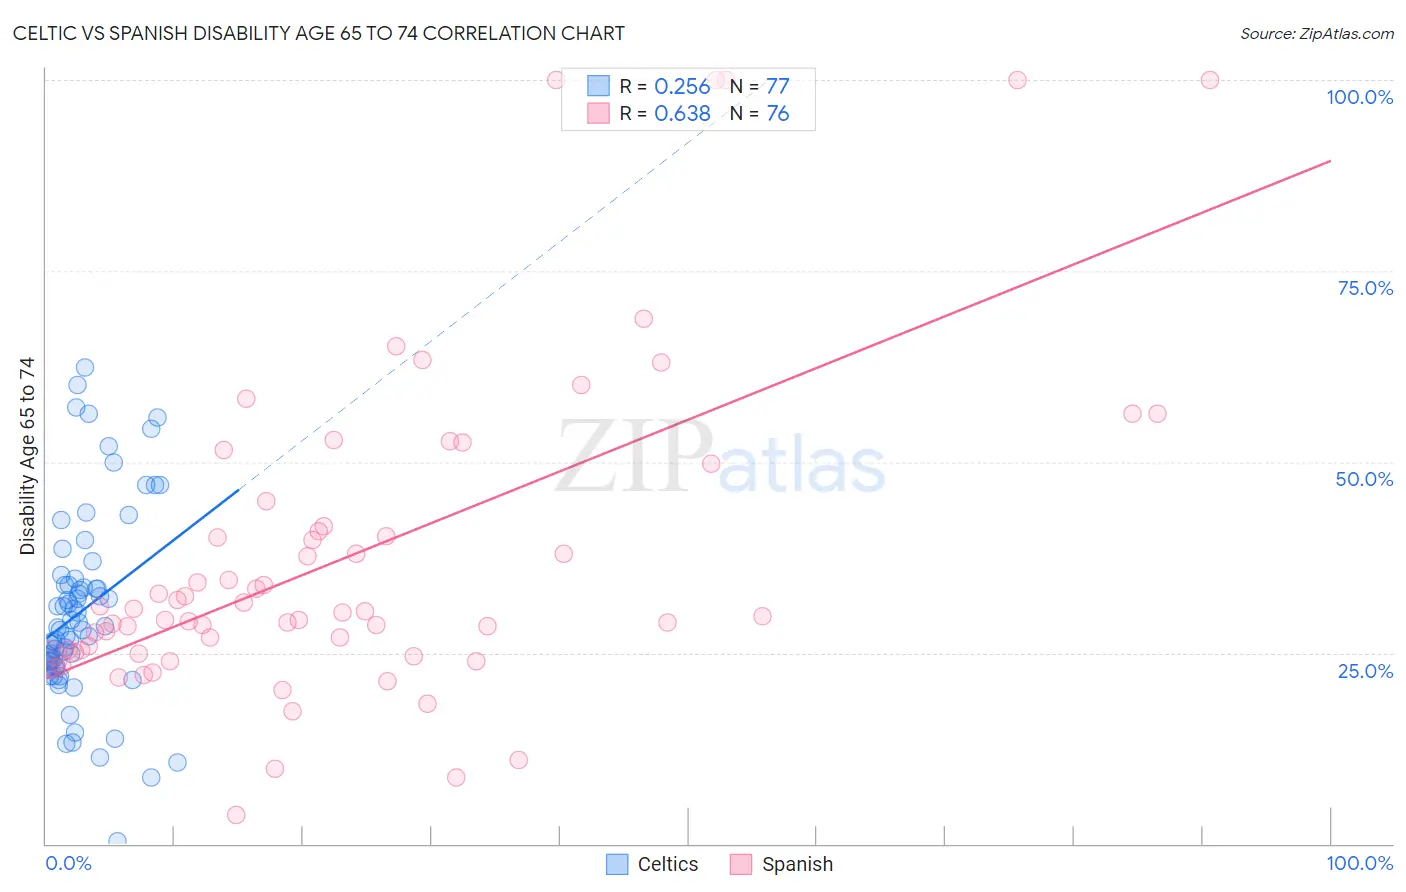
Celtic vs Spanish Disability Age 65 to 74 Correlation Chart
The statistical analysis conducted on geographies consisting of 168,782,457 people shows a weak positive correlation between the proportion of Celtics and percentage of population with a disability between the ages 65 and 75 in the United States with a correlation coefficient (R) of 0.256 and weighted average of 24.2%. Similarly, the statistical analysis conducted on geographies consisting of 421,397,918 people shows a significant positive correlation between the proportion of Spanish and percentage of population with a disability between the ages 65 and 75 in the United States with a correlation coefficient (R) of 0.638 and weighted average of 24.6%, a difference of 1.6%.
Disability Age 65 to 74 Correlation Summary
| Measurement | Celtic | Spanish |
| Minimum | 0.28% | 3.8% |
| Maximum | 62.4% | 100.0% |
| Range | 62.1% | 96.2% |
| Mean | 30.4% | 37.8% |
| Median | 28.3% | 30.4% |
| Interquartile 25% (IQ1) | 23.4% | 25.2% |
| Interquartile 75% (IQ3) | 34.3% | 43.2% |
| Interquartile Range (IQR) | 11.0% | 18.0% |
| Standard Deviation (Sample) | 12.4% | 21.4% |
| Standard Deviation (Population) | 12.3% | 21.2% |
Demographics Similar to Celtics and Spanish by Disability Age 65 to 74
In terms of disability age 65 to 74, the demographic groups most similar to Celtics are White/Caucasian (24.2%, a difference of 0.050%), Barbadian (24.3%, a difference of 0.11%), Nigerian (24.2%, a difference of 0.29%), Immigrants from Thailand (24.3%, a difference of 0.31%), and Iraqi (24.2%, a difference of 0.36%). Similarly, the demographic groups most similar to Spanish are Immigrants from Senegal (24.6%, a difference of 0.010%), Immigrants from Western Africa (24.6%, a difference of 0.090%), Armenian (24.7%, a difference of 0.12%), British West Indian (24.7%, a difference of 0.13%), and Spaniard (24.6%, a difference of 0.18%).
| Demographics | Rating | Rank | Disability Age 65 to 74 |
| Iraqis | 8.1 /100 | #226 | Tragic 24.2% |
| Nigerians | 7.8 /100 | #227 | Tragic 24.2% |
| Whites/Caucasians | 6.6 /100 | #228 | Tragic 24.2% |
| Celtics | 6.4 /100 | #229 | Tragic 24.2% |
| Barbadians | 6.0 /100 | #230 | Tragic 24.3% |
| Immigrants | Thailand | 5.2 /100 | #231 | Tragic 24.3% |
| Immigrants | Zaire | 5.0 /100 | #232 | Tragic 24.3% |
| Bahamians | 4.5 /100 | #233 | Tragic 24.4% |
| Panamanians | 4.2 /100 | #234 | Tragic 24.4% |
| Scotch-Irish | 3.8 /100 | #235 | Tragic 24.4% |
| German Russians | 3.7 /100 | #236 | Tragic 24.4% |
| West Indians | 3.4 /100 | #237 | Tragic 24.5% |
| Immigrants | Ghana | 3.0 /100 | #238 | Tragic 24.5% |
| Immigrants | Caribbean | 2.6 /100 | #239 | Tragic 24.6% |
| Spaniards | 2.4 /100 | #240 | Tragic 24.6% |
| Immigrants | Western Africa | 2.3 /100 | #241 | Tragic 24.6% |
| Immigrants | Senegal | 2.2 /100 | #242 | Tragic 24.6% |
| Spanish | 2.2 /100 | #243 | Tragic 24.6% |
| Armenians | 2.0 /100 | #244 | Tragic 24.7% |
| British West Indians | 2.0 /100 | #245 | Tragic 24.7% |
| Immigrants | Iraq | 1.9 /100 | #246 | Tragic 24.7% |