Carpatho Rusyn vs Ottawa Disability Age 35 to 64
COMPARE
Carpatho Rusyn
Ottawa
Disability Age 35 to 64
Disability Age 35 to 64 Comparison
Carpatho Rusyns
Ottawa
11.5%
DISABILITY AGE 35 TO 64
25.3/ 100
METRIC RATING
195th/ 347
METRIC RANK
14.6%
DISABILITY AGE 35 TO 64
0.0/ 100
METRIC RATING
318th/ 347
METRIC RANK
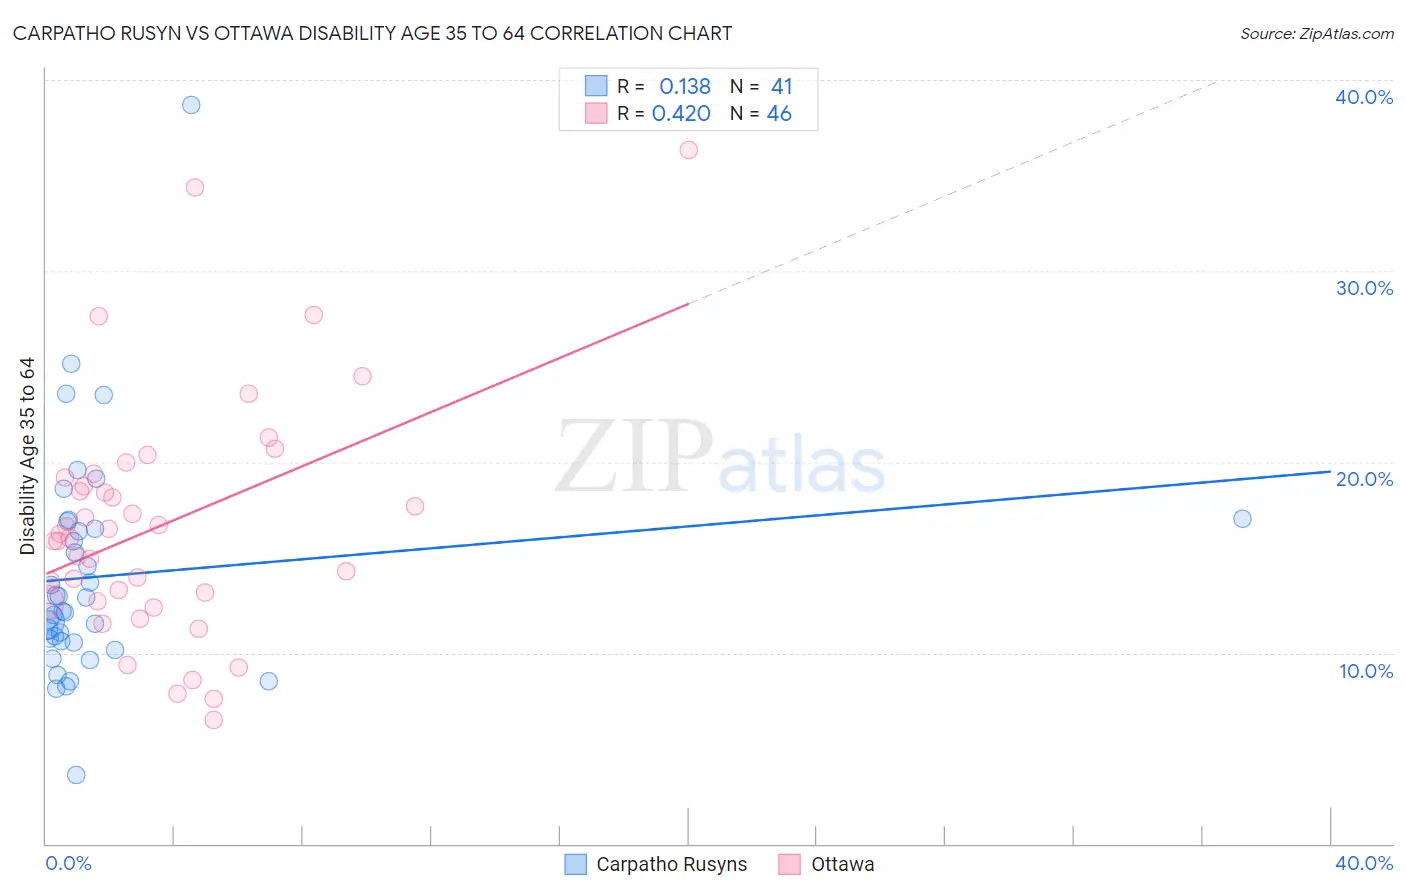
Carpatho Rusyn vs Ottawa Disability Age 35 to 64 Correlation Chart
The statistical analysis conducted on geographies consisting of 58,871,605 people shows a poor positive correlation between the proportion of Carpatho Rusyns and percentage of population with a disability between the ages 34 and 64 in the United States with a correlation coefficient (R) of 0.138 and weighted average of 11.5%. Similarly, the statistical analysis conducted on geographies consisting of 49,944,386 people shows a moderate positive correlation between the proportion of Ottawa and percentage of population with a disability between the ages 34 and 64 in the United States with a correlation coefficient (R) of 0.420 and weighted average of 14.6%, a difference of 27.0%.
Disability Age 35 to 64 Correlation Summary
| Measurement | Carpatho Rusyn | Ottawa |
| Minimum | 3.6% | 6.5% |
| Maximum | 38.7% | 36.4% |
| Range | 35.0% | 29.9% |
| Mean | 14.0% | 16.7% |
| Median | 12.2% | 16.1% |
| Interquartile 25% (IQ1) | 10.6% | 12.7% |
| Interquartile 75% (IQ3) | 16.7% | 19.2% |
| Interquartile Range (IQR) | 6.1% | 6.4% |
| Standard Deviation (Sample) | 6.0% | 6.3% |
| Standard Deviation (Population) | 5.9% | 6.2% |
Similar Demographics by Disability Age 35 to 64
Demographics Similar to Carpatho Rusyns by Disability Age 35 to 64
In terms of disability age 35 to 64, the demographic groups most similar to Carpatho Rusyns are Iraqi (11.5%, a difference of 0.12%), Immigrants from Latin America (11.5%, a difference of 0.22%), Immigrants from Africa (11.5%, a difference of 0.37%), Norwegian (11.5%, a difference of 0.43%), and Immigrants from Iraq (11.6%, a difference of 0.48%).
| Demographics | Rating | Rank | Disability Age 35 to 64 |
| Northern Europeans | 34.9 /100 | #188 | Fair 11.4% |
| Hungarians | 34.6 /100 | #189 | Fair 11.4% |
| Immigrants | Nigeria | 32.5 /100 | #190 | Fair 11.4% |
| Swedes | 31.3 /100 | #191 | Fair 11.4% |
| Norwegians | 29.7 /100 | #192 | Fair 11.5% |
| Immigrants | Africa | 29.0 /100 | #193 | Fair 11.5% |
| Immigrants | Latin America | 27.5 /100 | #194 | Fair 11.5% |
| Carpatho Rusyns | 25.3 /100 | #195 | Fair 11.5% |
| Iraqis | 24.2 /100 | #196 | Fair 11.5% |
| Immigrants | Iraq | 21.0 /100 | #197 | Fair 11.6% |
| Immigrants | Panama | 20.4 /100 | #198 | Fair 11.6% |
| Basques | 19.5 /100 | #199 | Poor 11.6% |
| Swiss | 18.7 /100 | #200 | Poor 11.6% |
| Immigrants | Kenya | 17.7 /100 | #201 | Poor 11.6% |
| Immigrants | Guatemala | 17.5 /100 | #202 | Poor 11.6% |
Demographics Similar to Ottawa by Disability Age 35 to 64
In terms of disability age 35 to 64, the demographic groups most similar to Ottawa are Crow (14.6%, a difference of 0.070%), Immigrants from Cabo Verde (14.7%, a difference of 0.42%), Black/African American (14.7%, a difference of 0.57%), Comanche (14.7%, a difference of 0.83%), and Potawatomi (14.8%, a difference of 0.87%).
| Demographics | Rating | Rank | Disability Age 35 to 64 |
| Immigrants | Azores | 0.0 /100 | #311 | Tragic 14.3% |
| Paiute | 0.0 /100 | #312 | Tragic 14.3% |
| Iroquois | 0.0 /100 | #313 | Tragic 14.4% |
| Shoshone | 0.0 /100 | #314 | Tragic 14.5% |
| Alaska Natives | 0.0 /100 | #315 | Tragic 14.5% |
| Osage | 0.0 /100 | #316 | Tragic 14.5% |
| Crow | 0.0 /100 | #317 | Tragic 14.6% |
| Ottawa | 0.0 /100 | #318 | Tragic 14.6% |
| Immigrants | Cabo Verde | 0.0 /100 | #319 | Tragic 14.7% |
| Blacks/African Americans | 0.0 /100 | #320 | Tragic 14.7% |
| Comanche | 0.0 /100 | #321 | Tragic 14.7% |
| Potawatomi | 0.0 /100 | #322 | Tragic 14.8% |
| Apache | 0.0 /100 | #323 | Tragic 14.9% |
| Chippewa | 0.0 /100 | #324 | Tragic 15.0% |
| Arapaho | 0.0 /100 | #325 | Tragic 15.1% |