Canadian vs American Disability Age 5 to 17
COMPARE
Canadian
American
Disability Age 5 to 17
Disability Age 5 to 17 Comparison
Canadians
Americans
6.0%
DISABILITY AGE 5 TO 17
0.6/ 100
METRIC RATING
264th/ 347
METRIC RANK
6.5%
DISABILITY AGE 5 TO 17
0.0/ 100
METRIC RATING
325th/ 347
METRIC RANK
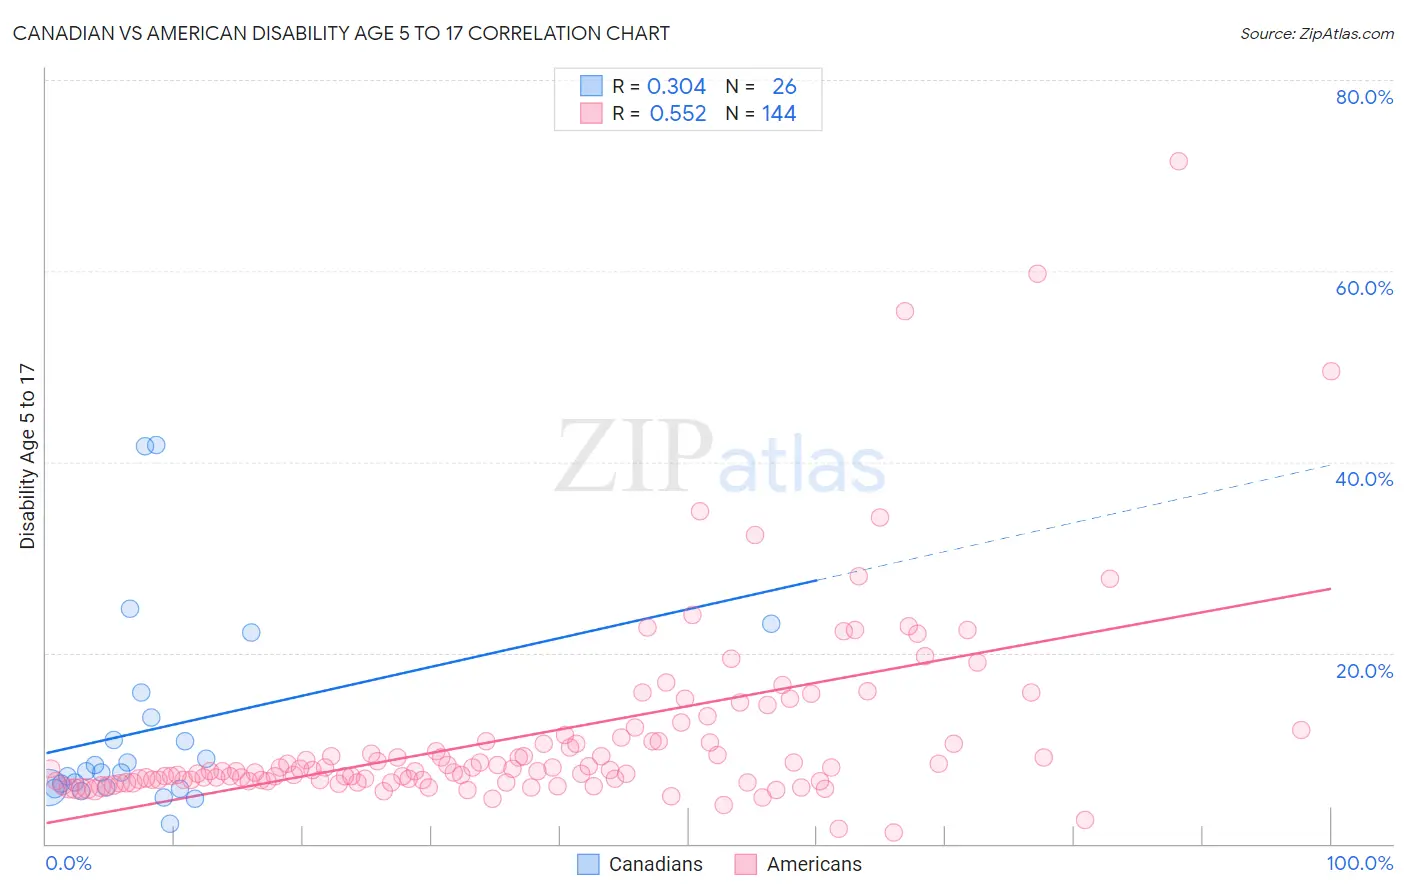
Canadian vs American Disability Age 5 to 17 Correlation Chart
The statistical analysis conducted on geographies consisting of 432,656,335 people shows a mild positive correlation between the proportion of Canadians and percentage of population with a disability between the ages 5 and 17 in the United States with a correlation coefficient (R) of 0.304 and weighted average of 6.0%. Similarly, the statistical analysis conducted on geographies consisting of 566,133,165 people shows a substantial positive correlation between the proportion of Americans and percentage of population with a disability between the ages 5 and 17 in the United States with a correlation coefficient (R) of 0.552 and weighted average of 6.5%, a difference of 9.7%.
Disability Age 5 to 17 Correlation Summary
| Measurement | Canadian | American |
| Minimum | 2.1% | 1.2% |
| Maximum | 41.8% | 71.4% |
| Range | 39.7% | 70.2% |
| Mean | 12.0% | 11.3% |
| Median | 7.5% | 7.7% |
| Interquartile 25% (IQ1) | 5.8% | 6.6% |
| Interquartile 75% (IQ3) | 13.2% | 10.8% |
| Interquartile Range (IQR) | 7.4% | 4.2% |
| Standard Deviation (Sample) | 10.5% | 10.2% |
| Standard Deviation (Population) | 10.3% | 10.2% |
Similar Demographics by Disability Age 5 to 17
Demographics Similar to Canadians by Disability Age 5 to 17
In terms of disability age 5 to 17, the demographic groups most similar to Canadians are Panamanian (6.0%, a difference of 0.070%), Slovene (6.0%, a difference of 0.10%), Czechoslovakian (5.9%, a difference of 0.12%), Immigrants from Western Africa (5.9%, a difference of 0.20%), and Spanish (6.0%, a difference of 0.21%).
| Demographics | Rating | Rank | Disability Age 5 to 17 |
| Hispanics or Latinos | 1.0 /100 | #257 | Tragic 5.9% |
| Brazilians | 0.9 /100 | #258 | Tragic 5.9% |
| Slavs | 0.9 /100 | #259 | Tragic 5.9% |
| Somalis | 0.8 /100 | #260 | Tragic 5.9% |
| Immigrants | Middle Africa | 0.7 /100 | #261 | Tragic 5.9% |
| Immigrants | Western Africa | 0.7 /100 | #262 | Tragic 5.9% |
| Czechoslovakians | 0.7 /100 | #263 | Tragic 5.9% |
| Canadians | 0.6 /100 | #264 | Tragic 6.0% |
| Panamanians | 0.6 /100 | #265 | Tragic 6.0% |
| Slovenes | 0.6 /100 | #266 | Tragic 6.0% |
| Spanish | 0.5 /100 | #267 | Tragic 6.0% |
| Sioux | 0.4 /100 | #268 | Tragic 6.0% |
| Liberians | 0.4 /100 | #269 | Tragic 6.0% |
| Immigrants | Somalia | 0.4 /100 | #270 | Tragic 6.0% |
| Immigrants | Zaire | 0.2 /100 | #271 | Tragic 6.0% |
Demographics Similar to Americans by Disability Age 5 to 17
In terms of disability age 5 to 17, the demographic groups most similar to Americans are Dominican (6.5%, a difference of 0.050%), Potawatomi (6.5%, a difference of 0.13%), Osage (6.5%, a difference of 0.14%), Slovak (6.5%, a difference of 0.17%), and Tohono O'odham (6.5%, a difference of 0.19%).
| Demographics | Rating | Rank | Disability Age 5 to 17 |
| Comanche | 0.0 /100 | #318 | Tragic 6.4% |
| Delaware | 0.0 /100 | #319 | Tragic 6.5% |
| Africans | 0.0 /100 | #320 | Tragic 6.5% |
| Tohono O'odham | 0.0 /100 | #321 | Tragic 6.5% |
| Slovaks | 0.0 /100 | #322 | Tragic 6.5% |
| Osage | 0.0 /100 | #323 | Tragic 6.5% |
| Dominicans | 0.0 /100 | #324 | Tragic 6.5% |
| Americans | 0.0 /100 | #325 | Tragic 6.5% |
| Potawatomi | 0.0 /100 | #326 | Tragic 6.5% |
| French American Indians | 0.0 /100 | #327 | Tragic 6.6% |
| Pennsylvania Germans | 0.0 /100 | #328 | Tragic 6.6% |
| Blackfeet | 0.0 /100 | #329 | Tragic 6.6% |
| Dutch West Indians | 0.0 /100 | #330 | Tragic 6.7% |
| French Canadians | 0.0 /100 | #331 | Tragic 6.7% |
| Immigrants | Azores | 0.0 /100 | #332 | Tragic 6.7% |