Burmese vs Sudanese Disability Age 65 to 74
COMPARE
Burmese
Sudanese
Disability Age 65 to 74
Disability Age 65 to 74 Comparison
Burmese
Sudanese
20.6%
DISABILITY AGE 65 TO 74
100.0/ 100
METRIC RATING
19th/ 347
METRIC RANK
23.7%
DISABILITY AGE 65 TO 74
27.8/ 100
METRIC RATING
194th/ 347
METRIC RANK
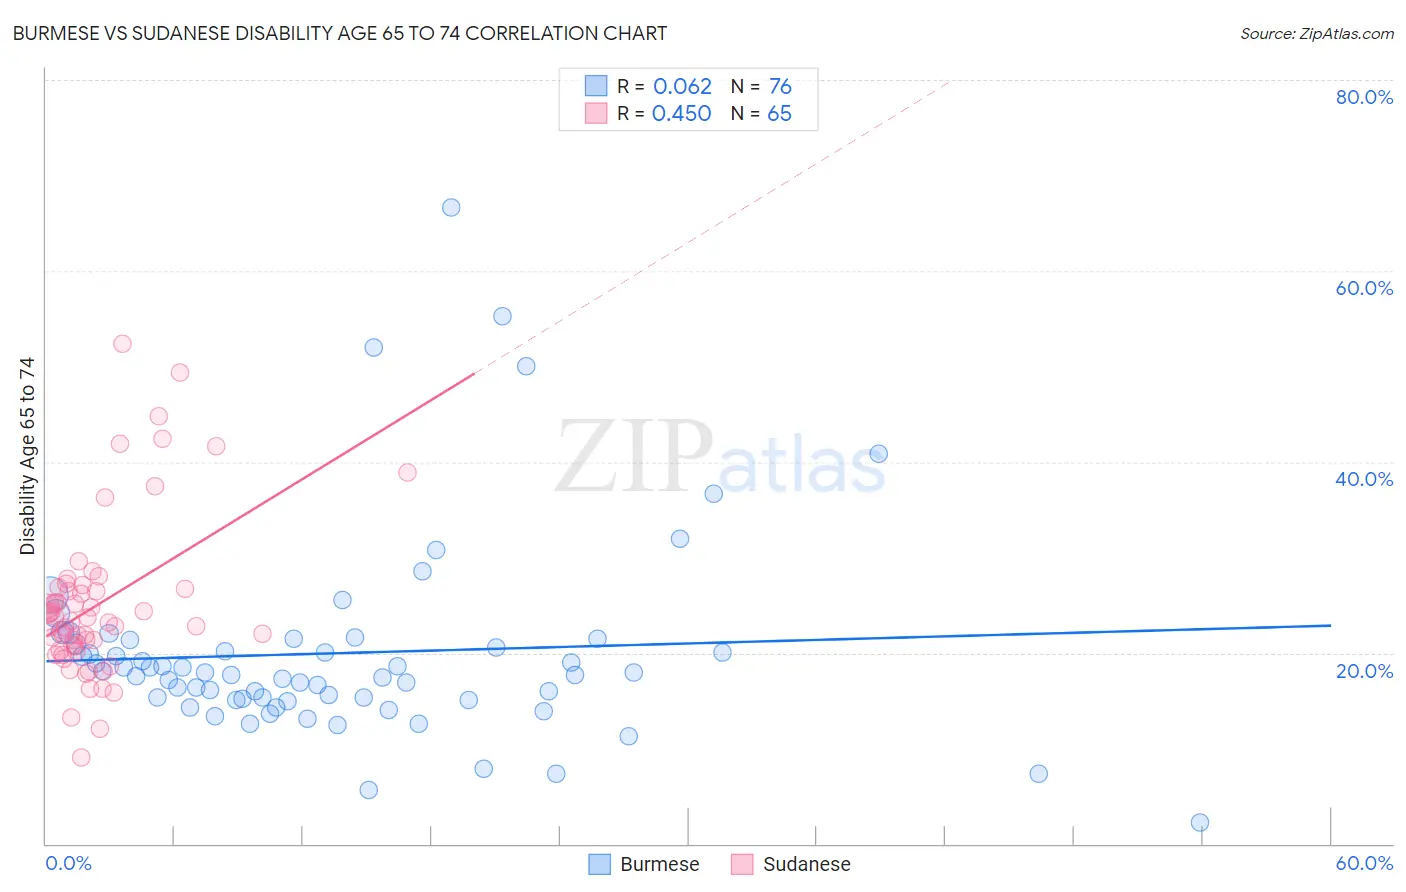
Burmese vs Sudanese Disability Age 65 to 74 Correlation Chart
The statistical analysis conducted on geographies consisting of 463,915,449 people shows a slight positive correlation between the proportion of Burmese and percentage of population with a disability between the ages 65 and 75 in the United States with a correlation coefficient (R) of 0.062 and weighted average of 20.6%. Similarly, the statistical analysis conducted on geographies consisting of 110,017,591 people shows a moderate positive correlation between the proportion of Sudanese and percentage of population with a disability between the ages 65 and 75 in the United States with a correlation coefficient (R) of 0.450 and weighted average of 23.7%, a difference of 14.7%.
Disability Age 65 to 74 Correlation Summary
| Measurement | Burmese | Sudanese |
| Minimum | 2.2% | 9.1% |
| Maximum | 66.7% | 52.4% |
| Range | 64.5% | 43.3% |
| Mean | 20.0% | 25.0% |
| Median | 17.8% | 23.3% |
| Interquartile 25% (IQ1) | 15.2% | 20.4% |
| Interquartile 75% (IQ3) | 21.1% | 26.8% |
| Interquartile Range (IQR) | 5.9% | 6.4% |
| Standard Deviation (Sample) | 10.6% | 8.4% |
| Standard Deviation (Population) | 10.5% | 8.3% |
Similar Demographics by Disability Age 65 to 74
Demographics Similar to Burmese by Disability Age 65 to 74
In terms of disability age 65 to 74, the demographic groups most similar to Burmese are Eastern European (20.6%, a difference of 0.030%), Immigrants from South Central Asia (20.6%, a difference of 0.10%), Okinawan (20.7%, a difference of 0.32%), Immigrants from Lithuania (20.5%, a difference of 0.35%), and Paraguayan (20.5%, a difference of 0.41%).
| Demographics | Rating | Rank | Disability Age 65 to 74 |
| Immigrants | Korea | 100.0 /100 | #12 | Exceptional 20.4% |
| Immigrants | Singapore | 100.0 /100 | #13 | Exceptional 20.4% |
| Indians (Asian) | 100.0 /100 | #14 | Exceptional 20.5% |
| Paraguayans | 100.0 /100 | #15 | Exceptional 20.5% |
| Immigrants | Lithuania | 100.0 /100 | #16 | Exceptional 20.5% |
| Immigrants | South Central Asia | 100.0 /100 | #17 | Exceptional 20.6% |
| Eastern Europeans | 100.0 /100 | #18 | Exceptional 20.6% |
| Burmese | 100.0 /100 | #19 | Exceptional 20.6% |
| Okinawans | 100.0 /100 | #20 | Exceptional 20.7% |
| Immigrants | Bolivia | 99.9 /100 | #21 | Exceptional 20.8% |
| Immigrants | Iran | 99.9 /100 | #22 | Exceptional 20.9% |
| Immigrants | Belgium | 99.9 /100 | #23 | Exceptional 21.0% |
| Soviet Union | 99.9 /100 | #24 | Exceptional 21.0% |
| Bolivians | 99.9 /100 | #25 | Exceptional 21.0% |
| Immigrants | Australia | 99.9 /100 | #26 | Exceptional 21.0% |
Demographics Similar to Sudanese by Disability Age 65 to 74
In terms of disability age 65 to 74, the demographic groups most similar to Sudanese are English (23.6%, a difference of 0.050%), Ecuadorian (23.6%, a difference of 0.13%), Immigrants from St. Vincent and the Grenadines (23.7%, a difference of 0.13%), Immigrants from Trinidad and Tobago (23.7%, a difference of 0.13%), and Immigrants (23.7%, a difference of 0.15%).
| Demographics | Rating | Rank | Disability Age 65 to 74 |
| Portuguese | 37.8 /100 | #187 | Fair 23.5% |
| Immigrants | Cuba | 34.0 /100 | #188 | Fair 23.6% |
| Scottish | 33.1 /100 | #189 | Fair 23.6% |
| Immigrants | Guyana | 31.2 /100 | #190 | Fair 23.6% |
| Immigrants | Bangladesh | 30.2 /100 | #191 | Fair 23.6% |
| Ecuadorians | 29.7 /100 | #192 | Fair 23.6% |
| English | 28.5 /100 | #193 | Fair 23.6% |
| Sudanese | 27.8 /100 | #194 | Fair 23.7% |
| Immigrants | St. Vincent and the Grenadines | 26.1 /100 | #195 | Fair 23.7% |
| Immigrants | Trinidad and Tobago | 26.1 /100 | #196 | Fair 23.7% |
| Immigrants | Immigrants | 25.8 /100 | #197 | Fair 23.7% |
| Immigrants | Africa | 24.4 /100 | #198 | Fair 23.7% |
| Welsh | 24.3 /100 | #199 | Fair 23.7% |
| French Canadians | 24.0 /100 | #200 | Fair 23.7% |
| Immigrants | Ecuador | 23.9 /100 | #201 | Fair 23.7% |