Bulgarian vs Dutch West Indian Disability Age Over 75
COMPARE
Bulgarian
Dutch West Indian
Disability Age Over 75
Disability Age Over 75 Comparison
Bulgarians
Dutch West Indians
45.1%
DISABILITY AGE OVER 75
100.0/ 100
METRIC RATING
10th/ 347
METRIC RANK
51.5%
DISABILITY AGE OVER 75
0.0/ 100
METRIC RATING
321st/ 347
METRIC RANK
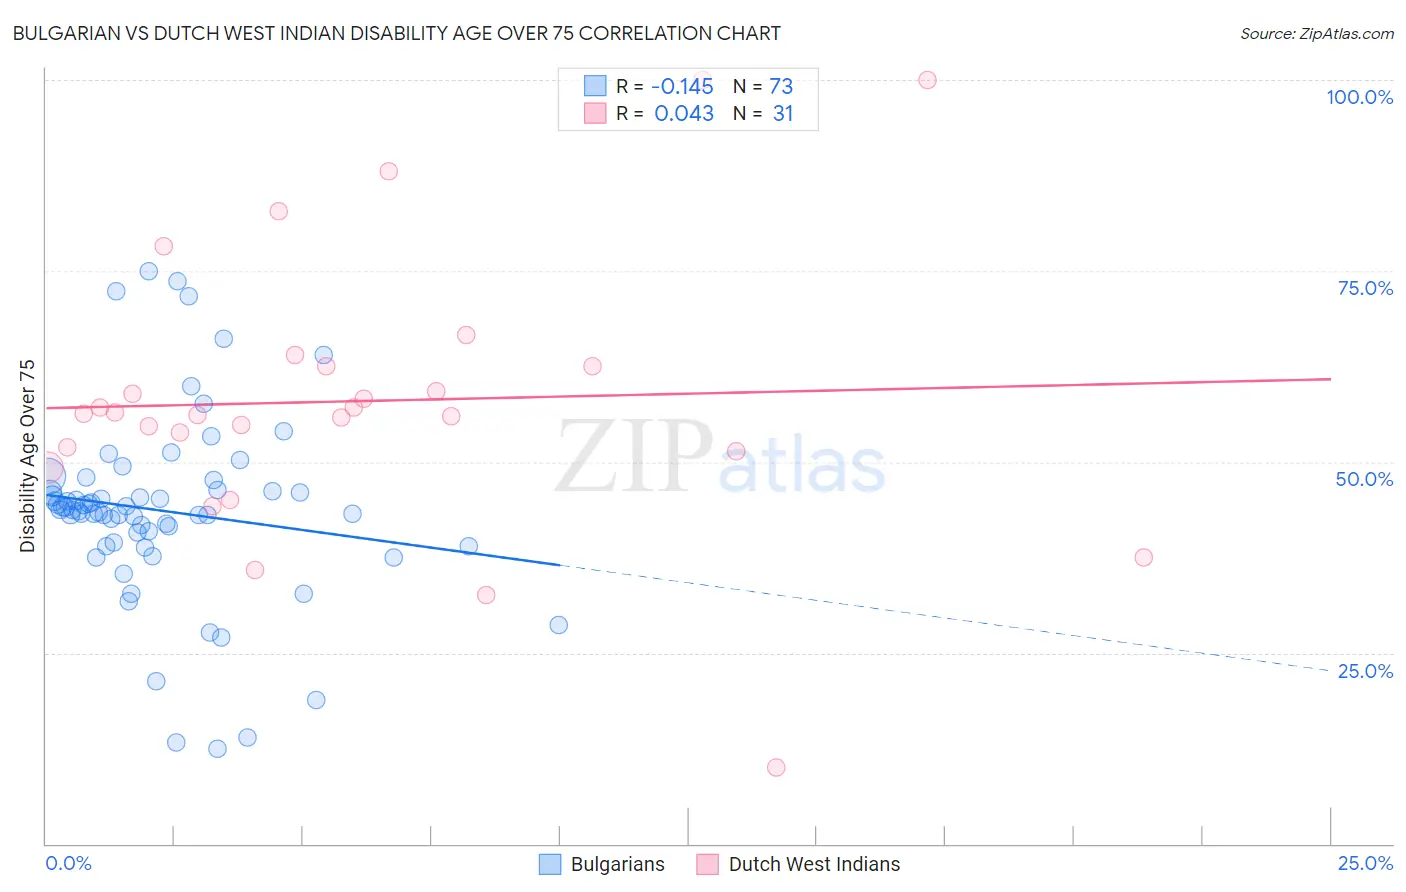
Bulgarian vs Dutch West Indian Disability Age Over 75 Correlation Chart
The statistical analysis conducted on geographies consisting of 205,489,445 people shows a poor negative correlation between the proportion of Bulgarians and percentage of population with a disability over the age of 75 in the United States with a correlation coefficient (R) of -0.145 and weighted average of 45.1%. Similarly, the statistical analysis conducted on geographies consisting of 85,737,433 people shows no correlation between the proportion of Dutch West Indians and percentage of population with a disability over the age of 75 in the United States with a correlation coefficient (R) of 0.043 and weighted average of 51.5%, a difference of 14.4%.
Disability Age Over 75 Correlation Summary
| Measurement | Bulgarian | Dutch West Indian |
| Minimum | 12.4% | 10.0% |
| Maximum | 75.0% | 100.0% |
| Range | 62.6% | 90.0% |
| Mean | 43.6% | 58.0% |
| Median | 43.7% | 56.4% |
| Interquartile 25% (IQ1) | 39.2% | 51.4% |
| Interquartile 75% (IQ3) | 46.3% | 62.5% |
| Interquartile Range (IQR) | 7.1% | 11.1% |
| Standard Deviation (Sample) | 12.2% | 18.3% |
| Standard Deviation (Population) | 12.1% | 18.0% |
Similar Demographics by Disability Age Over 75
Demographics Similar to Bulgarians by Disability Age Over 75
In terms of disability age over 75, the demographic groups most similar to Bulgarians are Lithuanian (45.1%, a difference of 0.050%), Immigrants from Czechoslovakia (45.1%, a difference of 0.14%), Latvian (45.1%, a difference of 0.15%), Paraguayan (45.0%, a difference of 0.16%), and Immigrants from Scotland (45.1%, a difference of 0.16%).
| Demographics | Rating | Rank | Disability Age Over 75 |
| Eastern Europeans | 100.0 /100 | #3 | Exceptional 44.8% |
| Carpatho Rusyns | 100.0 /100 | #4 | Exceptional 44.8% |
| Luxembourgers | 100.0 /100 | #5 | Exceptional 44.8% |
| Immigrants | Lithuania | 100.0 /100 | #6 | Exceptional 44.9% |
| Okinawans | 100.0 /100 | #7 | Exceptional 44.9% |
| Immigrants | Austria | 100.0 /100 | #8 | Exceptional 44.9% |
| Paraguayans | 100.0 /100 | #9 | Exceptional 45.0% |
| Bulgarians | 100.0 /100 | #10 | Exceptional 45.1% |
| Lithuanians | 100.0 /100 | #11 | Exceptional 45.1% |
| Immigrants | Czechoslovakia | 100.0 /100 | #12 | Exceptional 45.1% |
| Latvians | 100.0 /100 | #13 | Exceptional 45.1% |
| Immigrants | Scotland | 100.0 /100 | #14 | Exceptional 45.1% |
| Immigrants | Sweden | 100.0 /100 | #15 | Exceptional 45.1% |
| Immigrants | Northern Europe | 100.0 /100 | #16 | Exceptional 45.2% |
| Immigrants | India | 100.0 /100 | #17 | Exceptional 45.2% |
Demographics Similar to Dutch West Indians by Disability Age Over 75
In terms of disability age over 75, the demographic groups most similar to Dutch West Indians are Paiute (51.5%, a difference of 0.0%), Seminole (51.5%, a difference of 0.15%), Creek (51.5%, a difference of 0.15%), Comanche (51.7%, a difference of 0.34%), and Yakama (51.3%, a difference of 0.48%).
| Demographics | Rating | Rank | Disability Age Over 75 |
| Immigrants | Mexico | 0.0 /100 | #314 | Tragic 51.1% |
| Mexicans | 0.0 /100 | #315 | Tragic 51.1% |
| Chickasaw | 0.0 /100 | #316 | Tragic 51.2% |
| Yakama | 0.0 /100 | #317 | Tragic 51.3% |
| Seminole | 0.0 /100 | #318 | Tragic 51.5% |
| Creek | 0.0 /100 | #319 | Tragic 51.5% |
| Paiute | 0.0 /100 | #320 | Tragic 51.5% |
| Dutch West Indians | 0.0 /100 | #321 | Tragic 51.5% |
| Comanche | 0.0 /100 | #322 | Tragic 51.7% |
| Immigrants | Yemen | 0.0 /100 | #323 | Tragic 52.0% |
| Menominee | 0.0 /100 | #324 | Tragic 52.3% |
| Immigrants | Cabo Verde | 0.0 /100 | #325 | Tragic 52.4% |
| Ute | 0.0 /100 | #326 | Tragic 52.6% |
| Nepalese | 0.0 /100 | #327 | Tragic 52.6% |
| Choctaw | 0.0 /100 | #328 | Tragic 52.7% |