British West Indian vs Welsh Cognitive Disability
COMPARE
British West Indian
Welsh
Cognitive Disability
Cognitive Disability Comparison
British West Indians
Welsh
18.2%
COGNITIVE DISABILITY
0.1/ 100
METRIC RATING
294th/ 347
METRIC RANK
17.0%
COGNITIVE DISABILITY
90.8/ 100
METRIC RATING
138th/ 347
METRIC RANK
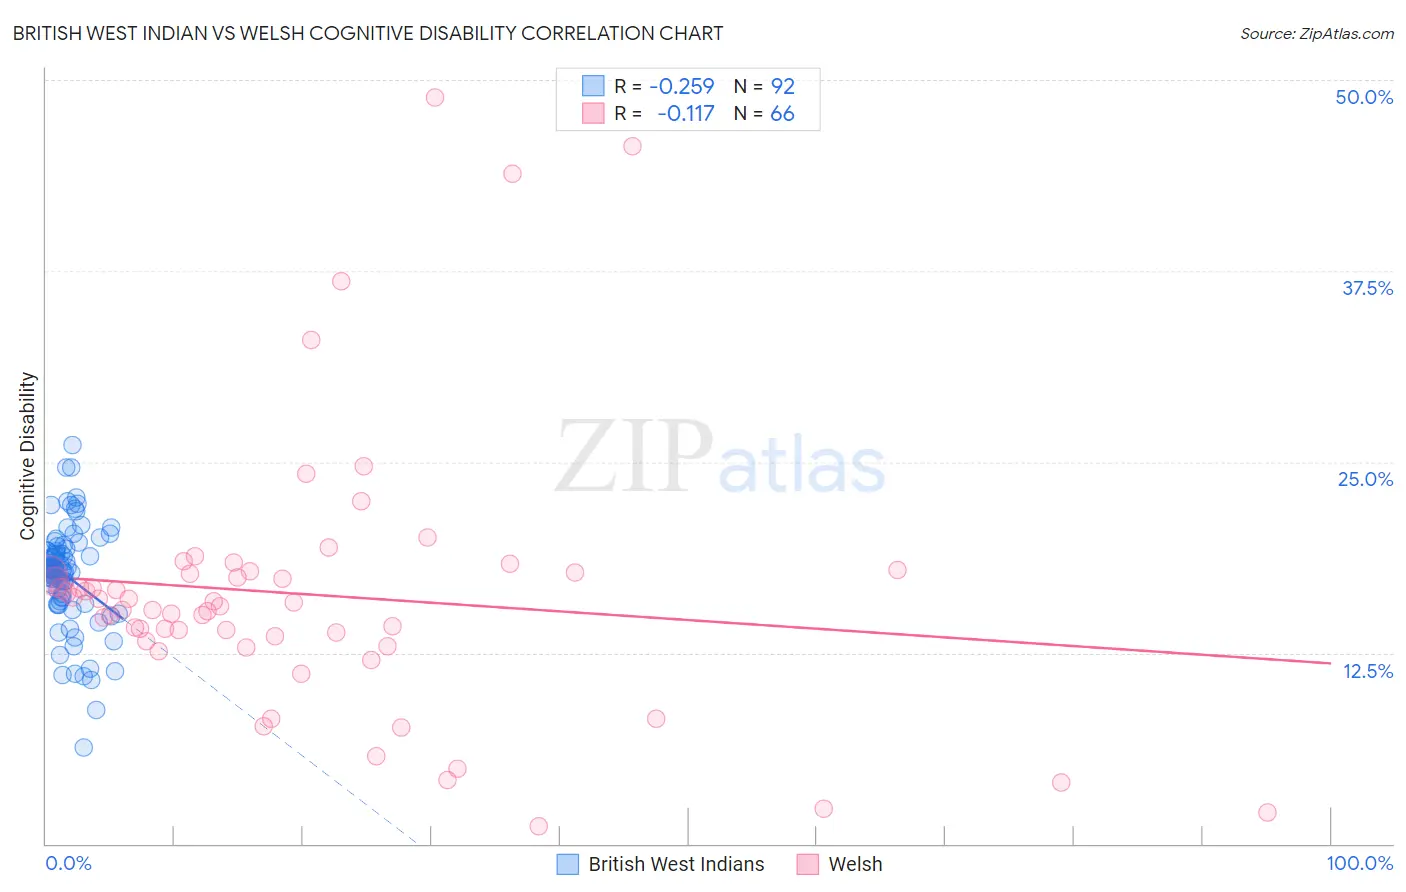
British West Indian vs Welsh Cognitive Disability Correlation Chart
The statistical analysis conducted on geographies consisting of 152,692,524 people shows a weak negative correlation between the proportion of British West Indians and percentage of population with cognitive disability in the United States with a correlation coefficient (R) of -0.259 and weighted average of 18.2%. Similarly, the statistical analysis conducted on geographies consisting of 528,521,772 people shows a poor negative correlation between the proportion of Welsh and percentage of population with cognitive disability in the United States with a correlation coefficient (R) of -0.117 and weighted average of 17.0%, a difference of 7.1%.
Cognitive Disability Correlation Summary
| Measurement | British West Indian | Welsh |
| Minimum | 6.3% | 1.2% |
| Maximum | 26.1% | 48.8% |
| Range | 19.8% | 47.7% |
| Mean | 17.5% | 16.3% |
| Median | 18.0% | 15.7% |
| Interquartile 25% (IQ1) | 16.0% | 13.2% |
| Interquartile 75% (IQ3) | 19.1% | 17.8% |
| Interquartile Range (IQR) | 3.2% | 4.5% |
| Standard Deviation (Sample) | 3.4% | 8.9% |
| Standard Deviation (Population) | 3.4% | 8.9% |
Similar Demographics by Cognitive Disability
Demographics Similar to British West Indians by Cognitive Disability
In terms of cognitive disability, the demographic groups most similar to British West Indians are Central American Indian (18.2%, a difference of 0.070%), Iroquois (18.2%, a difference of 0.080%), Ottawa (18.2%, a difference of 0.15%), German Russian (18.2%, a difference of 0.17%), and Immigrants from Burma/Myanmar (18.2%, a difference of 0.20%).
| Demographics | Rating | Rank | Cognitive Disability |
| Dutch West Indians | 0.1 /100 | #287 | Tragic 18.1% |
| Immigrants | West Indies | 0.1 /100 | #288 | Tragic 18.1% |
| Natives/Alaskans | 0.1 /100 | #289 | Tragic 18.1% |
| Immigrants | Africa | 0.1 /100 | #290 | Tragic 18.1% |
| Ottawa | 0.1 /100 | #291 | Tragic 18.2% |
| Iroquois | 0.1 /100 | #292 | Tragic 18.2% |
| Central American Indians | 0.1 /100 | #293 | Tragic 18.2% |
| British West Indians | 0.1 /100 | #294 | Tragic 18.2% |
| German Russians | 0.0 /100 | #295 | Tragic 18.2% |
| Immigrants | Burma/Myanmar | 0.0 /100 | #296 | Tragic 18.2% |
| Blackfeet | 0.0 /100 | #297 | Tragic 18.3% |
| Japanese | 0.0 /100 | #298 | Tragic 18.3% |
| Ghanaians | 0.0 /100 | #299 | Tragic 18.3% |
| Creek | 0.0 /100 | #300 | Tragic 18.3% |
| Immigrants | Ghana | 0.0 /100 | #301 | Tragic 18.3% |
Demographics Similar to Welsh by Cognitive Disability
In terms of cognitive disability, the demographic groups most similar to Welsh are Israeli (17.0%, a difference of 0.020%), Immigrants from Norway (17.0%, a difference of 0.020%), Lebanese (17.0%, a difference of 0.050%), French (17.0%, a difference of 0.070%), and Chilean (17.0%, a difference of 0.070%).
| Demographics | Rating | Rank | Cognitive Disability |
| Immigrants | Germany | 92.1 /100 | #131 | Exceptional 17.0% |
| Whites/Caucasians | 92.1 /100 | #132 | Exceptional 17.0% |
| Immigrants | Jordan | 91.9 /100 | #133 | Exceptional 17.0% |
| Immigrants | Chile | 91.7 /100 | #134 | Exceptional 17.0% |
| Lebanese | 91.3 /100 | #135 | Exceptional 17.0% |
| Israelis | 91.0 /100 | #136 | Exceptional 17.0% |
| Immigrants | Norway | 90.9 /100 | #137 | Exceptional 17.0% |
| Welsh | 90.8 /100 | #138 | Exceptional 17.0% |
| French | 90.0 /100 | #139 | Excellent 17.0% |
| Chileans | 89.9 /100 | #140 | Excellent 17.0% |
| Aleuts | 89.9 /100 | #141 | Excellent 17.0% |
| Carpatho Rusyns | 89.6 /100 | #142 | Excellent 17.0% |
| British | 89.3 /100 | #143 | Excellent 17.0% |
| Immigrants | Brazil | 89.3 /100 | #144 | Excellent 17.0% |
| Immigrants | South Eastern Asia | 88.7 /100 | #145 | Excellent 17.0% |