Brazilian vs Immigrants from Vietnam Cognitive Disability
COMPARE
Brazilian
Immigrants from Vietnam
Cognitive Disability
Cognitive Disability Comparison
Brazilians
Immigrants from Vietnam
17.1%
COGNITIVE DISABILITY
78.9/ 100
METRIC RATING
155th/ 347
METRIC RANK
17.0%
COGNITIVE DISABILITY
92.4/ 100
METRIC RATING
130th/ 347
METRIC RANK
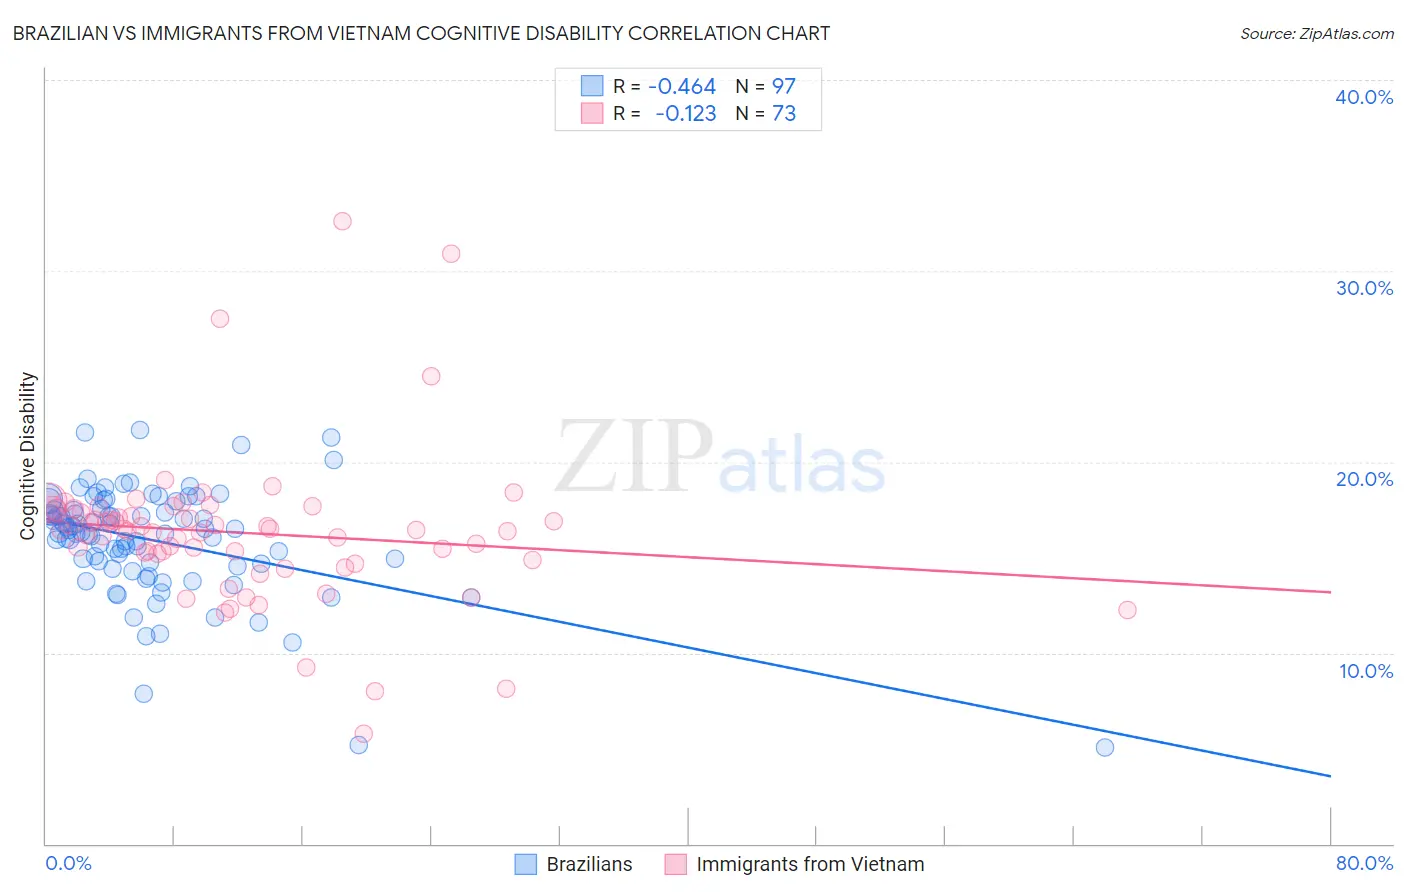
Brazilian vs Immigrants from Vietnam Cognitive Disability Correlation Chart
The statistical analysis conducted on geographies consisting of 323,952,153 people shows a moderate negative correlation between the proportion of Brazilians and percentage of population with cognitive disability in the United States with a correlation coefficient (R) of -0.464 and weighted average of 17.1%. Similarly, the statistical analysis conducted on geographies consisting of 404,767,660 people shows a poor negative correlation between the proportion of Immigrants from Vietnam and percentage of population with cognitive disability in the United States with a correlation coefficient (R) of -0.123 and weighted average of 17.0%, a difference of 0.85%.
Cognitive Disability Correlation Summary
| Measurement | Brazilian | Immigrants from Vietnam |
| Minimum | 5.1% | 5.8% |
| Maximum | 21.7% | 32.6% |
| Range | 16.6% | 26.8% |
| Mean | 15.9% | 16.3% |
| Median | 16.3% | 16.4% |
| Interquartile 25% (IQ1) | 14.6% | 15.0% |
| Interquartile 75% (IQ3) | 17.5% | 17.5% |
| Interquartile Range (IQR) | 2.9% | 2.5% |
| Standard Deviation (Sample) | 2.9% | 4.0% |
| Standard Deviation (Population) | 2.9% | 4.0% |
Similar Demographics by Cognitive Disability
Demographics Similar to Brazilians by Cognitive Disability
In terms of cognitive disability, the demographic groups most similar to Brazilians are Sri Lankan (17.1%, a difference of 0.0%), Immigrants from Malaysia (17.1%, a difference of 0.020%), Immigrants from Kazakhstan (17.1%, a difference of 0.070%), Immigrants from Australia (17.1%, a difference of 0.12%), and Immigrants from Indonesia (17.1%, a difference of 0.17%).
| Demographics | Rating | Rank | Cognitive Disability |
| French Canadians | 85.7 /100 | #148 | Excellent 17.1% |
| Cypriots | 85.7 /100 | #149 | Excellent 17.1% |
| Basques | 85.5 /100 | #150 | Excellent 17.1% |
| Syrians | 83.0 /100 | #151 | Excellent 17.1% |
| Immigrants | Indonesia | 82.7 /100 | #152 | Excellent 17.1% |
| Immigrants | Kazakhstan | 80.5 /100 | #153 | Excellent 17.1% |
| Immigrants | Malaysia | 79.3 /100 | #154 | Good 17.1% |
| Brazilians | 78.9 /100 | #155 | Good 17.1% |
| Sri Lankans | 78.9 /100 | #156 | Good 17.1% |
| Immigrants | Australia | 76.0 /100 | #157 | Good 17.1% |
| Celtics | 74.1 /100 | #158 | Good 17.1% |
| Immigrants | Latvia | 73.2 /100 | #159 | Good 17.2% |
| Australians | 72.4 /100 | #160 | Good 17.2% |
| Americans | 72.2 /100 | #161 | Good 17.2% |
| Yugoslavians | 71.6 /100 | #162 | Good 17.2% |
Demographics Similar to Immigrants from Vietnam by Cognitive Disability
In terms of cognitive disability, the demographic groups most similar to Immigrants from Vietnam are Immigrants from Germany (17.0%, a difference of 0.020%), White/Caucasian (17.0%, a difference of 0.020%), Immigrants from Jordan (17.0%, a difference of 0.050%), Immigrants from Uruguay (17.0%, a difference of 0.060%), and Nicaraguan (17.0%, a difference of 0.070%).
| Demographics | Rating | Rank | Cognitive Disability |
| Portuguese | 94.7 /100 | #123 | Exceptional 16.9% |
| Turks | 94.5 /100 | #124 | Exceptional 16.9% |
| Scandinavians | 94.1 /100 | #125 | Exceptional 16.9% |
| Europeans | 93.4 /100 | #126 | Exceptional 17.0% |
| Immigrants | Costa Rica | 93.1 /100 | #127 | Exceptional 17.0% |
| Nicaraguans | 93.0 /100 | #128 | Exceptional 17.0% |
| Immigrants | Uruguay | 92.9 /100 | #129 | Exceptional 17.0% |
| Immigrants | Vietnam | 92.4 /100 | #130 | Exceptional 17.0% |
| Immigrants | Germany | 92.1 /100 | #131 | Exceptional 17.0% |
| Whites/Caucasians | 92.1 /100 | #132 | Exceptional 17.0% |
| Immigrants | Jordan | 91.9 /100 | #133 | Exceptional 17.0% |
| Immigrants | Chile | 91.7 /100 | #134 | Exceptional 17.0% |
| Lebanese | 91.3 /100 | #135 | Exceptional 17.0% |
| Israelis | 91.0 /100 | #136 | Exceptional 17.0% |
| Immigrants | Norway | 90.9 /100 | #137 | Exceptional 17.0% |