Black/African American vs Ukrainian Disability Age 65 to 74
COMPARE
Black/African American
Ukrainian
Disability Age 65 to 74
Disability Age 65 to 74 Comparison
Blacks/African Americans
Ukrainians
27.3%
DISABILITY AGE 65 TO 74
0.0/ 100
METRIC RATING
306th/ 347
METRIC RANK
22.3%
DISABILITY AGE 65 TO 74
95.1/ 100
METRIC RATING
114th/ 347
METRIC RANK
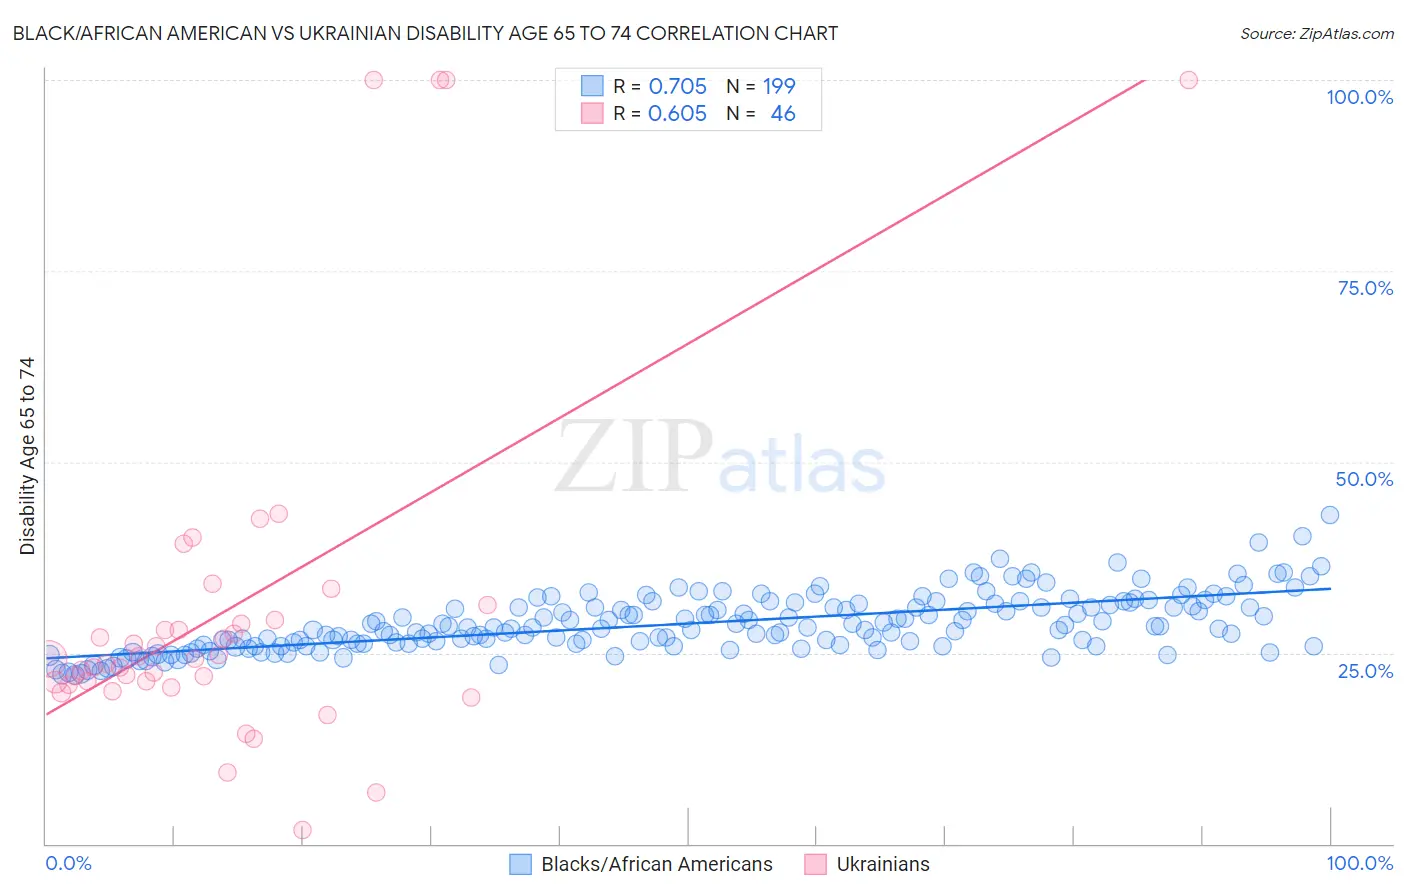
Black/African American vs Ukrainian Disability Age 65 to 74 Correlation Chart
The statistical analysis conducted on geographies consisting of 563,649,388 people shows a strong positive correlation between the proportion of Blacks/African Americans and percentage of population with a disability between the ages 65 and 75 in the United States with a correlation coefficient (R) of 0.705 and weighted average of 27.3%. Similarly, the statistical analysis conducted on geographies consisting of 447,594,992 people shows a significant positive correlation between the proportion of Ukrainians and percentage of population with a disability between the ages 65 and 75 in the United States with a correlation coefficient (R) of 0.605 and weighted average of 22.3%, a difference of 22.2%.
Disability Age 65 to 74 Correlation Summary
| Measurement | Black/African American | Ukrainian |
| Minimum | 22.1% | 1.9% |
| Maximum | 43.0% | 100.0% |
| Range | 20.9% | 98.1% |
| Mean | 28.8% | 30.8% |
| Median | 28.2% | 24.2% |
| Interquartile 25% (IQ1) | 26.1% | 21.2% |
| Interquartile 75% (IQ3) | 31.3% | 29.3% |
| Interquartile Range (IQR) | 5.2% | 8.1% |
| Standard Deviation (Sample) | 3.7% | 23.1% |
| Standard Deviation (Population) | 3.7% | 22.8% |
Similar Demographics by Disability Age 65 to 74
Demographics Similar to Blacks/African Americans by Disability Age 65 to 74
In terms of disability age 65 to 74, the demographic groups most similar to Blacks/African Americans are Ute (27.3%, a difference of 0.060%), Sioux (27.3%, a difference of 0.21%), Yaqui (27.4%, a difference of 0.27%), Shoshone (27.4%, a difference of 0.32%), and Mexican (27.2%, a difference of 0.40%).
| Demographics | Rating | Rank | Disability Age 65 to 74 |
| Potawatomi | 0.0 /100 | #299 | Tragic 27.0% |
| Immigrants | Dominican Republic | 0.0 /100 | #300 | Tragic 27.0% |
| Immigrants | Mexico | 0.0 /100 | #301 | Tragic 27.1% |
| Central American Indians | 0.0 /100 | #302 | Tragic 27.1% |
| Tlingit-Haida | 0.0 /100 | #303 | Tragic 27.1% |
| Puget Sound Salish | 0.0 /100 | #304 | Tragic 27.2% |
| Mexicans | 0.0 /100 | #305 | Tragic 27.2% |
| Blacks/African Americans | 0.0 /100 | #306 | Tragic 27.3% |
| Ute | 0.0 /100 | #307 | Tragic 27.3% |
| Sioux | 0.0 /100 | #308 | Tragic 27.3% |
| Yaqui | 0.0 /100 | #309 | Tragic 27.4% |
| Shoshone | 0.0 /100 | #310 | Tragic 27.4% |
| Menominee | 0.0 /100 | #311 | Tragic 27.4% |
| Osage | 0.0 /100 | #312 | Tragic 27.5% |
| Paiute | 0.0 /100 | #313 | Tragic 27.8% |
Demographics Similar to Ukrainians by Disability Age 65 to 74
In terms of disability age 65 to 74, the demographic groups most similar to Ukrainians are Laotian (22.3%, a difference of 0.060%), Syrian (22.3%, a difference of 0.080%), Brazilian (22.4%, a difference of 0.10%), Swedish (22.4%, a difference of 0.12%), and Austrian (22.4%, a difference of 0.12%).
| Demographics | Rating | Rank | Disability Age 65 to 74 |
| Slovenes | 96.1 /100 | #107 | Exceptional 22.2% |
| Immigrants | Zimbabwe | 96.1 /100 | #108 | Exceptional 22.3% |
| Albanians | 95.8 /100 | #109 | Exceptional 22.3% |
| Immigrants | Peru | 95.7 /100 | #110 | Exceptional 22.3% |
| Serbians | 95.7 /100 | #111 | Exceptional 22.3% |
| Immigrants | South America | 95.5 /100 | #112 | Exceptional 22.3% |
| Syrians | 95.3 /100 | #113 | Exceptional 22.3% |
| Ukrainians | 95.1 /100 | #114 | Exceptional 22.3% |
| Laotians | 94.9 /100 | #115 | Exceptional 22.3% |
| Brazilians | 94.8 /100 | #116 | Exceptional 22.4% |
| Swedes | 94.7 /100 | #117 | Exceptional 22.4% |
| Austrians | 94.7 /100 | #118 | Exceptional 22.4% |
| Immigrants | Northern Africa | 94.7 /100 | #119 | Exceptional 22.4% |
| Immigrants | Kazakhstan | 93.9 /100 | #120 | Exceptional 22.4% |
| Czechs | 93.5 /100 | #121 | Exceptional 22.4% |