Black/African American vs Immigrants from Brazil Ambulatory Disability
COMPARE
Black/African American
Immigrants from Brazil
Ambulatory Disability
Ambulatory Disability Comparison
Blacks/African Americans
Immigrants from Brazil
7.5%
AMBULATORY DISABILITY
0.0/ 100
METRIC RATING
326th/ 347
METRIC RANK
5.6%
AMBULATORY DISABILITY
99.8/ 100
METRIC RATING
57th/ 347
METRIC RANK
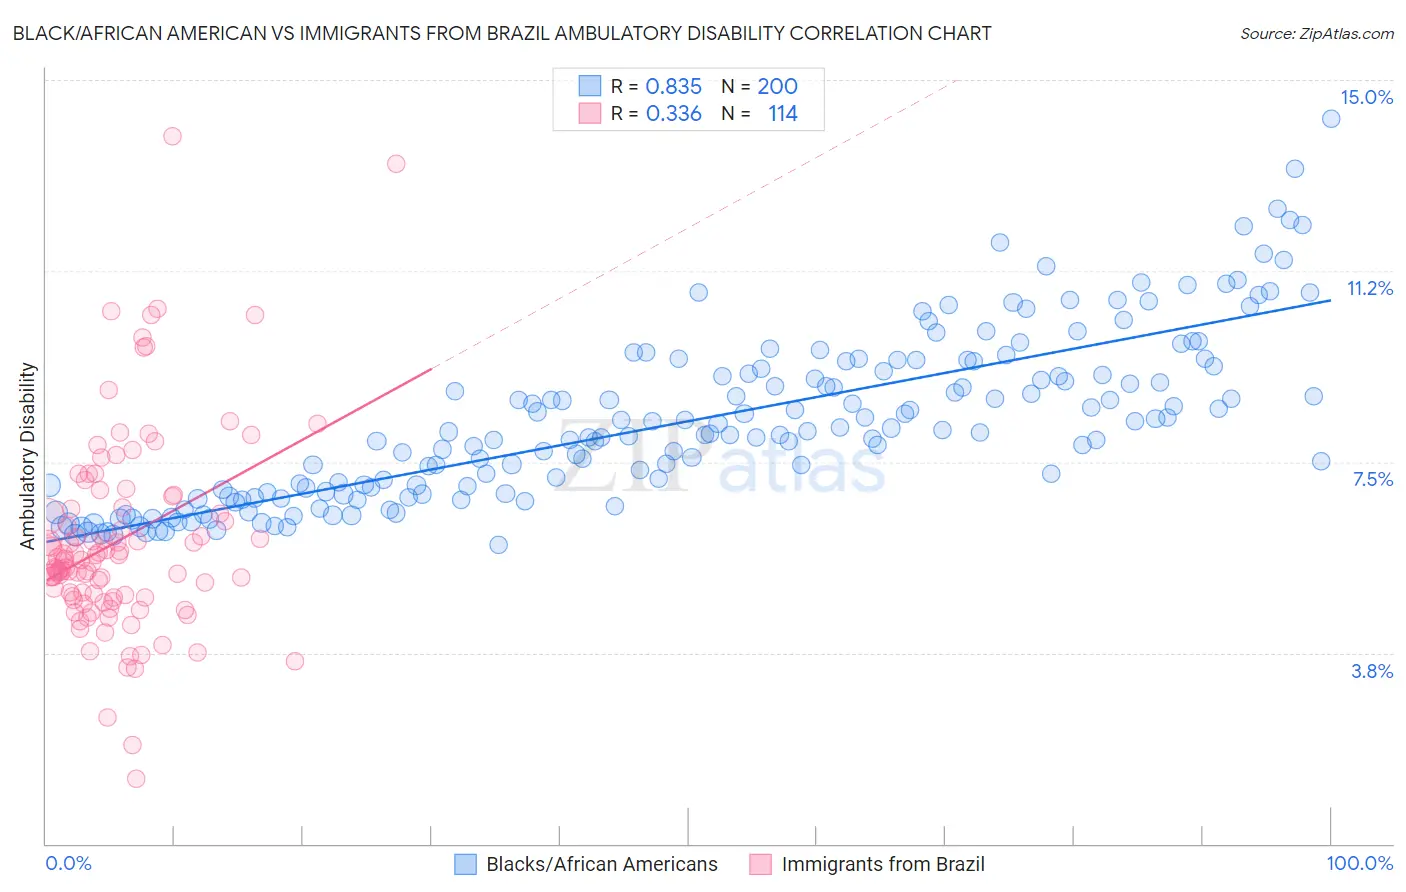
Black/African American vs Immigrants from Brazil Ambulatory Disability Correlation Chart
The statistical analysis conducted on geographies consisting of 565,519,006 people shows a very strong positive correlation between the proportion of Blacks/African Americans and percentage of population with ambulatory disability in the United States with a correlation coefficient (R) of 0.835 and weighted average of 7.5%. Similarly, the statistical analysis conducted on geographies consisting of 342,966,003 people shows a mild positive correlation between the proportion of Immigrants from Brazil and percentage of population with ambulatory disability in the United States with a correlation coefficient (R) of 0.336 and weighted average of 5.6%, a difference of 33.7%.
Ambulatory Disability Correlation Summary
| Measurement | Black/African American | Immigrants from Brazil |
| Minimum | 5.9% | 1.3% |
| Maximum | 14.3% | 13.9% |
| Range | 8.4% | 12.6% |
| Mean | 8.3% | 6.0% |
| Median | 8.1% | 5.6% |
| Interquartile 25% (IQ1) | 6.9% | 4.8% |
| Interquartile 75% (IQ3) | 9.3% | 6.6% |
| Interquartile Range (IQR) | 2.4% | 1.8% |
| Standard Deviation (Sample) | 1.6% | 2.0% |
| Standard Deviation (Population) | 1.6% | 2.0% |
Similar Demographics by Ambulatory Disability
Demographics Similar to Blacks/African Americans by Ambulatory Disability
In terms of ambulatory disability, the demographic groups most similar to Blacks/African Americans are Native/Alaskan (7.5%, a difference of 0.010%), Comanche (7.5%, a difference of 0.11%), Navajo (7.5%, a difference of 0.18%), Hopi (7.6%, a difference of 0.95%), and Pueblo (7.6%, a difference of 0.99%).
| Demographics | Rating | Rank | Ambulatory Disability |
| Dominicans | 0.0 /100 | #319 | Tragic 7.2% |
| Potawatomi | 0.0 /100 | #320 | Tragic 7.3% |
| Apache | 0.0 /100 | #321 | Tragic 7.4% |
| Osage | 0.0 /100 | #322 | Tragic 7.4% |
| Americans | 0.0 /100 | #323 | Tragic 7.4% |
| Navajo | 0.0 /100 | #324 | Tragic 7.5% |
| Comanche | 0.0 /100 | #325 | Tragic 7.5% |
| Blacks/African Americans | 0.0 /100 | #326 | Tragic 7.5% |
| Natives/Alaskans | 0.0 /100 | #327 | Tragic 7.5% |
| Hopi | 0.0 /100 | #328 | Tragic 7.6% |
| Pueblo | 0.0 /100 | #329 | Tragic 7.6% |
| Paiute | 0.0 /100 | #330 | Tragic 7.7% |
| Cajuns | 0.0 /100 | #331 | Tragic 7.8% |
| Menominee | 0.0 /100 | #332 | Tragic 7.8% |
| Cherokee | 0.0 /100 | #333 | Tragic 7.9% |
Demographics Similar to Immigrants from Brazil by Ambulatory Disability
In terms of ambulatory disability, the demographic groups most similar to Immigrants from Brazil are Immigrants from Zimbabwe (5.6%, a difference of 0.060%), Immigrants from Afghanistan (5.6%, a difference of 0.10%), Immigrants from Lithuania (5.6%, a difference of 0.14%), Inupiat (5.6%, a difference of 0.24%), and Immigrants from Belgium (5.6%, a difference of 0.26%).
| Demographics | Rating | Rank | Ambulatory Disability |
| Luxembourgers | 99.9 /100 | #50 | Exceptional 5.6% |
| Taiwanese | 99.8 /100 | #51 | Exceptional 5.6% |
| Jordanians | 99.8 /100 | #52 | Exceptional 5.6% |
| Immigrants | Egypt | 99.8 /100 | #53 | Exceptional 5.6% |
| Immigrants | Eastern Africa | 99.8 /100 | #54 | Exceptional 5.6% |
| Immigrants | Bulgaria | 99.8 /100 | #55 | Exceptional 5.6% |
| Inupiat | 99.8 /100 | #56 | Exceptional 5.6% |
| Immigrants | Brazil | 99.8 /100 | #57 | Exceptional 5.6% |
| Immigrants | Zimbabwe | 99.8 /100 | #58 | Exceptional 5.6% |
| Immigrants | Afghanistan | 99.8 /100 | #59 | Exceptional 5.6% |
| Immigrants | Lithuania | 99.8 /100 | #60 | Exceptional 5.6% |
| Immigrants | Belgium | 99.7 /100 | #61 | Exceptional 5.6% |
| Immigrants | Spain | 99.7 /100 | #62 | Exceptional 5.6% |
| Immigrants | France | 99.7 /100 | #63 | Exceptional 5.6% |
| Laotians | 99.7 /100 | #64 | Exceptional 5.7% |