Black/African American vs Belizean Disability Age 18 to 34
COMPARE
Black/African American
Belizean
Disability Age 18 to 34
Disability Age 18 to 34 Comparison
Blacks/African Americans
Belizeans
7.7%
DISABILITY AGE 18 TO 34
0.0/ 100
METRIC RATING
292nd/ 347
METRIC RANK
6.4%
DISABILITY AGE 18 TO 34
84.9/ 100
METRIC RATING
146th/ 347
METRIC RANK
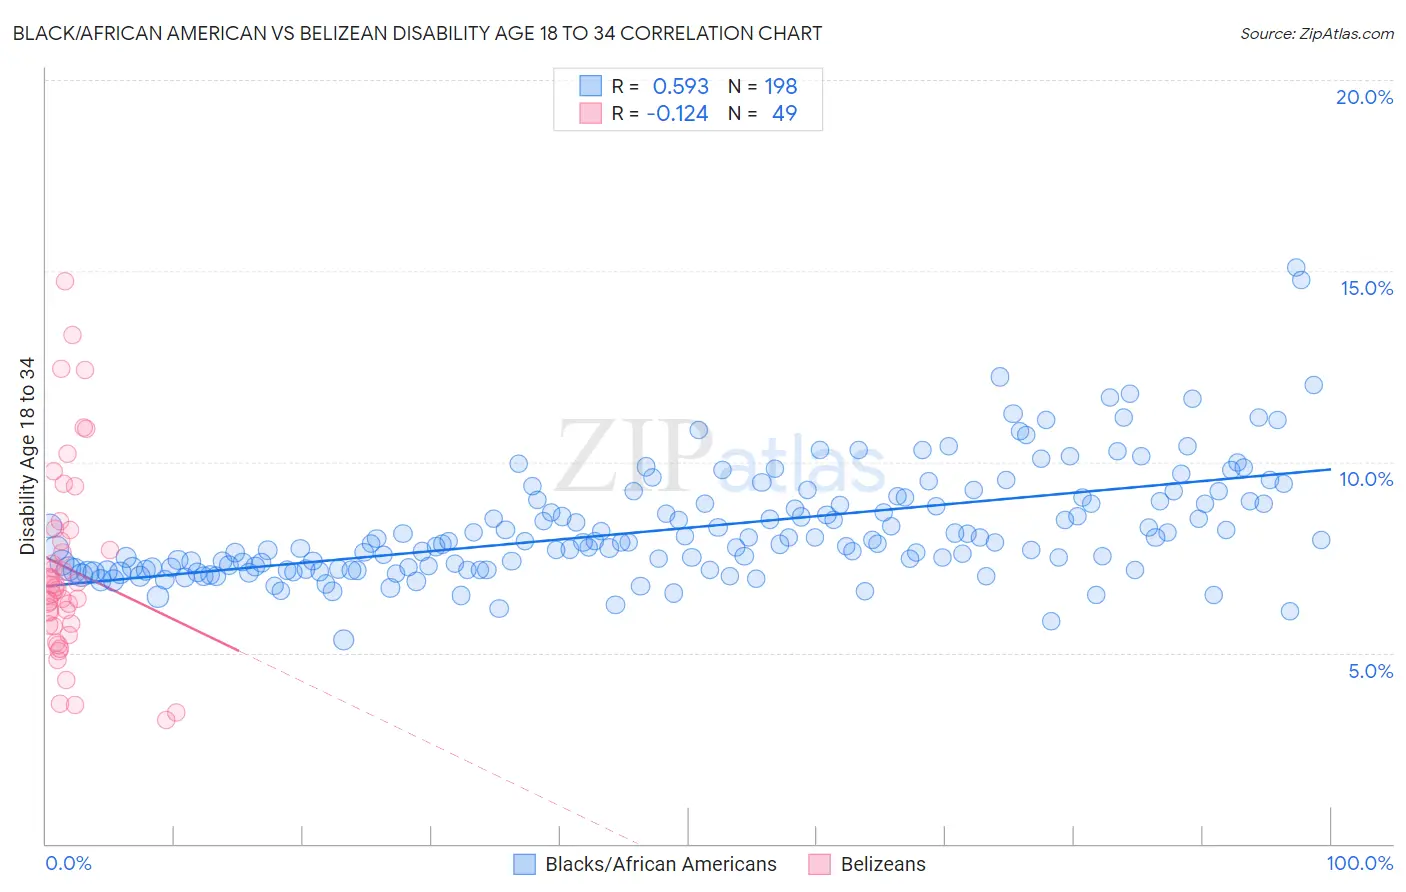
Black/African American vs Belizean Disability Age 18 to 34 Correlation Chart
The statistical analysis conducted on geographies consisting of 561,495,678 people shows a substantial positive correlation between the proportion of Blacks/African Americans and percentage of population with a disability between the ages 18 and 35 in the United States with a correlation coefficient (R) of 0.593 and weighted average of 7.7%. Similarly, the statistical analysis conducted on geographies consisting of 144,092,857 people shows a poor negative correlation between the proportion of Belizeans and percentage of population with a disability between the ages 18 and 35 in the United States with a correlation coefficient (R) of -0.124 and weighted average of 6.4%, a difference of 19.9%.
Disability Age 18 to 34 Correlation Summary
| Measurement | Black/African American | Belizean |
| Minimum | 5.3% | 3.2% |
| Maximum | 15.1% | 14.7% |
| Range | 9.7% | 11.5% |
| Mean | 8.3% | 7.2% |
| Median | 7.9% | 6.7% |
| Interquartile 25% (IQ1) | 7.2% | 5.7% |
| Interquartile 75% (IQ3) | 9.0% | 8.2% |
| Interquartile Range (IQR) | 1.8% | 2.5% |
| Standard Deviation (Sample) | 1.5% | 2.5% |
| Standard Deviation (Population) | 1.5% | 2.5% |
Similar Demographics by Disability Age 18 to 34
Demographics Similar to Blacks/African Americans by Disability Age 18 to 34
In terms of disability age 18 to 34, the demographic groups most similar to Blacks/African Americans are Scandinavian (7.7%, a difference of 0.060%), Immigrants from Cabo Verde (7.7%, a difference of 0.21%), Irish (7.7%, a difference of 0.22%), Tlingit-Haida (7.7%, a difference of 0.22%), and Slovak (7.7%, a difference of 0.27%).
| Demographics | Rating | Rank | Disability Age 18 to 34 |
| Swedes | 0.0 /100 | #285 | Tragic 7.5% |
| Celtics | 0.0 /100 | #286 | Tragic 7.6% |
| Norwegians | 0.0 /100 | #287 | Tragic 7.6% |
| Whites/Caucasians | 0.0 /100 | #288 | Tragic 7.6% |
| Immigrants | Nonimmigrants | 0.0 /100 | #289 | Tragic 7.6% |
| Slovaks | 0.0 /100 | #290 | Tragic 7.7% |
| Irish | 0.0 /100 | #291 | Tragic 7.7% |
| Blacks/African Americans | 0.0 /100 | #292 | Tragic 7.7% |
| Scandinavians | 0.0 /100 | #293 | Tragic 7.7% |
| Immigrants | Cabo Verde | 0.0 /100 | #294 | Tragic 7.7% |
| Tlingit-Haida | 0.0 /100 | #295 | Tragic 7.7% |
| Cape Verdeans | 0.0 /100 | #296 | Tragic 7.7% |
| Pueblo | 0.0 /100 | #297 | Tragic 7.7% |
| Dutch | 0.0 /100 | #298 | Tragic 7.7% |
| Germans | 0.0 /100 | #299 | Tragic 7.7% |
Demographics Similar to Belizeans by Disability Age 18 to 34
In terms of disability age 18 to 34, the demographic groups most similar to Belizeans are Moroccan (6.4%, a difference of 0.050%), Albanian (6.4%, a difference of 0.060%), Immigrants from South Africa (6.4%, a difference of 0.16%), Immigrants from Belgium (6.4%, a difference of 0.18%), and Immigrants from Latvia (6.4%, a difference of 0.23%).
| Demographics | Rating | Rank | Disability Age 18 to 34 |
| Immigrants | Belize | 87.4 /100 | #139 | Excellent 6.4% |
| Immigrants | Fiji | 87.3 /100 | #140 | Excellent 6.4% |
| Jamaicans | 86.8 /100 | #141 | Excellent 6.4% |
| South American Indians | 86.5 /100 | #142 | Excellent 6.4% |
| Immigrants | Latvia | 86.4 /100 | #143 | Excellent 6.4% |
| Albanians | 85.3 /100 | #144 | Excellent 6.4% |
| Moroccans | 85.2 /100 | #145 | Excellent 6.4% |
| Belizeans | 84.9 /100 | #146 | Excellent 6.4% |
| Immigrants | South Africa | 83.7 /100 | #147 | Excellent 6.4% |
| Immigrants | Belgium | 83.5 /100 | #148 | Excellent 6.4% |
| Hondurans | 83.1 /100 | #149 | Excellent 6.4% |
| Immigrants | Dominican Republic | 82.7 /100 | #150 | Excellent 6.4% |
| Tongans | 81.9 /100 | #151 | Excellent 6.4% |
| Bulgarians | 78.3 /100 | #152 | Good 6.5% |
| Immigrants | Eritrea | 77.4 /100 | #153 | Good 6.5% |