Blackfeet vs Hmong Vision Disability
COMPARE
Blackfeet
Hmong
Vision Disability
Vision Disability Comparison
Blackfeet
Hmong
2.6%
VISION DISABILITY
0.0/ 100
METRIC RATING
310th/ 347
METRIC RANK
2.3%
VISION DISABILITY
2.5/ 100
METRIC RATING
228th/ 347
METRIC RANK
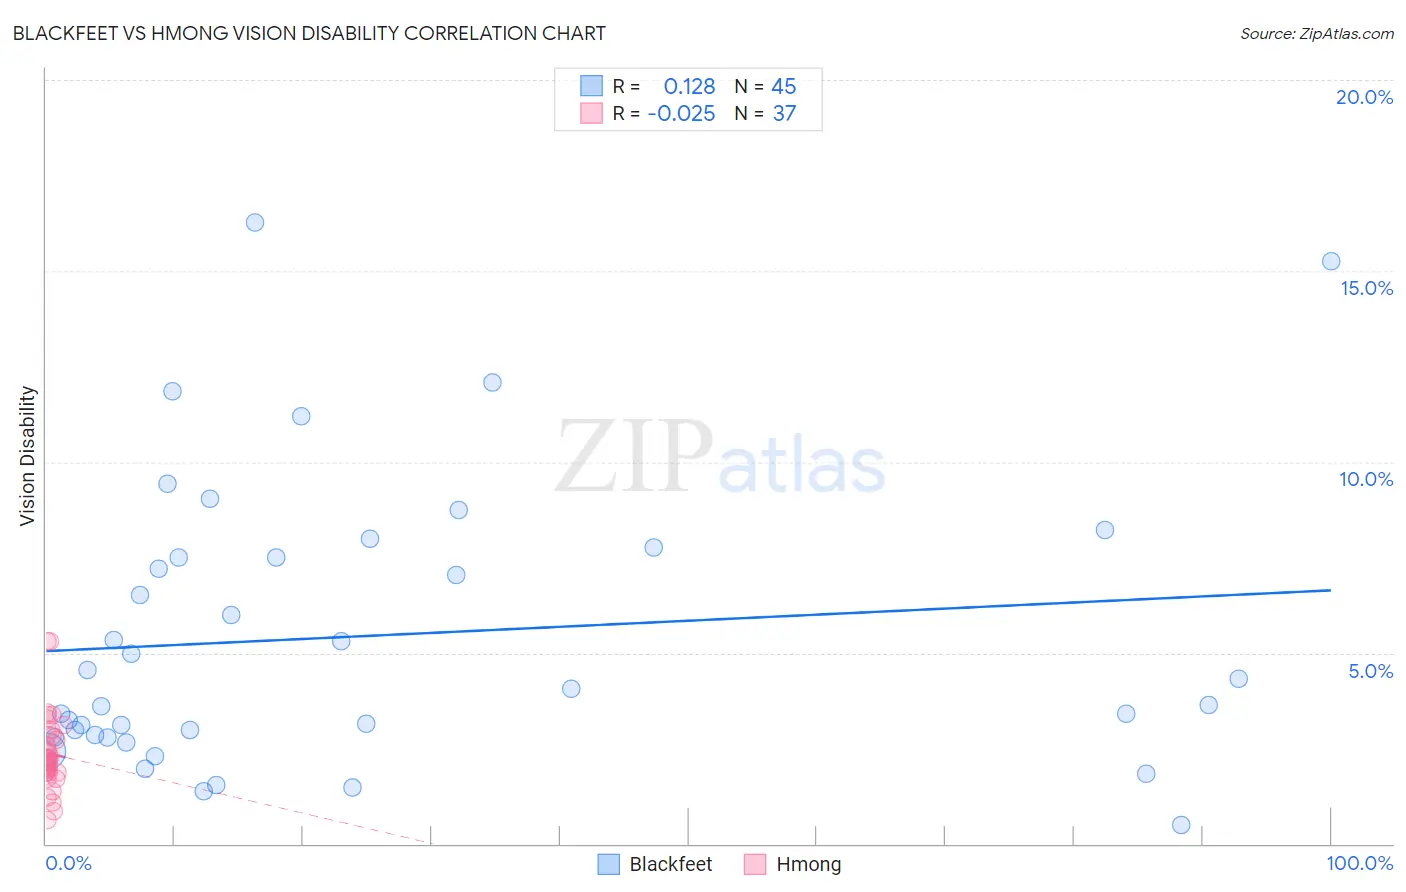
Blackfeet vs Hmong Vision Disability Correlation Chart
The statistical analysis conducted on geographies consisting of 309,368,120 people shows a poor positive correlation between the proportion of Blackfeet and percentage of population with vision disability in the United States with a correlation coefficient (R) of 0.128 and weighted average of 2.6%. Similarly, the statistical analysis conducted on geographies consisting of 24,669,236 people shows no correlation between the proportion of Hmong and percentage of population with vision disability in the United States with a correlation coefficient (R) of -0.025 and weighted average of 2.3%, a difference of 14.5%.
Vision Disability Correlation Summary
| Measurement | Blackfeet | Hmong |
| Minimum | 0.51% | 0.63% |
| Maximum | 16.3% | 5.3% |
| Range | 15.8% | 4.7% |
| Mean | 5.4% | 2.4% |
| Median | 4.1% | 2.2% |
| Interquartile 25% (IQ1) | 2.8% | 1.9% |
| Interquartile 75% (IQ3) | 7.6% | 2.8% |
| Interquartile Range (IQR) | 4.8% | 0.96% |
| Standard Deviation (Sample) | 3.7% | 0.98% |
| Standard Deviation (Population) | 3.7% | 0.97% |
Similar Demographics by Vision Disability
Demographics Similar to Blackfeet by Vision Disability
In terms of vision disability, the demographic groups most similar to Blackfeet are Dominican (2.6%, a difference of 0.040%), Immigrants from Yemen (2.6%, a difference of 0.32%), Arapaho (2.6%, a difference of 0.61%), Immigrants from Dominican Republic (2.6%, a difference of 0.63%), and Iroquois (2.6%, a difference of 0.65%).
| Demographics | Rating | Rank | Vision Disability |
| Immigrants | Cabo Verde | 0.0 /100 | #303 | Tragic 2.6% |
| Aleuts | 0.0 /100 | #304 | Tragic 2.6% |
| Hispanics or Latinos | 0.0 /100 | #305 | Tragic 2.6% |
| Iroquois | 0.0 /100 | #306 | Tragic 2.6% |
| Immigrants | Dominican Republic | 0.0 /100 | #307 | Tragic 2.6% |
| Arapaho | 0.0 /100 | #308 | Tragic 2.6% |
| Immigrants | Yemen | 0.0 /100 | #309 | Tragic 2.6% |
| Blackfeet | 0.0 /100 | #310 | Tragic 2.6% |
| Dominicans | 0.0 /100 | #311 | Tragic 2.6% |
| Americans | 0.0 /100 | #312 | Tragic 2.6% |
| Potawatomi | 0.0 /100 | #313 | Tragic 2.6% |
| Inupiat | 0.0 /100 | #314 | Tragic 2.7% |
| Osage | 0.0 /100 | #315 | Tragic 2.7% |
| Shoshone | 0.0 /100 | #316 | Tragic 2.7% |
| Yup'ik | 0.0 /100 | #317 | Tragic 2.7% |
Demographics Similar to Hmong by Vision Disability
In terms of vision disability, the demographic groups most similar to Hmong are Welsh (2.3%, a difference of 0.080%), Nicaraguan (2.3%, a difference of 0.15%), Hawaiian (2.3%, a difference of 0.24%), Immigrants from Germany (2.3%, a difference of 0.29%), and Immigrants from Ecuador (2.3%, a difference of 0.31%).
| Demographics | Rating | Rank | Vision Disability |
| French Canadians | 3.9 /100 | #221 | Tragic 2.3% |
| Immigrants | Senegal | 3.8 /100 | #222 | Tragic 2.3% |
| Basques | 3.5 /100 | #223 | Tragic 2.3% |
| Irish | 3.4 /100 | #224 | Tragic 2.3% |
| Immigrants | Western Africa | 3.4 /100 | #225 | Tragic 2.3% |
| Immigrants | Germany | 3.0 /100 | #226 | Tragic 2.3% |
| Hawaiians | 2.9 /100 | #227 | Tragic 2.3% |
| Hmong | 2.5 /100 | #228 | Tragic 2.3% |
| Welsh | 2.3 /100 | #229 | Tragic 2.3% |
| Nicaraguans | 2.2 /100 | #230 | Tragic 2.3% |
| Immigrants | Ecuador | 2.0 /100 | #231 | Tragic 2.3% |
| German Russians | 1.8 /100 | #232 | Tragic 2.3% |
| Central Americans | 1.8 /100 | #233 | Tragic 2.3% |
| Scottish | 1.6 /100 | #234 | Tragic 2.3% |
| Marshallese | 1.5 /100 | #235 | Tragic 2.3% |