Belizean vs Immigrants from Bosnia and Herzegovina Vision Disability
COMPARE
Belizean
Immigrants from Bosnia and Herzegovina
Vision Disability
Vision Disability Comparison
Belizeans
Immigrants from Bosnia and Herzegovina
2.4%
VISION DISABILITY
0.2/ 100
METRIC RATING
260th/ 347
METRIC RANK
2.1%
VISION DISABILITY
81.5/ 100
METRIC RATING
145th/ 347
METRIC RANK
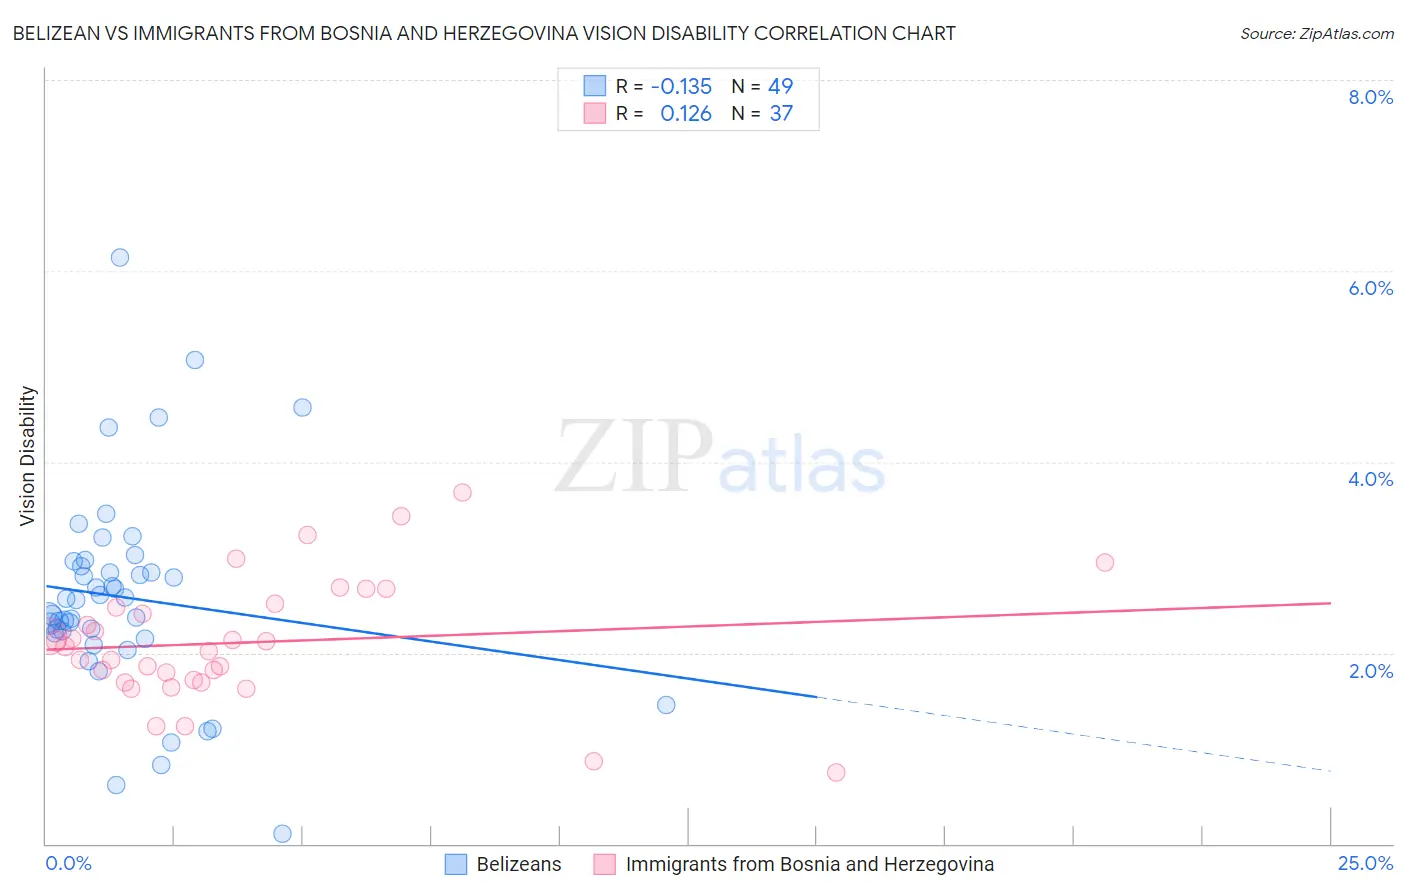
Belizean vs Immigrants from Bosnia and Herzegovina Vision Disability Correlation Chart
The statistical analysis conducted on geographies consisting of 144,166,801 people shows a poor negative correlation between the proportion of Belizeans and percentage of population with vision disability in the United States with a correlation coefficient (R) of -0.135 and weighted average of 2.4%. Similarly, the statistical analysis conducted on geographies consisting of 156,802,362 people shows a poor positive correlation between the proportion of Immigrants from Bosnia and Herzegovina and percentage of population with vision disability in the United States with a correlation coefficient (R) of 0.126 and weighted average of 2.1%, a difference of 12.6%.
Vision Disability Correlation Summary
| Measurement | Belizean | Immigrants from Bosnia and Herzegovina |
| Minimum | 0.11% | 0.75% |
| Maximum | 6.1% | 3.7% |
| Range | 6.0% | 2.9% |
| Mean | 2.6% | 2.1% |
| Median | 2.6% | 2.1% |
| Interquartile 25% (IQ1) | 2.2% | 1.7% |
| Interquartile 75% (IQ3) | 2.9% | 2.5% |
| Interquartile Range (IQR) | 0.76% | 0.80% |
| Standard Deviation (Sample) | 1.1% | 0.64% |
| Standard Deviation (Population) | 1.1% | 0.64% |
Similar Demographics by Vision Disability
Demographics Similar to Belizeans by Vision Disability
In terms of vision disability, the demographic groups most similar to Belizeans are White/Caucasian (2.4%, a difference of 0.17%), British West Indian (2.4%, a difference of 0.18%), West Indian (2.4%, a difference of 0.21%), Fijian (2.4%, a difference of 0.21%), and Jamaican (2.4%, a difference of 0.24%).
| Demographics | Rating | Rank | Vision Disability |
| Japanese | 0.3 /100 | #253 | Tragic 2.4% |
| Haitians | 0.3 /100 | #254 | Tragic 2.4% |
| Immigrants | Guatemala | 0.3 /100 | #255 | Tragic 2.4% |
| Immigrants | Haiti | 0.2 /100 | #256 | Tragic 2.4% |
| West Indians | 0.2 /100 | #257 | Tragic 2.4% |
| British West Indians | 0.2 /100 | #258 | Tragic 2.4% |
| Whites/Caucasians | 0.2 /100 | #259 | Tragic 2.4% |
| Belizeans | 0.2 /100 | #260 | Tragic 2.4% |
| Fijians | 0.1 /100 | #261 | Tragic 2.4% |
| Jamaicans | 0.1 /100 | #262 | Tragic 2.4% |
| Immigrants | Belize | 0.1 /100 | #263 | Tragic 2.4% |
| Immigrants | Liberia | 0.1 /100 | #264 | Tragic 2.4% |
| Immigrants | Jamaica | 0.1 /100 | #265 | Tragic 2.4% |
| Mexican American Indians | 0.1 /100 | #266 | Tragic 2.4% |
| Ute | 0.1 /100 | #267 | Tragic 2.4% |
Demographics Similar to Immigrants from Bosnia and Herzegovina by Vision Disability
In terms of vision disability, the demographic groups most similar to Immigrants from Bosnia and Herzegovina are Ukrainian (2.1%, a difference of 0.040%), South American (2.1%, a difference of 0.15%), Immigrants from Sierra Leone (2.1%, a difference of 0.15%), Italian (2.1%, a difference of 0.18%), and Sierra Leonean (2.1%, a difference of 0.30%).
| Demographics | Rating | Rank | Vision Disability |
| Arabs | 86.3 /100 | #138 | Excellent 2.1% |
| Immigrants | Morocco | 85.2 /100 | #139 | Excellent 2.1% |
| Immigrants | Netherlands | 84.2 /100 | #140 | Excellent 2.1% |
| Sierra Leoneans | 84.1 /100 | #141 | Excellent 2.1% |
| South Americans | 82.8 /100 | #142 | Excellent 2.1% |
| Immigrants | Sierra Leone | 82.8 /100 | #143 | Excellent 2.1% |
| Ukrainians | 81.9 /100 | #144 | Excellent 2.1% |
| Immigrants | Bosnia and Herzegovina | 81.5 /100 | #145 | Excellent 2.1% |
| Italians | 79.7 /100 | #146 | Good 2.1% |
| Immigrants | Sudan | 78.4 /100 | #147 | Good 2.1% |
| Finns | 78.3 /100 | #148 | Good 2.1% |
| Colombians | 76.2 /100 | #149 | Good 2.1% |
| Belgians | 75.9 /100 | #150 | Good 2.1% |
| Immigrants | Norway | 75.5 /100 | #151 | Good 2.1% |
| Immigrants | Southern Europe | 74.6 /100 | #152 | Good 2.1% |