Basque vs Soviet Union Ambulatory Disability
COMPARE
Basque
Soviet Union
Ambulatory Disability
Ambulatory Disability Comparison
Basques
Soviet Union
6.1%
AMBULATORY DISABILITY
63.7/ 100
METRIC RATING
164th/ 347
METRIC RANK
5.8%
AMBULATORY DISABILITY
98.9/ 100
METRIC RATING
88th/ 347
METRIC RANK
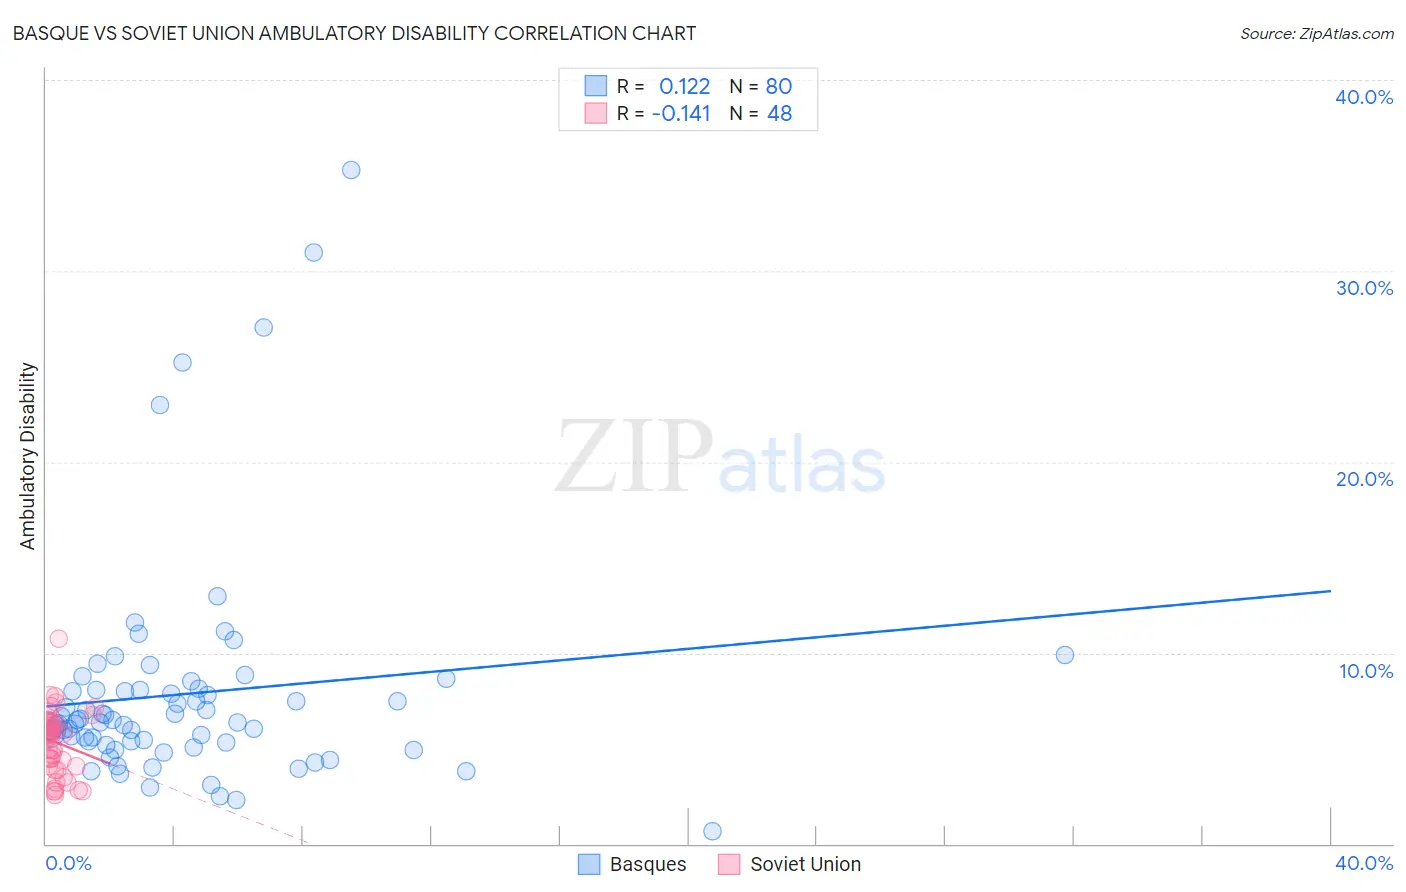
Basque vs Soviet Union Ambulatory Disability Correlation Chart
The statistical analysis conducted on geographies consisting of 165,766,481 people shows a poor positive correlation between the proportion of Basques and percentage of population with ambulatory disability in the United States with a correlation coefficient (R) of 0.122 and weighted average of 6.1%. Similarly, the statistical analysis conducted on geographies consisting of 43,487,843 people shows a poor negative correlation between the proportion of Soviet Union and percentage of population with ambulatory disability in the United States with a correlation coefficient (R) of -0.141 and weighted average of 5.8%, a difference of 5.5%.
Ambulatory Disability Correlation Summary
| Measurement | Basque | Soviet Union |
| Minimum | 0.67% | 2.6% |
| Maximum | 35.3% | 10.8% |
| Range | 34.6% | 8.2% |
| Mean | 7.8% | 5.3% |
| Median | 6.4% | 5.7% |
| Interquartile 25% (IQ1) | 5.3% | 4.1% |
| Interquartile 75% (IQ3) | 8.0% | 6.3% |
| Interquartile Range (IQR) | 2.7% | 2.3% |
| Standard Deviation (Sample) | 5.8% | 1.7% |
| Standard Deviation (Population) | 5.8% | 1.6% |
Similar Demographics by Ambulatory Disability
Demographics Similar to Basques by Ambulatory Disability
In terms of ambulatory disability, the demographic groups most similar to Basques are Nicaraguan (6.1%, a difference of 0.030%), Iraqi (6.1%, a difference of 0.050%), Lebanese (6.1%, a difference of 0.15%), Immigrants from Oceania (6.1%, a difference of 0.17%), and Ecuadorian (6.1%, a difference of 0.18%).
| Demographics | Rating | Rank | Ambulatory Disability |
| Ghanaians | 71.3 /100 | #157 | Good 6.0% |
| Immigrants | Fiji | 71.2 /100 | #158 | Good 6.0% |
| Immigrants | Latvia | 71.1 /100 | #159 | Good 6.0% |
| Central Americans | 69.8 /100 | #160 | Good 6.0% |
| Immigrants | Belarus | 69.2 /100 | #161 | Good 6.1% |
| Nigerians | 67.1 /100 | #162 | Good 6.1% |
| Lebanese | 66.2 /100 | #163 | Good 6.1% |
| Basques | 63.7 /100 | #164 | Good 6.1% |
| Nicaraguans | 63.2 /100 | #165 | Good 6.1% |
| Iraqis | 62.8 /100 | #166 | Good 6.1% |
| Immigrants | Oceania | 60.7 /100 | #167 | Good 6.1% |
| Ecuadorians | 60.5 /100 | #168 | Good 6.1% |
| Immigrants | Southern Europe | 58.1 /100 | #169 | Average 6.1% |
| Immigrants | Ecuador | 53.8 /100 | #170 | Average 6.1% |
| Moroccans | 52.6 /100 | #171 | Average 6.1% |
Demographics Similar to Soviet Union by Ambulatory Disability
In terms of ambulatory disability, the demographic groups most similar to Soviet Union are Immigrants from Chile (5.8%, a difference of 0.040%), Latvian (5.7%, a difference of 0.11%), Bhutanese (5.8%, a difference of 0.12%), Australian (5.8%, a difference of 0.12%), and Immigrants from Sudan (5.8%, a difference of 0.12%).
| Demographics | Rating | Rank | Ambulatory Disability |
| Immigrants | Jordan | 99.2 /100 | #81 | Exceptional 5.7% |
| Palestinians | 99.2 /100 | #82 | Exceptional 5.7% |
| Eastern Europeans | 99.2 /100 | #83 | Exceptional 5.7% |
| Ugandans | 99.2 /100 | #84 | Exceptional 5.7% |
| South Americans | 99.0 /100 | #85 | Exceptional 5.7% |
| Latvians | 99.0 /100 | #86 | Exceptional 5.7% |
| Immigrants | Chile | 98.9 /100 | #87 | Exceptional 5.8% |
| Soviet Union | 98.9 /100 | #88 | Exceptional 5.8% |
| Bhutanese | 98.8 /100 | #89 | Exceptional 5.8% |
| Australians | 98.8 /100 | #90 | Exceptional 5.8% |
| Immigrants | Sudan | 98.8 /100 | #91 | Exceptional 5.8% |
| Immigrants | Sierra Leone | 98.6 /100 | #92 | Exceptional 5.8% |
| Immigrants | Denmark | 98.6 /100 | #93 | Exceptional 5.8% |
| Kenyans | 98.4 /100 | #94 | Exceptional 5.8% |
| Immigrants | El Salvador | 98.4 /100 | #95 | Exceptional 5.8% |