Bangladeshi vs Immigrants from Serbia Vision Disability
COMPARE
Bangladeshi
Immigrants from Serbia
Vision Disability
Vision Disability Comparison
Bangladeshis
Immigrants from Serbia
2.3%
VISION DISABILITY
0.5/ 100
METRIC RATING
250th/ 347
METRIC RANK
2.0%
VISION DISABILITY
99.4/ 100
METRIC RATING
52nd/ 347
METRIC RANK
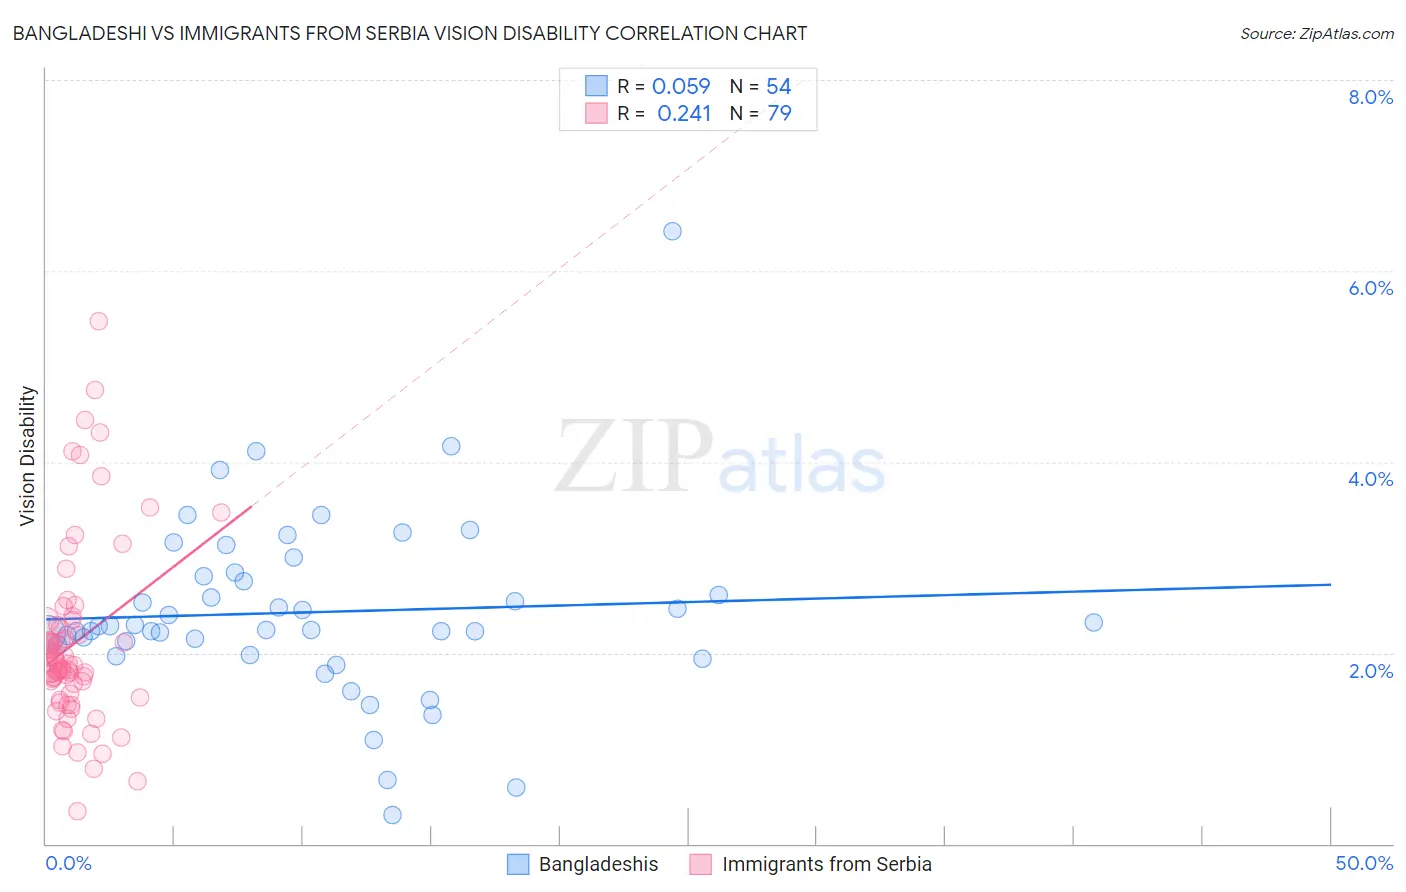
Bangladeshi vs Immigrants from Serbia Vision Disability Correlation Chart
The statistical analysis conducted on geographies consisting of 141,342,048 people shows a slight positive correlation between the proportion of Bangladeshis and percentage of population with vision disability in the United States with a correlation coefficient (R) of 0.059 and weighted average of 2.3%. Similarly, the statistical analysis conducted on geographies consisting of 131,728,789 people shows a weak positive correlation between the proportion of Immigrants from Serbia and percentage of population with vision disability in the United States with a correlation coefficient (R) of 0.241 and weighted average of 2.0%, a difference of 17.9%.
Vision Disability Correlation Summary
| Measurement | Bangladeshi | Immigrants from Serbia |
| Minimum | 0.30% | 0.34% |
| Maximum | 6.4% | 5.5% |
| Range | 6.1% | 5.1% |
| Mean | 2.4% | 2.1% |
| Median | 2.3% | 1.9% |
| Interquartile 25% (IQ1) | 2.1% | 1.6% |
| Interquartile 75% (IQ3) | 2.8% | 2.3% |
| Interquartile Range (IQR) | 0.72% | 0.72% |
| Standard Deviation (Sample) | 0.96% | 0.94% |
| Standard Deviation (Population) | 0.95% | 0.94% |
Similar Demographics by Vision Disability
Demographics Similar to Bangladeshis by Vision Disability
In terms of vision disability, the demographic groups most similar to Bangladeshis are Liberian (2.3%, a difference of 0.080%), Subsaharan African (2.3%, a difference of 0.10%), Immigrants from Laos (2.4%, a difference of 0.11%), Guatemalan (2.3%, a difference of 0.12%), and French (2.3%, a difference of 0.15%).
| Demographics | Rating | Rank | Vision Disability |
| Immigrants | Nicaragua | 0.6 /100 | #243 | Tragic 2.3% |
| Immigrants | West Indies | 0.6 /100 | #244 | Tragic 2.3% |
| Alsatians | 0.6 /100 | #245 | Tragic 2.3% |
| French | 0.5 /100 | #246 | Tragic 2.3% |
| Guatemalans | 0.5 /100 | #247 | Tragic 2.3% |
| Sub-Saharan Africans | 0.5 /100 | #248 | Tragic 2.3% |
| Liberians | 0.5 /100 | #249 | Tragic 2.3% |
| Bangladeshis | 0.5 /100 | #250 | Tragic 2.3% |
| Immigrants | Laos | 0.4 /100 | #251 | Tragic 2.4% |
| Immigrants | Micronesia | 0.3 /100 | #252 | Tragic 2.4% |
| Japanese | 0.3 /100 | #253 | Tragic 2.4% |
| Haitians | 0.3 /100 | #254 | Tragic 2.4% |
| Immigrants | Guatemala | 0.3 /100 | #255 | Tragic 2.4% |
| Immigrants | Haiti | 0.2 /100 | #256 | Tragic 2.4% |
| West Indians | 0.2 /100 | #257 | Tragic 2.4% |
Demographics Similar to Immigrants from Serbia by Vision Disability
In terms of vision disability, the demographic groups most similar to Immigrants from Serbia are Immigrants from Belarus (2.0%, a difference of 0.11%), Macedonian (2.0%, a difference of 0.15%), Laotian (2.0%, a difference of 0.21%), Tongan (2.0%, a difference of 0.31%), and Jordanian (2.0%, a difference of 0.37%).
| Demographics | Rating | Rank | Vision Disability |
| Ethiopians | 99.7 /100 | #45 | Exceptional 2.0% |
| Immigrants | Sweden | 99.7 /100 | #46 | Exceptional 2.0% |
| Immigrants | Bulgaria | 99.7 /100 | #47 | Exceptional 2.0% |
| Israelis | 99.6 /100 | #48 | Exceptional 2.0% |
| Latvians | 99.5 /100 | #49 | Exceptional 2.0% |
| Afghans | 99.5 /100 | #50 | Exceptional 2.0% |
| Tongans | 99.5 /100 | #51 | Exceptional 2.0% |
| Immigrants | Serbia | 99.4 /100 | #52 | Exceptional 2.0% |
| Immigrants | Belarus | 99.3 /100 | #53 | Exceptional 2.0% |
| Macedonians | 99.3 /100 | #54 | Exceptional 2.0% |
| Laotians | 99.3 /100 | #55 | Exceptional 2.0% |
| Jordanians | 99.2 /100 | #56 | Exceptional 2.0% |
| Somalis | 99.2 /100 | #57 | Exceptional 2.0% |
| Immigrants | Saudi Arabia | 99.2 /100 | #58 | Exceptional 2.0% |
| Argentineans | 99.1 /100 | #59 | Exceptional 2.0% |