Bahamian vs Paraguayan Disability Age 18 to 34
COMPARE
Bahamian
Paraguayan
Disability Age 18 to 34
Disability Age 18 to 34 Comparison
Bahamians
Paraguayans
6.6%
DISABILITY AGE 18 TO 34
55.5/ 100
METRIC RATING
171st/ 347
METRIC RANK
5.9%
DISABILITY AGE 18 TO 34
99.7/ 100
METRIC RATING
56th/ 347
METRIC RANK
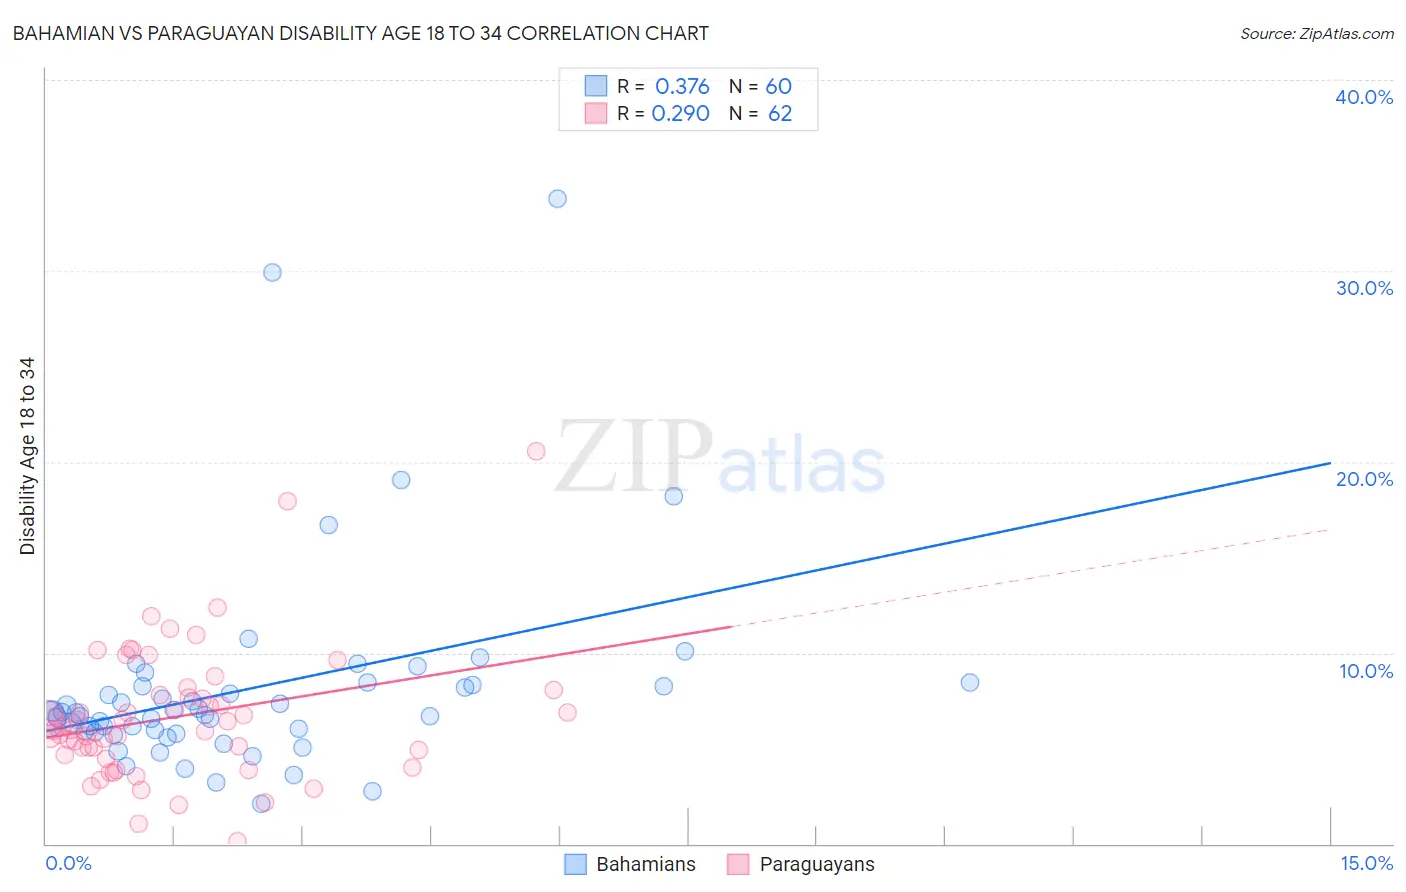
Bahamian vs Paraguayan Disability Age 18 to 34 Correlation Chart
The statistical analysis conducted on geographies consisting of 112,638,340 people shows a mild positive correlation between the proportion of Bahamians and percentage of population with a disability between the ages 18 and 35 in the United States with a correlation coefficient (R) of 0.376 and weighted average of 6.6%. Similarly, the statistical analysis conducted on geographies consisting of 95,068,899 people shows a weak positive correlation between the proportion of Paraguayans and percentage of population with a disability between the ages 18 and 35 in the United States with a correlation coefficient (R) of 0.290 and weighted average of 5.9%, a difference of 10.7%.
Disability Age 18 to 34 Correlation Summary
| Measurement | Bahamian | Paraguayan |
| Minimum | 2.1% | 0.13% |
| Maximum | 33.8% | 20.6% |
| Range | 31.7% | 20.5% |
| Mean | 8.1% | 6.6% |
| Median | 6.8% | 6.0% |
| Interquartile 25% (IQ1) | 5.9% | 4.6% |
| Interquartile 75% (IQ3) | 8.3% | 7.8% |
| Interquartile Range (IQR) | 2.4% | 3.1% |
| Standard Deviation (Sample) | 5.4% | 3.5% |
| Standard Deviation (Population) | 5.4% | 3.5% |
Similar Demographics by Disability Age 18 to 34
Demographics Similar to Bahamians by Disability Age 18 to 34
In terms of disability age 18 to 34, the demographic groups most similar to Bahamians are Ghanaian (6.6%, a difference of 0.050%), Immigrants from Mexico (6.6%, a difference of 0.10%), Immigrants from Bahamas (6.6%, a difference of 0.17%), Russian (6.5%, a difference of 0.34%), and Native Hawaiian (6.6%, a difference of 0.38%).
| Demographics | Rating | Rank | Disability Age 18 to 34 |
| Immigrants | Nigeria | 70.4 /100 | #164 | Good 6.5% |
| Immigrants | Hungary | 69.6 /100 | #165 | Good 6.5% |
| Eastern Europeans | 65.1 /100 | #166 | Good 6.5% |
| Immigrants | Northern Europe | 64.1 /100 | #167 | Good 6.5% |
| Immigrants | Moldova | 63.1 /100 | #168 | Good 6.5% |
| Russians | 60.2 /100 | #169 | Good 6.5% |
| Immigrants | Bahamas | 57.9 /100 | #170 | Average 6.6% |
| Bahamians | 55.5 /100 | #171 | Average 6.6% |
| Ghanaians | 54.7 /100 | #172 | Average 6.6% |
| Immigrants | Mexico | 54.1 /100 | #173 | Average 6.6% |
| Native Hawaiians | 50.0 /100 | #174 | Average 6.6% |
| Immigrants | Cambodia | 46.5 /100 | #175 | Average 6.6% |
| Immigrants | Africa | 45.9 /100 | #176 | Average 6.6% |
| Syrians | 44.3 /100 | #177 | Average 6.6% |
| Nigerians | 43.7 /100 | #178 | Average 6.6% |
Demographics Similar to Paraguayans by Disability Age 18 to 34
In terms of disability age 18 to 34, the demographic groups most similar to Paraguayans are Immigrants from Haiti (5.9%, a difference of 0.11%), Immigrants from Serbia (5.9%, a difference of 0.13%), Immigrants from Spain (5.9%, a difference of 0.16%), Immigrants from Malaysia (5.9%, a difference of 0.17%), and Immigrants from Indonesia (5.9%, a difference of 0.22%).
| Demographics | Rating | Rank | Disability Age 18 to 34 |
| Immigrants | Belarus | 99.8 /100 | #49 | Exceptional 5.9% |
| Immigrants | El Salvador | 99.8 /100 | #50 | Exceptional 5.9% |
| Egyptians | 99.8 /100 | #51 | Exceptional 5.9% |
| Okinawans | 99.7 /100 | #52 | Exceptional 5.9% |
| Immigrants | Indonesia | 99.7 /100 | #53 | Exceptional 5.9% |
| Immigrants | Malaysia | 99.7 /100 | #54 | Exceptional 5.9% |
| Immigrants | Spain | 99.7 /100 | #55 | Exceptional 5.9% |
| Paraguayans | 99.7 /100 | #56 | Exceptional 5.9% |
| Immigrants | Haiti | 99.7 /100 | #57 | Exceptional 5.9% |
| Immigrants | Serbia | 99.7 /100 | #58 | Exceptional 5.9% |
| Immigrants | Caribbean | 99.6 /100 | #59 | Exceptional 6.0% |
| Immigrants | Sri Lanka | 99.6 /100 | #60 | Exceptional 6.0% |
| British West Indians | 99.6 /100 | #61 | Exceptional 6.0% |
| Peruvians | 99.6 /100 | #62 | Exceptional 6.0% |
| Salvadorans | 99.6 /100 | #63 | Exceptional 6.0% |