Austrian vs Welsh Vision Disability
COMPARE
Austrian
Welsh
Vision Disability
Vision Disability Comparison
Austrians
Welsh
2.1%
VISION DISABILITY
69.0/ 100
METRIC RATING
160th/ 347
METRIC RANK
2.3%
VISION DISABILITY
2.3/ 100
METRIC RATING
229th/ 347
METRIC RANK
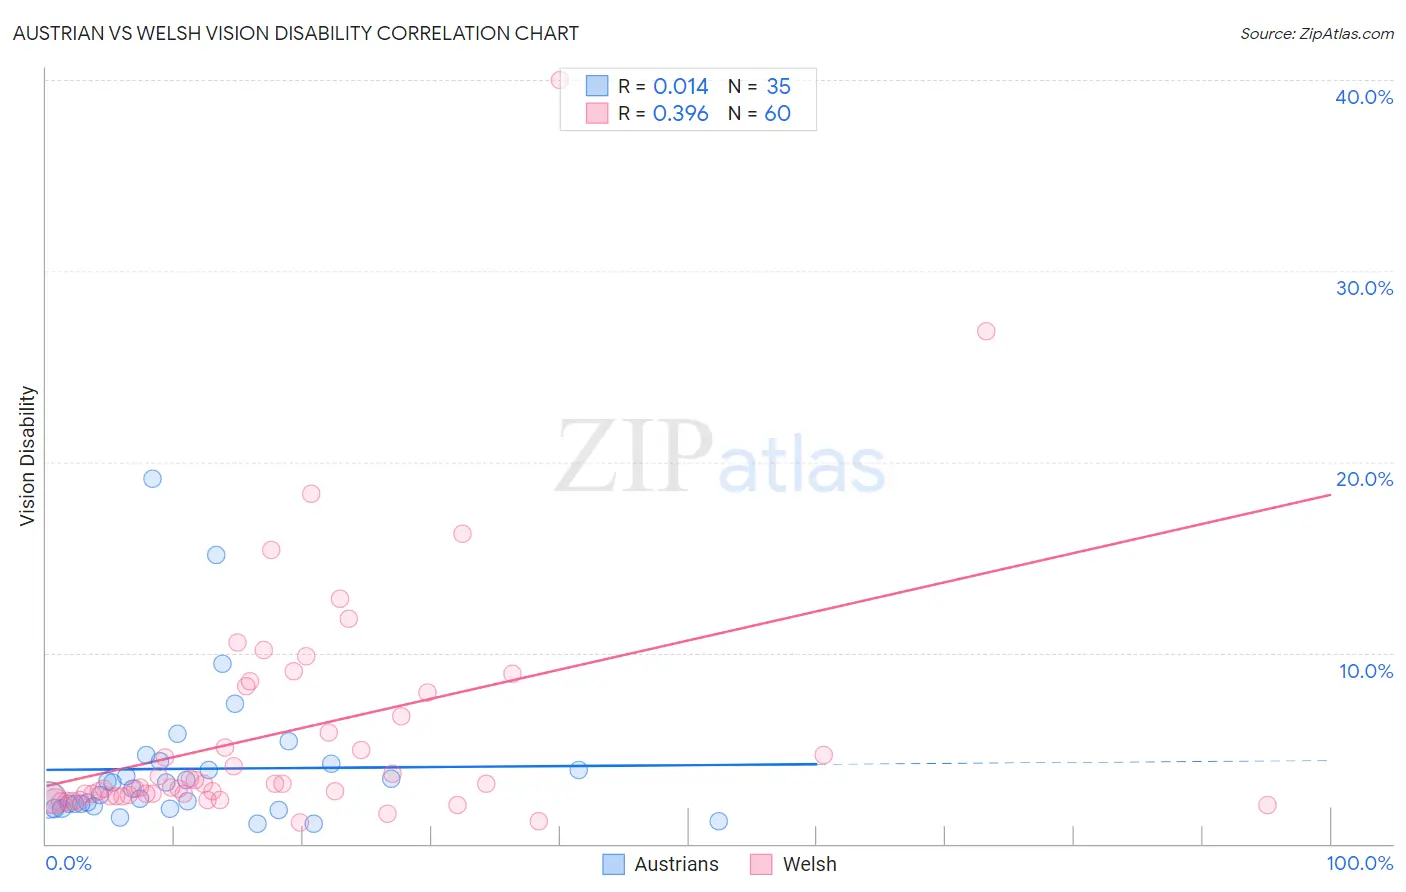
Austrian vs Welsh Vision Disability Correlation Chart
The statistical analysis conducted on geographies consisting of 451,572,198 people shows no correlation between the proportion of Austrians and percentage of population with vision disability in the United States with a correlation coefficient (R) of 0.014 and weighted average of 2.1%. Similarly, the statistical analysis conducted on geographies consisting of 527,426,081 people shows a mild positive correlation between the proportion of Welsh and percentage of population with vision disability in the United States with a correlation coefficient (R) of 0.396 and weighted average of 2.3%, a difference of 7.2%.
Vision Disability Correlation Summary
| Measurement | Austrian | Welsh |
| Minimum | 1.0% | 1.1% |
| Maximum | 19.1% | 40.0% |
| Range | 18.1% | 38.9% |
| Mean | 3.9% | 5.8% |
| Median | 2.9% | 3.0% |
| Interquartile 25% (IQ1) | 2.0% | 2.5% |
| Interquartile 75% (IQ3) | 4.2% | 7.3% |
| Interquartile Range (IQR) | 2.2% | 4.8% |
| Standard Deviation (Sample) | 3.8% | 6.6% |
| Standard Deviation (Population) | 3.7% | 6.5% |
Similar Demographics by Vision Disability
Demographics Similar to Austrians by Vision Disability
In terms of vision disability, the demographic groups most similar to Austrians are South African (2.1%, a difference of 0.060%), Immigrants from Uzbekistan (2.1%, a difference of 0.070%), Serbian (2.1%, a difference of 0.090%), Iraqi (2.1%, a difference of 0.090%), and Hungarian (2.1%, a difference of 0.12%).
| Demographics | Rating | Rank | Vision Disability |
| Immigrants | South America | 73.8 /100 | #153 | Good 2.1% |
| Slovenes | 73.6 /100 | #154 | Good 2.1% |
| Immigrants | Colombia | 72.1 /100 | #155 | Good 2.1% |
| Pakistanis | 71.6 /100 | #156 | Good 2.1% |
| Serbians | 70.2 /100 | #157 | Good 2.1% |
| Immigrants | Uzbekistan | 69.9 /100 | #158 | Good 2.1% |
| South Africans | 69.8 /100 | #159 | Good 2.1% |
| Austrians | 69.0 /100 | #160 | Good 2.1% |
| Iraqis | 67.7 /100 | #161 | Good 2.1% |
| Hungarians | 67.4 /100 | #162 | Good 2.1% |
| Icelanders | 66.1 /100 | #163 | Good 2.1% |
| Immigrants | Bangladesh | 65.5 /100 | #164 | Good 2.1% |
| Immigrants | Iraq | 64.8 /100 | #165 | Good 2.1% |
| Immigrants | England | 62.8 /100 | #166 | Good 2.1% |
| Immigrants | Africa | 62.6 /100 | #167 | Good 2.1% |
Demographics Similar to Welsh by Vision Disability
In terms of vision disability, the demographic groups most similar to Welsh are Nicaraguan (2.3%, a difference of 0.070%), Hmong (2.3%, a difference of 0.080%), Immigrants from Ecuador (2.3%, a difference of 0.23%), Hawaiian (2.3%, a difference of 0.32%), and Immigrants from Germany (2.3%, a difference of 0.37%).
| Demographics | Rating | Rank | Vision Disability |
| Immigrants | Senegal | 3.8 /100 | #222 | Tragic 2.3% |
| Basques | 3.5 /100 | #223 | Tragic 2.3% |
| Irish | 3.4 /100 | #224 | Tragic 2.3% |
| Immigrants | Western Africa | 3.4 /100 | #225 | Tragic 2.3% |
| Immigrants | Germany | 3.0 /100 | #226 | Tragic 2.3% |
| Hawaiians | 2.9 /100 | #227 | Tragic 2.3% |
| Hmong | 2.5 /100 | #228 | Tragic 2.3% |
| Welsh | 2.3 /100 | #229 | Tragic 2.3% |
| Nicaraguans | 2.2 /100 | #230 | Tragic 2.3% |
| Immigrants | Ecuador | 2.0 /100 | #231 | Tragic 2.3% |
| German Russians | 1.8 /100 | #232 | Tragic 2.3% |
| Central Americans | 1.8 /100 | #233 | Tragic 2.3% |
| Scottish | 1.6 /100 | #234 | Tragic 2.3% |
| Marshallese | 1.5 /100 | #235 | Tragic 2.3% |
| Immigrants | Congo | 1.4 /100 | #236 | Tragic 2.3% |