Asian vs Senegalese Hearing Disability
COMPARE
Asian
Senegalese
Hearing Disability
Hearing Disability Comparison
Asians
Senegalese
2.7%
HEARING DISABILITY
97.5/ 100
METRIC RATING
76th/ 347
METRIC RANK
2.6%
HEARING DISABILITY
99.4/ 100
METRIC RATING
43rd/ 347
METRIC RANK
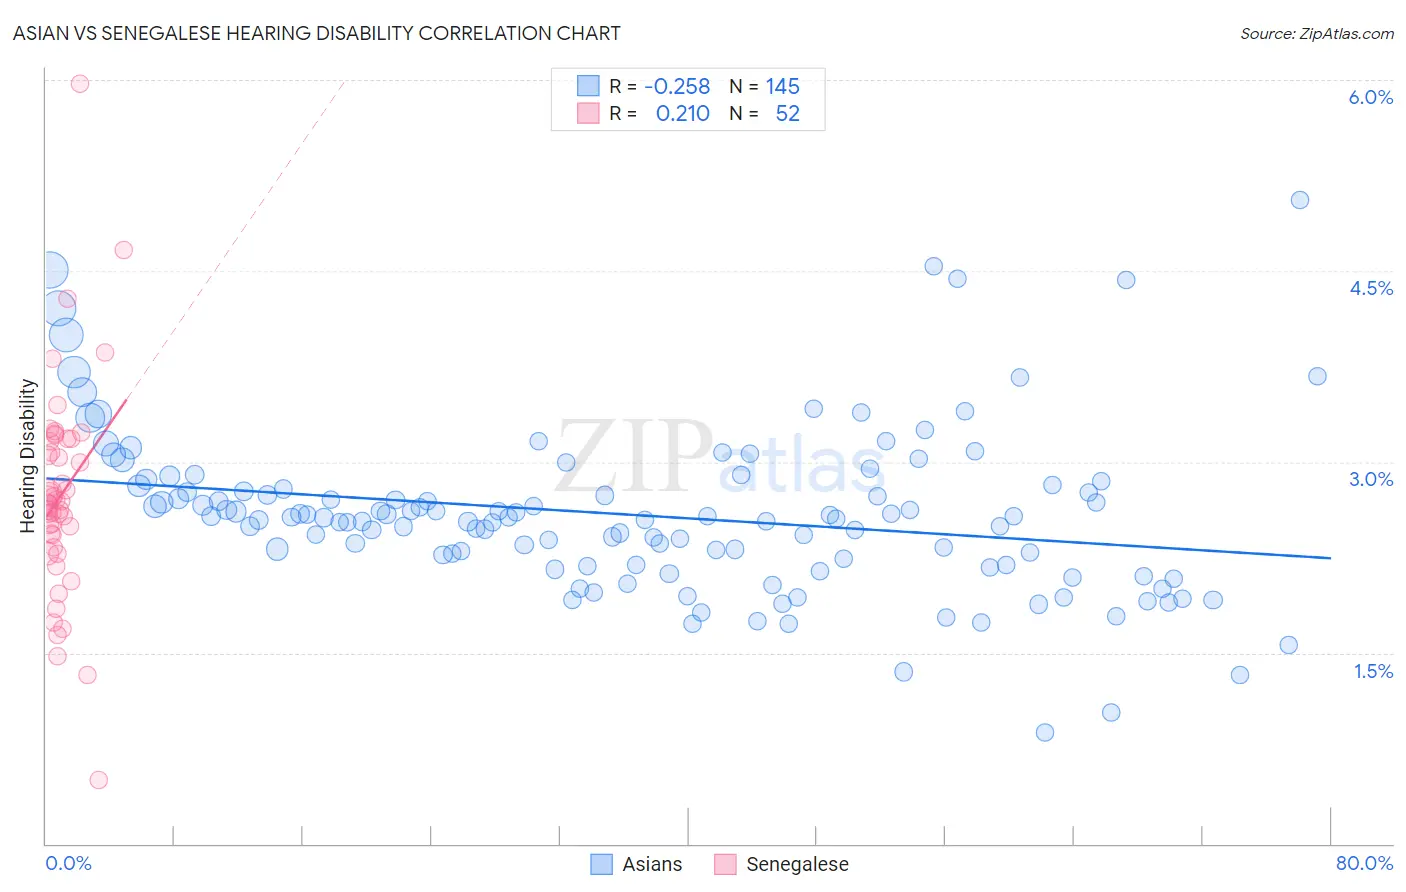
Asian vs Senegalese Hearing Disability Correlation Chart
The statistical analysis conducted on geographies consisting of 550,340,322 people shows a weak negative correlation between the proportion of Asians and percentage of population with hearing disability in the United States with a correlation coefficient (R) of -0.258 and weighted average of 2.7%. Similarly, the statistical analysis conducted on geographies consisting of 78,133,059 people shows a weak positive correlation between the proportion of Senegalese and percentage of population with hearing disability in the United States with a correlation coefficient (R) of 0.210 and weighted average of 2.6%, a difference of 3.9%.
Hearing Disability Correlation Summary
| Measurement | Asian | Senegalese |
| Minimum | 0.87% | 0.50% |
| Maximum | 5.1% | 6.0% |
| Range | 4.2% | 5.5% |
| Mean | 2.6% | 2.7% |
| Median | 2.6% | 2.7% |
| Interquartile 25% (IQ1) | 2.2% | 2.4% |
| Interquartile 75% (IQ3) | 2.8% | 3.2% |
| Interquartile Range (IQR) | 0.60% | 0.80% |
| Standard Deviation (Sample) | 0.65% | 0.85% |
| Standard Deviation (Population) | 0.65% | 0.84% |
Similar Demographics by Hearing Disability
Demographics Similar to Asians by Hearing Disability
In terms of hearing disability, the demographic groups most similar to Asians are Immigrants from Saudi Arabia (2.7%, a difference of 0.0%), Immigrants from Malaysia (2.7%, a difference of 0.020%), Argentinean (2.7%, a difference of 0.030%), Immigrants from Korea (2.7%, a difference of 0.030%), and Mongolian (2.7%, a difference of 0.070%).
| Demographics | Rating | Rank | Hearing Disability |
| Nicaraguans | 97.9 /100 | #69 | Exceptional 2.7% |
| Peruvians | 97.7 /100 | #70 | Exceptional 2.7% |
| Central Americans | 97.7 /100 | #71 | Exceptional 2.7% |
| Afghans | 97.6 /100 | #72 | Exceptional 2.7% |
| Argentineans | 97.5 /100 | #73 | Exceptional 2.7% |
| Immigrants | Korea | 97.5 /100 | #74 | Exceptional 2.7% |
| Immigrants | Saudi Arabia | 97.5 /100 | #75 | Exceptional 2.7% |
| Asians | 97.5 /100 | #76 | Exceptional 2.7% |
| Immigrants | Malaysia | 97.5 /100 | #77 | Exceptional 2.7% |
| Mongolians | 97.4 /100 | #78 | Exceptional 2.7% |
| Colombians | 97.4 /100 | #79 | Exceptional 2.7% |
| Immigrants | Asia | 97.2 /100 | #80 | Exceptional 2.7% |
| Immigrants | Uruguay | 97.2 /100 | #81 | Exceptional 2.7% |
| Immigrants | Armenia | 97.2 /100 | #82 | Exceptional 2.7% |
| Immigrants | Cuba | 97.2 /100 | #83 | Exceptional 2.7% |
Demographics Similar to Senegalese by Hearing Disability
In terms of hearing disability, the demographic groups most similar to Senegalese are Immigrants from Taiwan (2.6%, a difference of 0.010%), West Indian (2.6%, a difference of 0.010%), Nigerian (2.6%, a difference of 0.22%), Venezuelan (2.6%, a difference of 0.25%), and Haitian (2.6%, a difference of 0.35%).
| Demographics | Rating | Rank | Hearing Disability |
| Okinawans | 99.6 /100 | #36 | Exceptional 2.6% |
| Immigrants | Western Africa | 99.6 /100 | #37 | Exceptional 2.6% |
| Immigrants | Jamaica | 99.5 /100 | #38 | Exceptional 2.6% |
| Immigrants | China | 99.5 /100 | #39 | Exceptional 2.6% |
| Haitians | 99.5 /100 | #40 | Exceptional 2.6% |
| Immigrants | Taiwan | 99.4 /100 | #41 | Exceptional 2.6% |
| West Indians | 99.4 /100 | #42 | Exceptional 2.6% |
| Senegalese | 99.4 /100 | #43 | Exceptional 2.6% |
| Nigerians | 99.4 /100 | #44 | Exceptional 2.6% |
| Venezuelans | 99.4 /100 | #45 | Exceptional 2.6% |
| Immigrants | Dominica | 99.3 /100 | #46 | Exceptional 2.6% |
| Immigrants | Israel | 99.3 /100 | #47 | Exceptional 2.6% |
| Immigrants | Singapore | 99.3 /100 | #48 | Exceptional 2.6% |
| Immigrants | South America | 99.2 /100 | #49 | Exceptional 2.7% |
| Paraguayans | 99.2 /100 | #50 | Exceptional 2.7% |