Armenian vs Immigrants from Barbados Disability Age 18 to 34
COMPARE
Armenian
Immigrants from Barbados
Disability Age 18 to 34
Disability Age 18 to 34 Comparison
Armenians
Immigrants from Barbados
5.8%
DISABILITY AGE 18 TO 34
99.9/ 100
METRIC RATING
37th/ 347
METRIC RANK
5.8%
DISABILITY AGE 18 TO 34
99.9/ 100
METRIC RATING
32nd/ 347
METRIC RANK
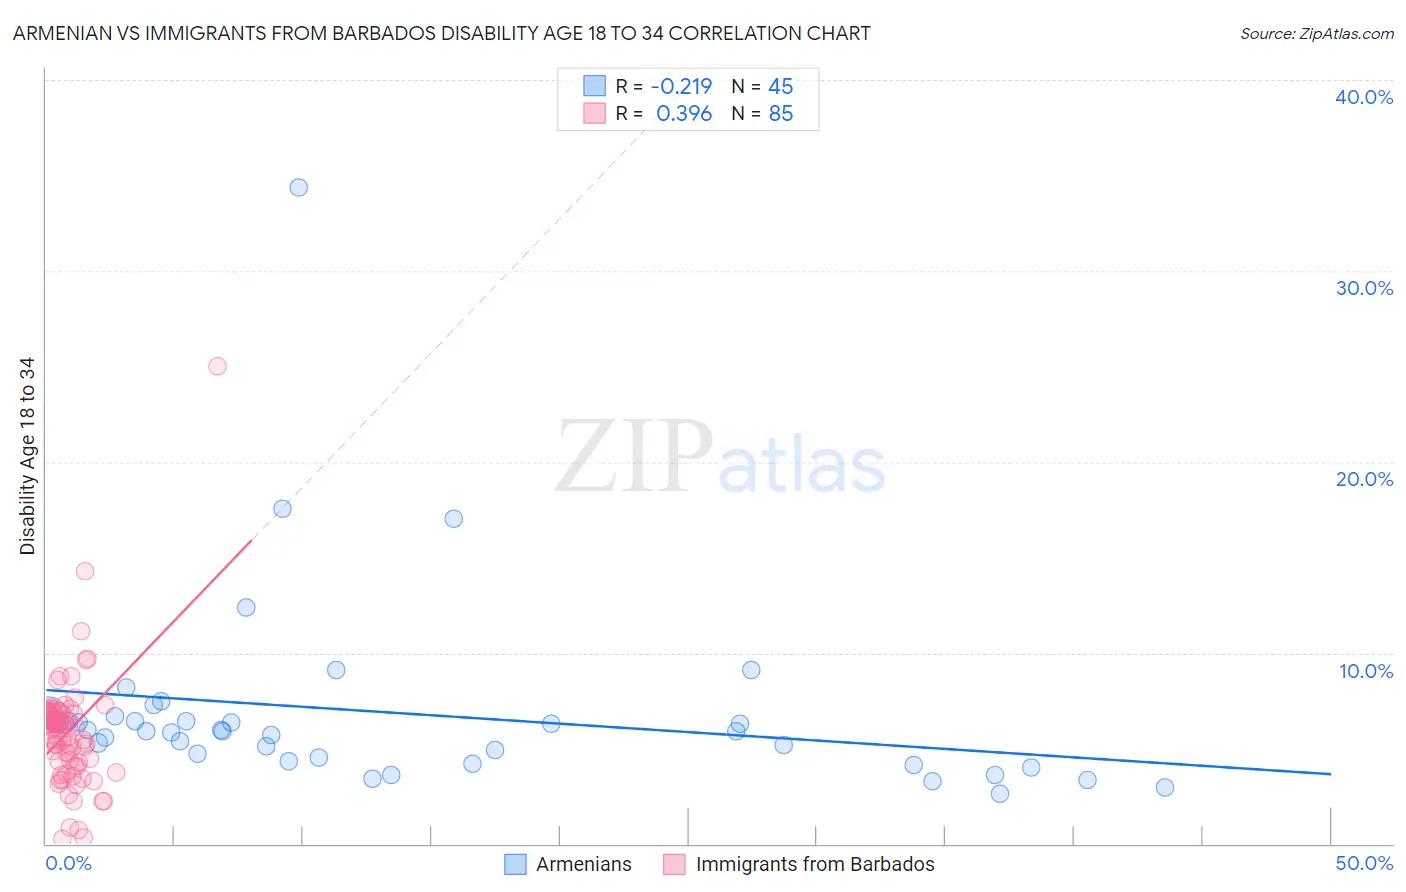
Armenian vs Immigrants from Barbados Disability Age 18 to 34 Correlation Chart
The statistical analysis conducted on geographies consisting of 310,326,580 people shows a weak negative correlation between the proportion of Armenians and percentage of population with a disability between the ages 18 and 35 in the United States with a correlation coefficient (R) of -0.219 and weighted average of 5.8%. Similarly, the statistical analysis conducted on geographies consisting of 112,733,173 people shows a mild positive correlation between the proportion of Immigrants from Barbados and percentage of population with a disability between the ages 18 and 35 in the United States with a correlation coefficient (R) of 0.396 and weighted average of 5.8%, a difference of 0.68%.
Disability Age 18 to 34 Correlation Summary
| Measurement | Armenian | Immigrants from Barbados |
| Minimum | 2.6% | 0.26% |
| Maximum | 34.4% | 25.0% |
| Range | 31.8% | 24.7% |
| Mean | 6.8% | 5.9% |
| Median | 5.9% | 6.1% |
| Interquartile 25% (IQ1) | 4.4% | 4.3% |
| Interquartile 75% (IQ3) | 6.6% | 6.9% |
| Interquartile Range (IQR) | 2.1% | 2.6% |
| Standard Deviation (Sample) | 5.2% | 3.1% |
| Standard Deviation (Population) | 5.1% | 3.1% |
Demographics Similar to Armenians and Immigrants from Barbados by Disability Age 18 to 34
In terms of disability age 18 to 34, the demographic groups most similar to Armenians are Immigrants from South America (5.8%, a difference of 0.020%), Ecuadorian (5.8%, a difference of 0.090%), Immigrants from Lithuania (5.8%, a difference of 0.24%), Asian (5.8%, a difference of 0.33%), and Bolivian (5.8%, a difference of 0.41%). Similarly, the demographic groups most similar to Immigrants from Barbados are Iranian (5.8%, a difference of 0.0%), Argentinean (5.8%, a difference of 0.020%), Venezuelan (5.8%, a difference of 0.21%), Immigrants from Pakistan (5.8%, a difference of 0.32%), and Immigrants from Lithuania (5.8%, a difference of 0.43%).
| Demographics | Rating | Rank | Disability Age 18 to 34 |
| Immigrants | Argentina | 100.0 /100 | #24 | Exceptional 5.7% |
| Immigrants | Singapore | 100.0 /100 | #25 | Exceptional 5.7% |
| Immigrants | Colombia | 100.0 /100 | #26 | Exceptional 5.7% |
| Immigrants | Venezuela | 99.9 /100 | #27 | Exceptional 5.7% |
| Soviet Union | 99.9 /100 | #28 | Exceptional 5.7% |
| Immigrants | Ecuador | 99.9 /100 | #29 | Exceptional 5.7% |
| Immigrants | Pakistan | 99.9 /100 | #30 | Exceptional 5.8% |
| Iranians | 99.9 /100 | #31 | Exceptional 5.8% |
| Immigrants | Barbados | 99.9 /100 | #32 | Exceptional 5.8% |
| Argentineans | 99.9 /100 | #33 | Exceptional 5.8% |
| Venezuelans | 99.9 /100 | #34 | Exceptional 5.8% |
| Immigrants | Lithuania | 99.9 /100 | #35 | Exceptional 5.8% |
| Ecuadorians | 99.9 /100 | #36 | Exceptional 5.8% |
| Armenians | 99.9 /100 | #37 | Exceptional 5.8% |
| Immigrants | South America | 99.9 /100 | #38 | Exceptional 5.8% |
| Asians | 99.9 /100 | #39 | Exceptional 5.8% |
| Bolivians | 99.9 /100 | #40 | Exceptional 5.8% |
| Nicaraguans | 99.9 /100 | #41 | Exceptional 5.8% |
| Colombians | 99.8 /100 | #42 | Exceptional 5.9% |
| South Americans | 99.8 /100 | #43 | Exceptional 5.9% |
| Immigrants | Asia | 99.8 /100 | #44 | Exceptional 5.9% |