Argentinean vs Immigrants from the Azores Disability Age Over 75
COMPARE
Argentinean
Immigrants from the Azores
Disability Age Over 75
Disability Age Over 75 Comparison
Argentineans
Immigrants from the Azores
46.2%
DISABILITY AGE OVER 75
98.7/ 100
METRIC RATING
83rd/ 347
METRIC RANK
50.9%
DISABILITY AGE OVER 75
0.0/ 100
METRIC RATING
313th/ 347
METRIC RANK
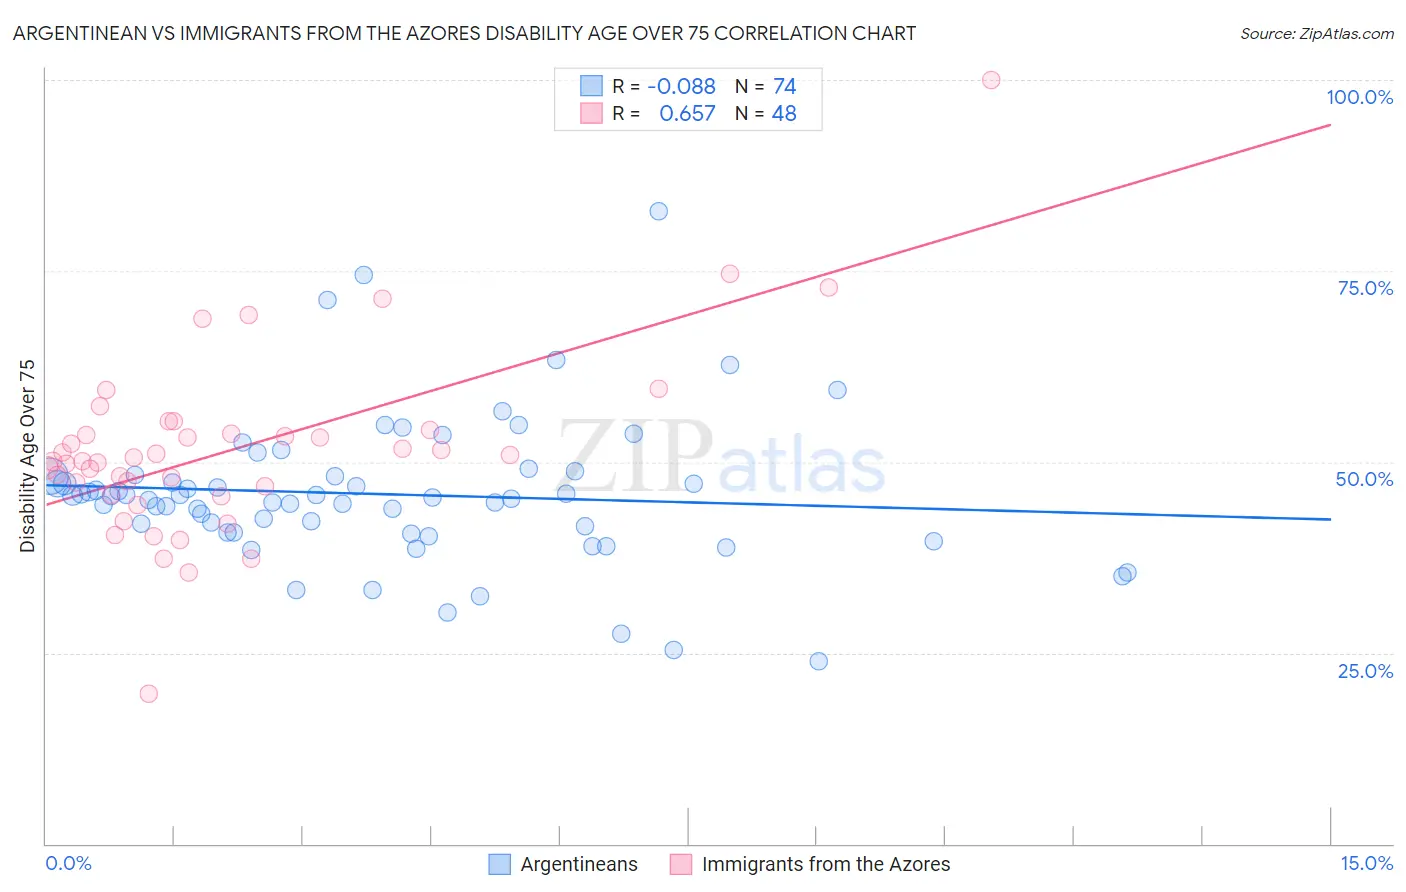
Argentinean vs Immigrants from the Azores Disability Age Over 75 Correlation Chart
The statistical analysis conducted on geographies consisting of 296,846,003 people shows a slight negative correlation between the proportion of Argentineans and percentage of population with a disability over the age of 75 in the United States with a correlation coefficient (R) of -0.088 and weighted average of 46.2%. Similarly, the statistical analysis conducted on geographies consisting of 46,256,108 people shows a significant positive correlation between the proportion of Immigrants from the Azores and percentage of population with a disability over the age of 75 in the United States with a correlation coefficient (R) of 0.657 and weighted average of 50.9%, a difference of 10.2%.
Disability Age Over 75 Correlation Summary
| Measurement | Argentinean | Immigrants from the Azores |
| Minimum | 23.9% | 19.7% |
| Maximum | 82.8% | 100.0% |
| Range | 58.9% | 80.3% |
| Mean | 45.8% | 51.6% |
| Median | 45.4% | 50.4% |
| Interquartile 25% (IQ1) | 40.8% | 46.3% |
| Interquartile 75% (IQ3) | 48.1% | 53.9% |
| Interquartile Range (IQR) | 7.3% | 7.6% |
| Standard Deviation (Sample) | 9.7% | 12.2% |
| Standard Deviation (Population) | 9.7% | 12.1% |
Similar Demographics by Disability Age Over 75
Demographics Similar to Argentineans by Disability Age Over 75
In terms of disability age over 75, the demographic groups most similar to Argentineans are Immigrants from Latvia (46.2%, a difference of 0.0%), Immigrants from Jordan (46.2%, a difference of 0.010%), Soviet Union (46.2%, a difference of 0.020%), New Zealander (46.2%, a difference of 0.020%), and Swiss (46.2%, a difference of 0.030%).
| Demographics | Rating | Rank | Disability Age Over 75 |
| Slavs | 98.9 /100 | #76 | Exceptional 46.1% |
| Immigrants | Eastern Asia | 98.9 /100 | #77 | Exceptional 46.2% |
| Immigrants | Western Europe | 98.8 /100 | #78 | Exceptional 46.2% |
| Swiss | 98.8 /100 | #79 | Exceptional 46.2% |
| Soviet Union | 98.8 /100 | #80 | Exceptional 46.2% |
| New Zealanders | 98.8 /100 | #81 | Exceptional 46.2% |
| Immigrants | Latvia | 98.7 /100 | #82 | Exceptional 46.2% |
| Argentineans | 98.7 /100 | #83 | Exceptional 46.2% |
| Immigrants | Jordan | 98.7 /100 | #84 | Exceptional 46.2% |
| Immigrants | Southern Europe | 98.6 /100 | #85 | Exceptional 46.2% |
| Romanians | 98.6 /100 | #86 | Exceptional 46.2% |
| Danes | 98.6 /100 | #87 | Exceptional 46.2% |
| Uruguayans | 98.4 /100 | #88 | Exceptional 46.2% |
| Immigrants | Saudi Arabia | 98.4 /100 | #89 | Exceptional 46.3% |
| Northern Europeans | 98.3 /100 | #90 | Exceptional 46.3% |
Demographics Similar to Immigrants from the Azores by Disability Age Over 75
In terms of disability age over 75, the demographic groups most similar to Immigrants from the Azores are Cheyenne (50.9%, a difference of 0.050%), Immigrants from Mexico (51.1%, a difference of 0.37%), Mexican (51.1%, a difference of 0.42%), Cajun (50.7%, a difference of 0.50%), and Chickasaw (51.2%, a difference of 0.56%).
| Demographics | Rating | Rank | Disability Age Over 75 |
| Immigrants | Central America | 0.0 /100 | #306 | Tragic 50.5% |
| Immigrants | Fiji | 0.0 /100 | #307 | Tragic 50.6% |
| Hispanics or Latinos | 0.0 /100 | #308 | Tragic 50.6% |
| Aleuts | 0.0 /100 | #309 | Tragic 50.6% |
| Tlingit-Haida | 0.0 /100 | #310 | Tragic 50.6% |
| Cajuns | 0.0 /100 | #311 | Tragic 50.7% |
| Cheyenne | 0.0 /100 | #312 | Tragic 50.9% |
| Immigrants | Azores | 0.0 /100 | #313 | Tragic 50.9% |
| Immigrants | Mexico | 0.0 /100 | #314 | Tragic 51.1% |
| Mexicans | 0.0 /100 | #315 | Tragic 51.1% |
| Chickasaw | 0.0 /100 | #316 | Tragic 51.2% |
| Yakama | 0.0 /100 | #317 | Tragic 51.3% |
| Seminole | 0.0 /100 | #318 | Tragic 51.5% |
| Creek | 0.0 /100 | #319 | Tragic 51.5% |
| Paiute | 0.0 /100 | #320 | Tragic 51.5% |