Argentinean vs Cuban Disability Age 18 to 34
COMPARE
Argentinean
Cuban
Disability Age 18 to 34
Disability Age 18 to 34 Comparison
Argentineans
Cubans
5.8%
DISABILITY AGE 18 TO 34
99.9/ 100
METRIC RATING
33rd/ 347
METRIC RANK
5.7%
DISABILITY AGE 18 TO 34
100.0/ 100
METRIC RATING
23rd/ 347
METRIC RANK
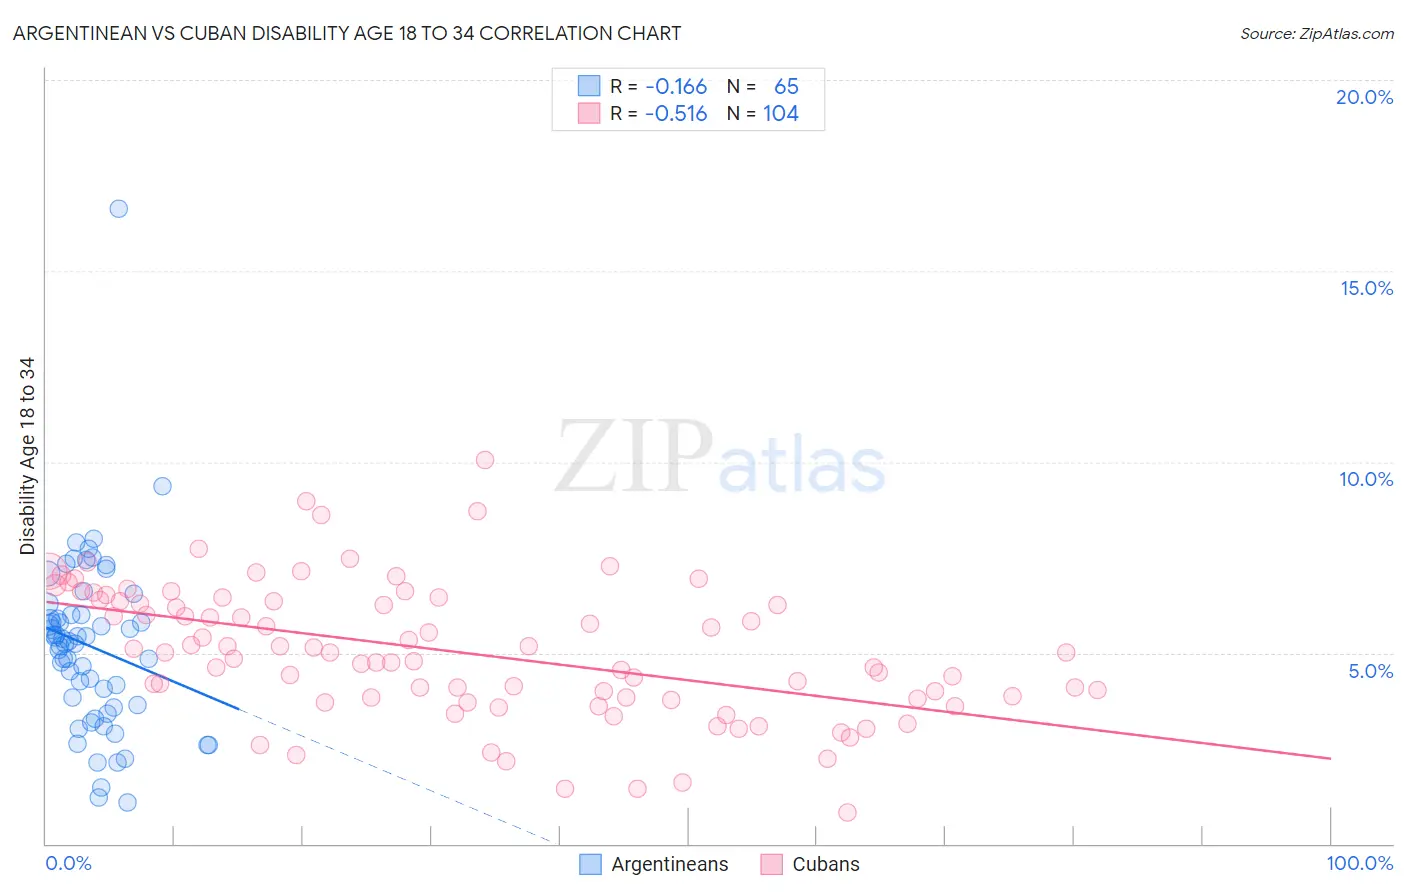
Argentinean vs Cuban Disability Age 18 to 34 Correlation Chart
The statistical analysis conducted on geographies consisting of 296,774,562 people shows a poor negative correlation between the proportion of Argentineans and percentage of population with a disability between the ages 18 and 35 in the United States with a correlation coefficient (R) of -0.166 and weighted average of 5.8%. Similarly, the statistical analysis conducted on geographies consisting of 448,003,598 people shows a substantial negative correlation between the proportion of Cubans and percentage of population with a disability between the ages 18 and 35 in the United States with a correlation coefficient (R) of -0.516 and weighted average of 5.7%, a difference of 1.1%.
Disability Age 18 to 34 Correlation Summary
| Measurement | Argentinean | Cuban |
| Minimum | 1.1% | 0.83% |
| Maximum | 16.6% | 10.1% |
| Range | 15.6% | 9.2% |
| Mean | 5.2% | 5.0% |
| Median | 5.3% | 5.0% |
| Interquartile 25% (IQ1) | 3.6% | 3.8% |
| Interquartile 75% (IQ3) | 6.0% | 6.4% |
| Interquartile Range (IQR) | 2.4% | 2.6% |
| Standard Deviation (Sample) | 2.3% | 1.8% |
| Standard Deviation (Population) | 2.3% | 1.8% |
Demographics Similar to Argentineans and Cubans by Disability Age 18 to 34
In terms of disability age 18 to 34, the demographic groups most similar to Argentineans are Iranian (5.8%, a difference of 0.020%), Immigrants from Barbados (5.8%, a difference of 0.020%), Venezuelan (5.8%, a difference of 0.19%), Immigrants from Pakistan (5.8%, a difference of 0.35%), and Immigrants from Lithuania (5.8%, a difference of 0.41%). Similarly, the demographic groups most similar to Cubans are Immigrants from Argentina (5.7%, a difference of 0.10%), Immigrants from Singapore (5.7%, a difference of 0.14%), Immigrants from Colombia (5.7%, a difference of 0.29%), Immigrants from Venezuela (5.7%, a difference of 0.40%), and Soviet Union (5.7%, a difference of 0.49%).
| Demographics | Rating | Rank | Disability Age 18 to 34 |
| Immigrants | Bolivia | 100.0 /100 | #18 | Exceptional 5.6% |
| Thais | 100.0 /100 | #19 | Exceptional 5.6% |
| Immigrants | Bangladesh | 100.0 /100 | #20 | Exceptional 5.6% |
| Immigrants | South Central Asia | 100.0 /100 | #21 | Exceptional 5.7% |
| Immigrants | Nicaragua | 100.0 /100 | #22 | Exceptional 5.7% |
| Cubans | 100.0 /100 | #23 | Exceptional 5.7% |
| Immigrants | Argentina | 100.0 /100 | #24 | Exceptional 5.7% |
| Immigrants | Singapore | 100.0 /100 | #25 | Exceptional 5.7% |
| Immigrants | Colombia | 100.0 /100 | #26 | Exceptional 5.7% |
| Immigrants | Venezuela | 99.9 /100 | #27 | Exceptional 5.7% |
| Soviet Union | 99.9 /100 | #28 | Exceptional 5.7% |
| Immigrants | Ecuador | 99.9 /100 | #29 | Exceptional 5.7% |
| Immigrants | Pakistan | 99.9 /100 | #30 | Exceptional 5.8% |
| Iranians | 99.9 /100 | #31 | Exceptional 5.8% |
| Immigrants | Barbados | 99.9 /100 | #32 | Exceptional 5.8% |
| Argentineans | 99.9 /100 | #33 | Exceptional 5.8% |
| Venezuelans | 99.9 /100 | #34 | Exceptional 5.8% |
| Immigrants | Lithuania | 99.9 /100 | #35 | Exceptional 5.8% |
| Ecuadorians | 99.9 /100 | #36 | Exceptional 5.8% |
| Armenians | 99.9 /100 | #37 | Exceptional 5.8% |
| Immigrants | South America | 99.9 /100 | #38 | Exceptional 5.8% |