Arapaho vs Immigrants from Malaysia Vision Disability
COMPARE
Arapaho
Immigrants from Malaysia
Vision Disability
Vision Disability Comparison
Arapaho
Immigrants from Malaysia
2.6%
VISION DISABILITY
0.0/ 100
METRIC RATING
308th/ 347
METRIC RANK
1.9%
VISION DISABILITY
99.9/ 100
METRIC RATING
28th/ 347
METRIC RANK
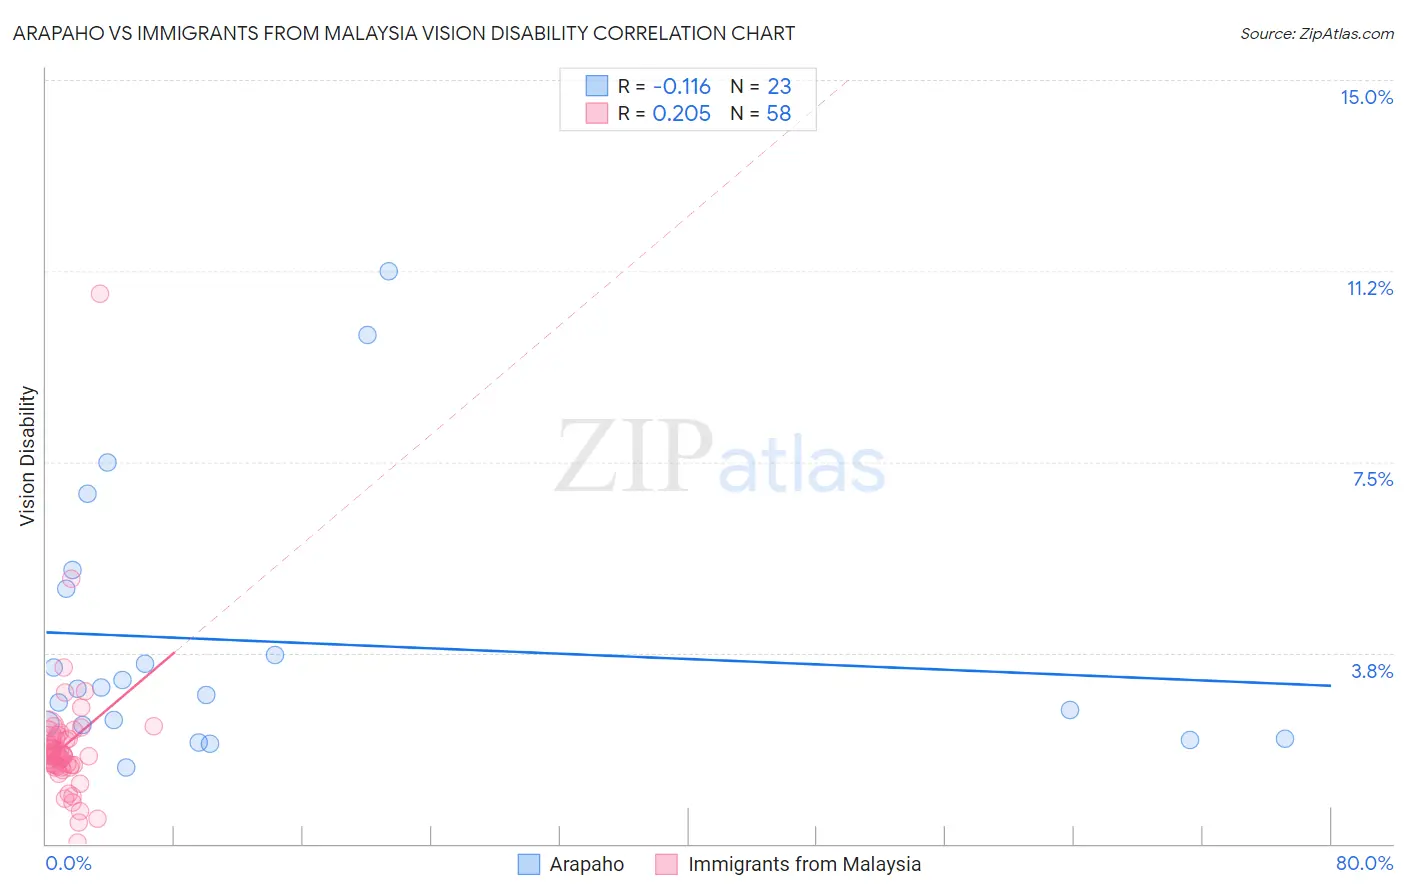
Arapaho vs Immigrants from Malaysia Vision Disability Correlation Chart
The statistical analysis conducted on geographies consisting of 29,770,133 people shows a poor negative correlation between the proportion of Arapaho and percentage of population with vision disability in the United States with a correlation coefficient (R) of -0.116 and weighted average of 2.6%. Similarly, the statistical analysis conducted on geographies consisting of 197,931,356 people shows a weak positive correlation between the proportion of Immigrants from Malaysia and percentage of population with vision disability in the United States with a correlation coefficient (R) of 0.205 and weighted average of 1.9%, a difference of 35.3%.
Vision Disability Correlation Summary
| Measurement | Arapaho | Immigrants from Malaysia |
| Minimum | 1.5% | 0.037% |
| Maximum | 11.2% | 10.8% |
| Range | 9.7% | 10.8% |
| Mean | 4.0% | 1.9% |
| Median | 3.1% | 1.7% |
| Interquartile 25% (IQ1) | 2.3% | 1.5% |
| Interquartile 75% (IQ3) | 5.0% | 2.1% |
| Interquartile Range (IQR) | 2.7% | 0.58% |
| Standard Deviation (Sample) | 2.6% | 1.4% |
| Standard Deviation (Population) | 2.5% | 1.4% |
Similar Demographics by Vision Disability
Demographics Similar to Arapaho by Vision Disability
In terms of vision disability, the demographic groups most similar to Arapaho are Immigrants from Dominican Republic (2.6%, a difference of 0.020%), Iroquois (2.6%, a difference of 0.040%), Immigrants from Yemen (2.6%, a difference of 0.29%), Blackfeet (2.6%, a difference of 0.61%), and Hispanic or Latino (2.6%, a difference of 0.65%).
| Demographics | Rating | Rank | Vision Disability |
| Menominee | 0.0 /100 | #301 | Tragic 2.5% |
| Spanish American Indians | 0.0 /100 | #302 | Tragic 2.6% |
| Immigrants | Cabo Verde | 0.0 /100 | #303 | Tragic 2.6% |
| Aleuts | 0.0 /100 | #304 | Tragic 2.6% |
| Hispanics or Latinos | 0.0 /100 | #305 | Tragic 2.6% |
| Iroquois | 0.0 /100 | #306 | Tragic 2.6% |
| Immigrants | Dominican Republic | 0.0 /100 | #307 | Tragic 2.6% |
| Arapaho | 0.0 /100 | #308 | Tragic 2.6% |
| Immigrants | Yemen | 0.0 /100 | #309 | Tragic 2.6% |
| Blackfeet | 0.0 /100 | #310 | Tragic 2.6% |
| Dominicans | 0.0 /100 | #311 | Tragic 2.6% |
| Americans | 0.0 /100 | #312 | Tragic 2.6% |
| Potawatomi | 0.0 /100 | #313 | Tragic 2.6% |
| Inupiat | 0.0 /100 | #314 | Tragic 2.7% |
| Osage | 0.0 /100 | #315 | Tragic 2.7% |
Demographics Similar to Immigrants from Malaysia by Vision Disability
In terms of vision disability, the demographic groups most similar to Immigrants from Malaysia are Taiwanese (1.9%, a difference of 0.020%), Egyptian (1.9%, a difference of 0.070%), Immigrants from Nepal (1.9%, a difference of 0.11%), Mongolian (1.9%, a difference of 0.27%), and Immigrants from Japan (1.9%, a difference of 0.36%).
| Demographics | Rating | Rank | Vision Disability |
| Turks | 100.0 /100 | #21 | Exceptional 1.9% |
| Immigrants | Pakistan | 100.0 /100 | #22 | Exceptional 1.9% |
| Immigrants | Asia | 99.9 /100 | #23 | Exceptional 1.9% |
| Immigrants | Lithuania | 99.9 /100 | #24 | Exceptional 1.9% |
| Bulgarians | 99.9 /100 | #25 | Exceptional 1.9% |
| Immigrants | Japan | 99.9 /100 | #26 | Exceptional 1.9% |
| Taiwanese | 99.9 /100 | #27 | Exceptional 1.9% |
| Immigrants | Malaysia | 99.9 /100 | #28 | Exceptional 1.9% |
| Egyptians | 99.9 /100 | #29 | Exceptional 1.9% |
| Immigrants | Nepal | 99.9 /100 | #30 | Exceptional 1.9% |
| Mongolians | 99.9 /100 | #31 | Exceptional 1.9% |
| Luxembourgers | 99.9 /100 | #32 | Exceptional 1.9% |
| Immigrants | Egypt | 99.9 /100 | #33 | Exceptional 1.9% |
| Immigrants | Turkey | 99.8 /100 | #34 | Exceptional 1.9% |
| Immigrants | Australia | 99.8 /100 | #35 | Exceptional 1.9% |