Arab vs Armenian Disability Age Over 75

COMPARE

Arab
Race
Ancestry
AfghanAfricanAlaska NativeAlaskan AthabascanAlbanianAleutAlsatianAmericanApacheArabArapahoArgentineanAssyrian/Chaldean/SyriacAustralianAustrianBahamianBangladeshiBarbadianBasqueBelgianBelizeanBermudanBhutaneseBlackfeetBolivianBrazilianBritishBritish West IndianBulgarianBurmeseCajunCambodianCanadianCape VerdeanCarpatho RusynCelticCentral AmericanCentral American IndianCherokeeCheyenneChickasawChileanChineseChippewaChoctawColombianColvilleComancheCosta RicanCreeCreekCroatianCrowCubanCypriotCzechCzechoslovakianDanishDelawareDominicanDutchDutch West IndianEastern EuropeanEcuadorianEgyptianEnglishEstonianEthiopianEuropeanFijianFilipinoFinnishFrenchFrench American IndianFrench CanadianGermanGerman RussianGhanaianGreekGuamanian/ChamorroGuatemalanGuyaneseHaitianHmongHonduranHopiHoumaHungarianIcelanderIndian (Asian)IndonesianInupiatIranianIraqiIrishIroquoisIsraeliItalianJamaicanJapaneseJordanianKenyanKiowaKoreanLaotianLatvianLebaneseLiberianLithuanianLumbeeLuxembourgerMacedonianMalaysianMalteseMarshalleseMenomineeMexicanMexican American IndianMongolianMoroccanNative HawaiianNavajoNepaleseNew ZealanderNicaraguanNigerianNorthern EuropeanNorwegianOkinawanOsageOttawaPaiutePakistaniPalestinianPanamanianParaguayanPennsylvania GermanPeruvianPimaPolishPortuguesePotawatomiPuebloPuerto RicanPuget Sound SalishRomanianRussianSalvadoranSamoanScandinavianScotch-IrishScottishSeminoleSenegaleseSerbianShoshoneSierra LeoneanSiouxSlavicSlovakSloveneSomaliSouth AfricanSouth AmericanSouth American IndianSoviet UnionSpaniardSpanishSpanish AmericanSpanish American IndianSri LankanSubsaharan AfricanSudaneseSwedishSwissSyrianTaiwaneseThaiTlingit-HaidaTohono O'OdhamTonganTrinidadian and TobagonianTsimshianTurkishU.S. Virgin IslanderUgandanUkrainianUruguayanUteVenezuelanVietnameseWelshWest IndianYakamaYaquiYugoslavianYumanYup'ikZimbabwean
Immigration
NonimmigrantsImmigrantsAfghanistanAfricaAlbaniaArgentinaArmeniaAsiaAustraliaAustriaBahamasBangladeshBarbadosBelarusBelgiumBelizeBoliviaBosnia and HerzegovinaBrazilBulgariaBurma/MyanmarCabo VerdeCambodiaCameroonCanadaCaribbeanCentral AmericaChileChinaColombiaCongoCosta RicaCroatiaCubaCzechoslovakiaDenmarkDominicaDominican RepublicEastern AfricaEastern AsiaEastern EuropeEcuadorEgyptEl SalvadorEnglandEritreaEthiopiaEuropeFijiFranceGermanyGhanaGreeceGrenadaGuatemalaGuyanaHaitiHondurasHong KongHungaryIndiaIndonesiaIranIraqIrelandIsraelItalyJamaicaJapanJordanKazakhstanKenyaKoreaKuwaitLaosLatin AmericaLatviaLebanonLiberiaLithuaniaMalaysiaMexicoMicronesiaMiddle AfricaMoldovaMoroccoNepalNetherlandsNicaraguaNigeriaNorth AmericaNorth MacedoniaNorthern AfricaNorthern EuropeNorwayOceaniaPakistanPanamaPeruPhilippinesPolandPortugalRomaniaRussiaSaudi ArabiaScotlandSenegalSerbiaSierra LeoneSingaporeSomaliaSouth AfricaSouth AmericaSouth Central AsiaSouth Eastern AsiaSouthern EuropeSpainSri LankaSt. Vincent and the GrenadinesSudanSwedenSwitzerlandSyriaTaiwanThailandTrinidad and TobagoTurkeyUgandaUkraineUruguayUzbekistanVenezuelaVietnamWest IndiesWestern AfricaWestern AsiaWestern EuropeYemenZaireZimbabweAzores
Armenian
Race
Ancestry
AfghanAfricanAlaska NativeAlaskan AthabascanAlbanianAleutAlsatianAmericanApacheArapahoArgentineanArmenianAssyrian/Chaldean/SyriacAustralianAustrianBahamianBangladeshiBarbadianBasqueBelgianBelizeanBermudanBhutaneseBlackfeetBolivianBrazilianBritishBritish West IndianBulgarianBurmeseCajunCambodianCanadianCape VerdeanCarpatho RusynCelticCentral AmericanCentral American IndianCherokeeCheyenneChickasawChileanChineseChippewaChoctawColombianColvilleComancheCosta RicanCreeCreekCroatianCrowCubanCypriotCzechCzechoslovakianDanishDelawareDominicanDutchDutch West IndianEastern EuropeanEcuadorianEgyptianEnglishEstonianEthiopianEuropeanFijianFilipinoFinnishFrenchFrench American IndianFrench CanadianGermanGerman RussianGhanaianGreekGuamanian/ChamorroGuatemalanGuyaneseHaitianHmongHonduranHopiHoumaHungarianIcelanderIndian (Asian)IndonesianInupiatIranianIraqiIrishIroquoisIsraeliItalianJamaicanJapaneseJordanianKenyanKiowaKoreanLaotianLatvianLebaneseLiberianLithuanianLumbeeLuxembourgerMacedonianMalaysianMalteseMarshalleseMenomineeMexicanMexican American IndianMongolianMoroccanNative HawaiianNavajoNepaleseNew ZealanderNicaraguanNigerianNorthern EuropeanNorwegianOkinawanOsageOttawaPaiutePakistaniPalestinianPanamanianParaguayanPennsylvania GermanPeruvianPimaPolishPortuguesePotawatomiPuebloPuerto RicanPuget Sound SalishRomanianRussianSalvadoranSamoanScandinavianScotch-IrishScottishSeminoleSenegaleseSerbianShoshoneSierra LeoneanSiouxSlavicSlovakSloveneSomaliSouth AfricanSouth AmericanSouth American IndianSoviet UnionSpaniardSpanishSpanish AmericanSpanish American IndianSri LankanSubsaharan AfricanSudaneseSwedishSwissSyrianTaiwaneseThaiTlingit-HaidaTohono O'OdhamTonganTrinidadian and TobagonianTsimshianTurkishU.S. Virgin IslanderUgandanUkrainianUruguayanUteVenezuelanVietnameseWelshWest IndianYakamaYaquiYugoslavianYumanYup'ikZimbabwean
Immigration
NonimmigrantsImmigrantsAfghanistanAfricaAlbaniaArgentinaArmeniaAsiaAustraliaAustriaBahamasBangladeshBarbadosBelarusBelgiumBelizeBoliviaBosnia and HerzegovinaBrazilBulgariaBurma/MyanmarCabo VerdeCambodiaCameroonCanadaCaribbeanCentral AmericaChileChinaColombiaCongoCosta RicaCroatiaCubaCzechoslovakiaDenmarkDominicaDominican RepublicEastern AfricaEastern AsiaEastern EuropeEcuadorEgyptEl SalvadorEnglandEritreaEthiopiaEuropeFijiFranceGermanyGhanaGreeceGrenadaGuatemalaGuyanaHaitiHondurasHong KongHungaryIndiaIndonesiaIranIraqIrelandIsraelItalyJamaicaJapanJordanKazakhstanKenyaKoreaKuwaitLaosLatin AmericaLatviaLebanonLiberiaLithuaniaMalaysiaMexicoMicronesiaMiddle AfricaMoldovaMoroccoNepalNetherlandsNicaraguaNigeriaNorth AmericaNorth MacedoniaNorthern AfricaNorthern EuropeNorwayOceaniaPakistanPanamaPeruPhilippinesPolandPortugalRomaniaRussiaSaudi ArabiaScotlandSenegalSerbiaSierra LeoneSingaporeSomaliaSouth AfricaSouth AmericaSouth Central AsiaSouth Eastern AsiaSouthern EuropeSpainSri LankaSt. Vincent and the GrenadinesSudanSwedenSwitzerlandSyriaTaiwanThailandTrinidad and TobagoTurkeyUgandaUkraineUruguayUzbekistanVenezuelaVietnamWest IndiesWestern AfricaWestern AsiaWestern EuropeYemenZaireZimbabweAzores
Disability Age Over 75
Income
Poverty
Unemployment
Labor Participation
Family Structure
Vehicle Availability
Education Level
Disability

Disability Age Over 75 Comparison

Arabs

Armenians

Good
Tragic
47.1%
DISABILITY AGE OVER 75
73.3/ 100
METRIC RATING
156th/ 347
METRIC RANK
50.0%
DISABILITY AGE OVER 75
0.0/ 100
METRIC RATING
297th/ 347
METRIC RANK

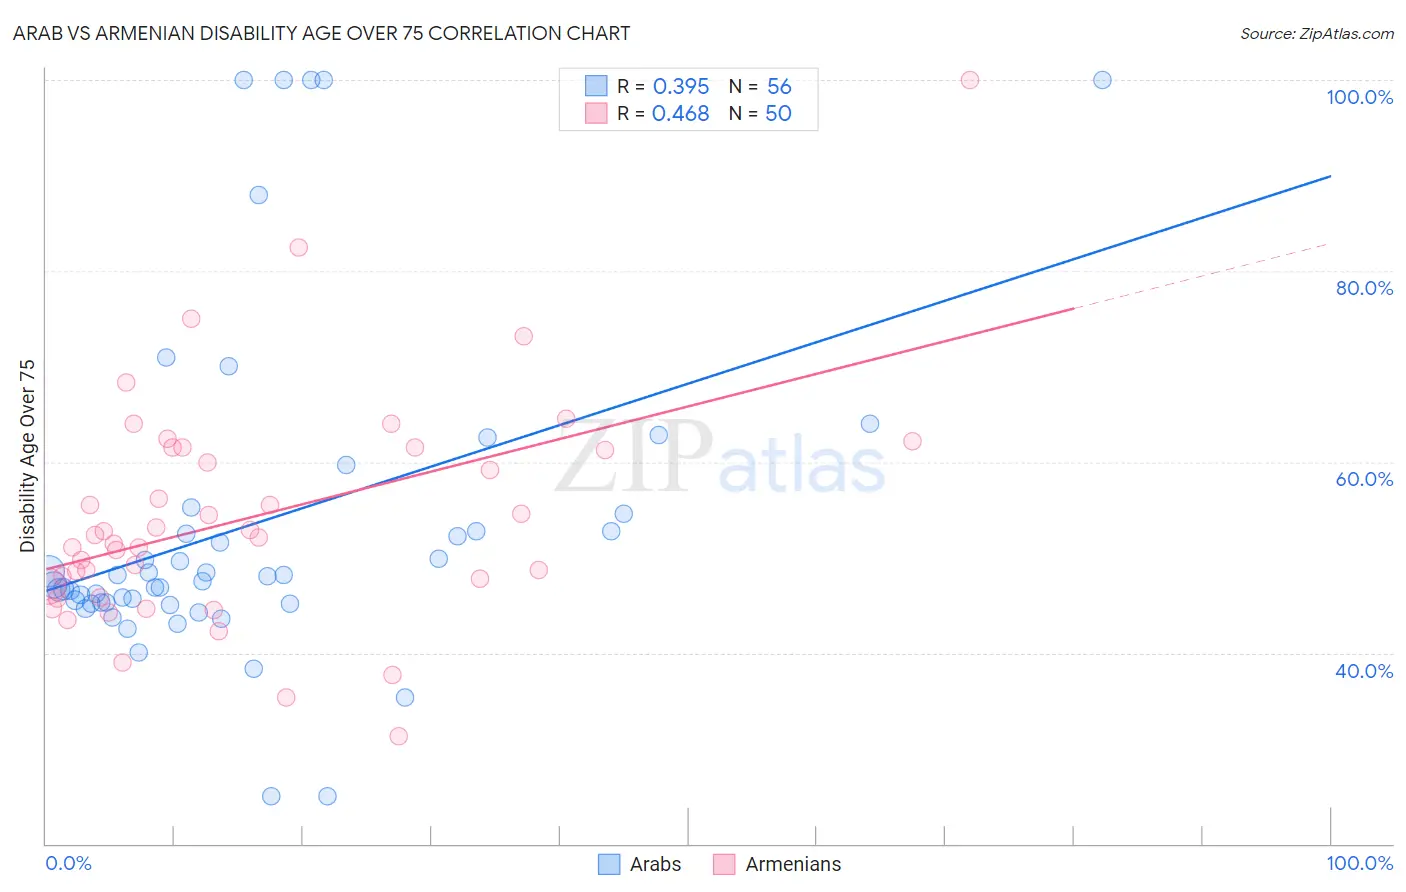
Arab vs Armenian Disability Age Over 75 Correlation Chart

The statistical analysis conducted on geographies consisting of 485,582,526 people shows a mild positive correlation between the proportion of Arabs and percentage of population with a disability over the age of 75 in the United States with a correlation coefficient (R) of 0.395 and weighted average of 47.1%. Similarly, the statistical analysis conducted on geographies consisting of 310,578,172 people shows a moderate positive correlation between the proportion of Armenians and percentage of population with a disability over the age of 75 in the United States with a correlation coefficient (R) of 0.468 and weighted average of 50.0%, a difference of 6.3%.
Arab vs Armenian Disability Age Over 75

Disability Age Over 75 Correlation Summary

MeasurementArabArmenian
Minimum25.0%31.2%
Maximum100.0%100.0%
Range75.0%68.8%
Mean53.5%54.2%
Median47.8%52.2%
Interquartile 25% (IQ1)45.2%47.0%
Interquartile 75% (IQ3)53.7%61.5%
Interquartile Range (IQR)8.5%14.5%
Standard Deviation (Sample)17.6%12.0%
Standard Deviation (Population)17.4%11.9%

Similar Demographics by Disability Age Over 75

Demographics Similar to Arabs by Disability Age Over 75

In terms of disability age over 75, the demographic groups most similar to Arabs are Bhutanese (47.1%, a difference of 0.020%), Immigrants from Zaire (47.1%, a difference of 0.040%), Immigrants from Belarus (47.1%, a difference of 0.040%), Immigrants from Iran (47.1%, a difference of 0.040%), and Immigrants from Guyana (47.1%, a difference of 0.040%).
DemographicsRating | RankDisability Age Over 75
Welsh
81.3
/100
|
#149
Excellent
47.0%
Immigrants | Russia
79.3
/100
|
#150
Good
47.0%
French Canadians
79.0
/100
|
#151
Good
47.0%
Immigrants | Asia
76.5
/100
|
#152
Good
47.0%
Immigrants | Zaire
74.8
/100
|
#153
Good
47.1%
Immigrants | Belarus
74.8
/100
|
#154
Good
47.1%
Immigrants | Iran
74.7
/100
|
#155
Good
47.1%
Arabs
73.3
/100
|
#156
Good
47.1%
Bhutanese
72.6
/100
|
#157
Good
47.1%
Immigrants | Guyana
71.9
/100
|
#158
Good
47.1%
Immigrants | Morocco
71.4
/100
|
#159
Good
47.1%
Immigrants | Middle Africa
68.3
/100
|
#160
Good
47.1%
South American Indians
68.1
/100
|
#161
Good
47.1%
Pennsylvania Germans
66.0
/100
|
#162
Good
47.2%
Immigrants | Eastern Africa
65.5
/100
|
#163
Good
47.2%

Demographics Similar to Armenians by Disability Age Over 75

In terms of disability age over 75, the demographic groups most similar to Armenians are Mexican American Indian (50.0%, a difference of 0.030%), Marshallese (50.1%, a difference of 0.050%), Spanish American (50.0%, a difference of 0.060%), Immigrants from Cambodia (50.0%, a difference of 0.10%), and Immigrants from Micronesia (50.1%, a difference of 0.12%).
DemographicsRating | RankDisability Age Over 75
Puget Sound Salish
0.0
/100
|
#290
Tragic
49.8%
Arapaho
0.0
/100
|
#291
Tragic
49.8%
Shoshone
0.0
/100
|
#292
Tragic
49.9%
Spanish American Indians
0.0
/100
|
#293
Tragic
49.9%
Immigrants | Cambodia
0.0
/100
|
#294
Tragic
50.0%
Spanish Americans
0.0
/100
|
#295
Tragic
50.0%
Mexican American Indians
0.0
/100
|
#296
Tragic
50.0%
Armenians
0.0
/100
|
#297
Tragic
50.0%
Marshallese
0.0
/100
|
#298
Tragic
50.1%
Immigrants | Micronesia
0.0
/100
|
#299
Tragic
50.1%
Cape Verdeans
0.0
/100
|
#300
Tragic
50.1%
Dominicans
0.0
/100
|
#301
Tragic
50.2%
Cherokee
0.0
/100
|
#302
Tragic
50.2%
Japanese
0.0
/100
|
#303
Tragic
50.2%
Immigrants | Dominican Republic
0.0
/100
|
#304
Tragic
50.3%