Albanian vs Salvadoran Vision Disability
COMPARE
Albanian
Salvadoran
Vision Disability
Vision Disability Comparison
Albanians
Salvadorans
2.1%
VISION DISABILITY
94.9/ 100
METRIC RATING
101st/ 347
METRIC RANK
2.2%
VISION DISABILITY
27.4/ 100
METRIC RATING
189th/ 347
METRIC RANK
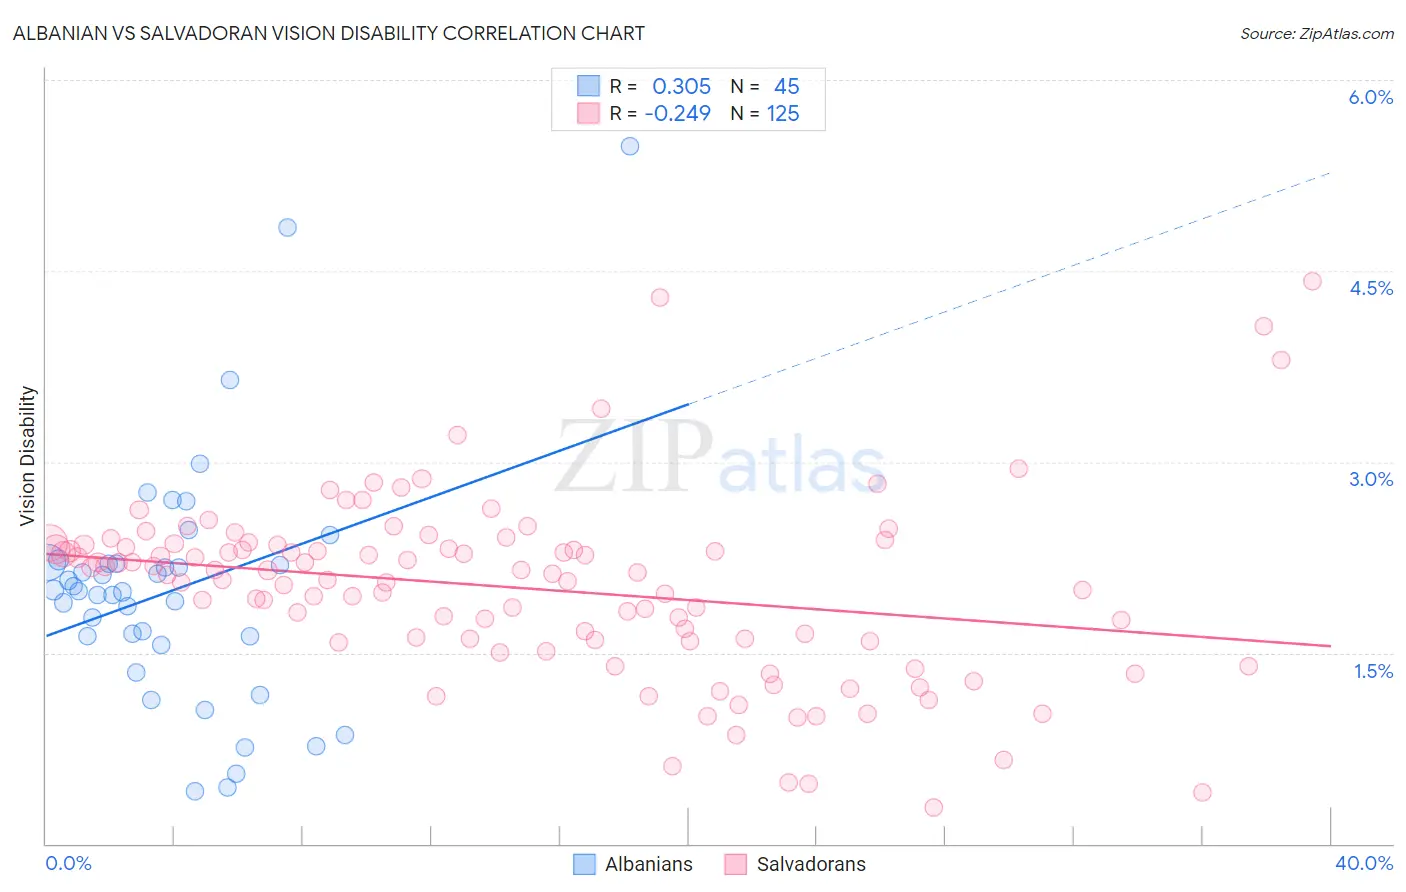
Albanian vs Salvadoran Vision Disability Correlation Chart
The statistical analysis conducted on geographies consisting of 193,200,917 people shows a mild positive correlation between the proportion of Albanians and percentage of population with vision disability in the United States with a correlation coefficient (R) of 0.305 and weighted average of 2.1%. Similarly, the statistical analysis conducted on geographies consisting of 398,695,149 people shows a weak negative correlation between the proportion of Salvadorans and percentage of population with vision disability in the United States with a correlation coefficient (R) of -0.249 and weighted average of 2.2%, a difference of 6.4%.
Vision Disability Correlation Summary
| Measurement | Albanian | Salvadoran |
| Minimum | 0.41% | 0.28% |
| Maximum | 5.5% | 4.4% |
| Range | 5.1% | 4.1% |
| Mean | 2.0% | 2.0% |
| Median | 2.0% | 2.1% |
| Interquartile 25% (IQ1) | 1.6% | 1.6% |
| Interquartile 75% (IQ3) | 2.2% | 2.3% |
| Interquartile Range (IQR) | 0.61% | 0.75% |
| Standard Deviation (Sample) | 0.97% | 0.72% |
| Standard Deviation (Population) | 0.96% | 0.71% |
Similar Demographics by Vision Disability
Demographics Similar to Albanians by Vision Disability
In terms of vision disability, the demographic groups most similar to Albanians are Sri Lankan (2.1%, a difference of 0.030%), Greek (2.1%, a difference of 0.080%), Estonian (2.1%, a difference of 0.12%), Immigrants from Austria (2.1%, a difference of 0.17%), and Immigrants from Italy (2.1%, a difference of 0.17%).
| Demographics | Rating | Rank | Vision Disability |
| Immigrants | Croatia | 96.0 /100 | #94 | Exceptional 2.1% |
| Australians | 95.9 /100 | #95 | Exceptional 2.1% |
| Romanians | 95.7 /100 | #96 | Exceptional 2.1% |
| Immigrants | Afghanistan | 95.6 /100 | #97 | Exceptional 2.1% |
| Immigrants | South Africa | 95.4 /100 | #98 | Exceptional 2.1% |
| Estonians | 95.3 /100 | #99 | Exceptional 2.1% |
| Greeks | 95.1 /100 | #100 | Exceptional 2.1% |
| Albanians | 94.9 /100 | #101 | Exceptional 2.1% |
| Sri Lankans | 94.8 /100 | #102 | Exceptional 2.1% |
| Immigrants | Austria | 94.4 /100 | #103 | Exceptional 2.1% |
| Immigrants | Italy | 94.4 /100 | #104 | Exceptional 2.1% |
| Carpatho Rusyns | 94.3 /100 | #105 | Exceptional 2.1% |
| Swedes | 94.2 /100 | #106 | Exceptional 2.1% |
| Danes | 94.2 /100 | #107 | Exceptional 2.1% |
| Koreans | 94.1 /100 | #108 | Exceptional 2.1% |
Demographics Similar to Salvadorans by Vision Disability
In terms of vision disability, the demographic groups most similar to Salvadorans are Guyanese (2.2%, a difference of 0.11%), Immigrants from Costa Rica (2.2%, a difference of 0.11%), Canadian (2.2%, a difference of 0.13%), European (2.2%, a difference of 0.13%), and British (2.2%, a difference of 0.19%).
| Demographics | Rating | Rank | Vision Disability |
| Costa Ricans | 40.7 /100 | #182 | Average 2.2% |
| Immigrants | Burma/Myanmar | 37.9 /100 | #183 | Fair 2.2% |
| Moroccans | 35.4 /100 | #184 | Fair 2.2% |
| Immigrants | Middle Africa | 33.5 /100 | #185 | Fair 2.2% |
| Native Hawaiians | 33.3 /100 | #186 | Fair 2.2% |
| Immigrants | St. Vincent and the Grenadines | 30.3 /100 | #187 | Fair 2.2% |
| Guyanese | 28.9 /100 | #188 | Fair 2.2% |
| Salvadorans | 27.4 /100 | #189 | Fair 2.2% |
| Immigrants | Costa Rica | 26.1 /100 | #190 | Fair 2.2% |
| Canadians | 25.8 /100 | #191 | Fair 2.2% |
| Europeans | 25.7 /100 | #192 | Fair 2.2% |
| British | 25.1 /100 | #193 | Fair 2.2% |
| Immigrants | Barbados | 24.0 /100 | #194 | Fair 2.2% |
| Immigrants | Immigrants | 23.7 /100 | #195 | Fair 2.2% |
| Immigrants | Grenada | 23.1 /100 | #196 | Fair 2.2% |