Alaskan Athabascan vs Immigrants from Belize Hearing Disability
COMPARE
Alaskan Athabascan
Immigrants from Belize
Hearing Disability
Hearing Disability Comparison
Alaskan Athabascans
Immigrants from Belize
5.3%
HEARING DISABILITY
0.0/ 100
METRIC RATING
345th/ 347
METRIC RANK
2.7%
HEARING DISABILITY
98.2/ 100
METRIC RATING
66th/ 347
METRIC RANK
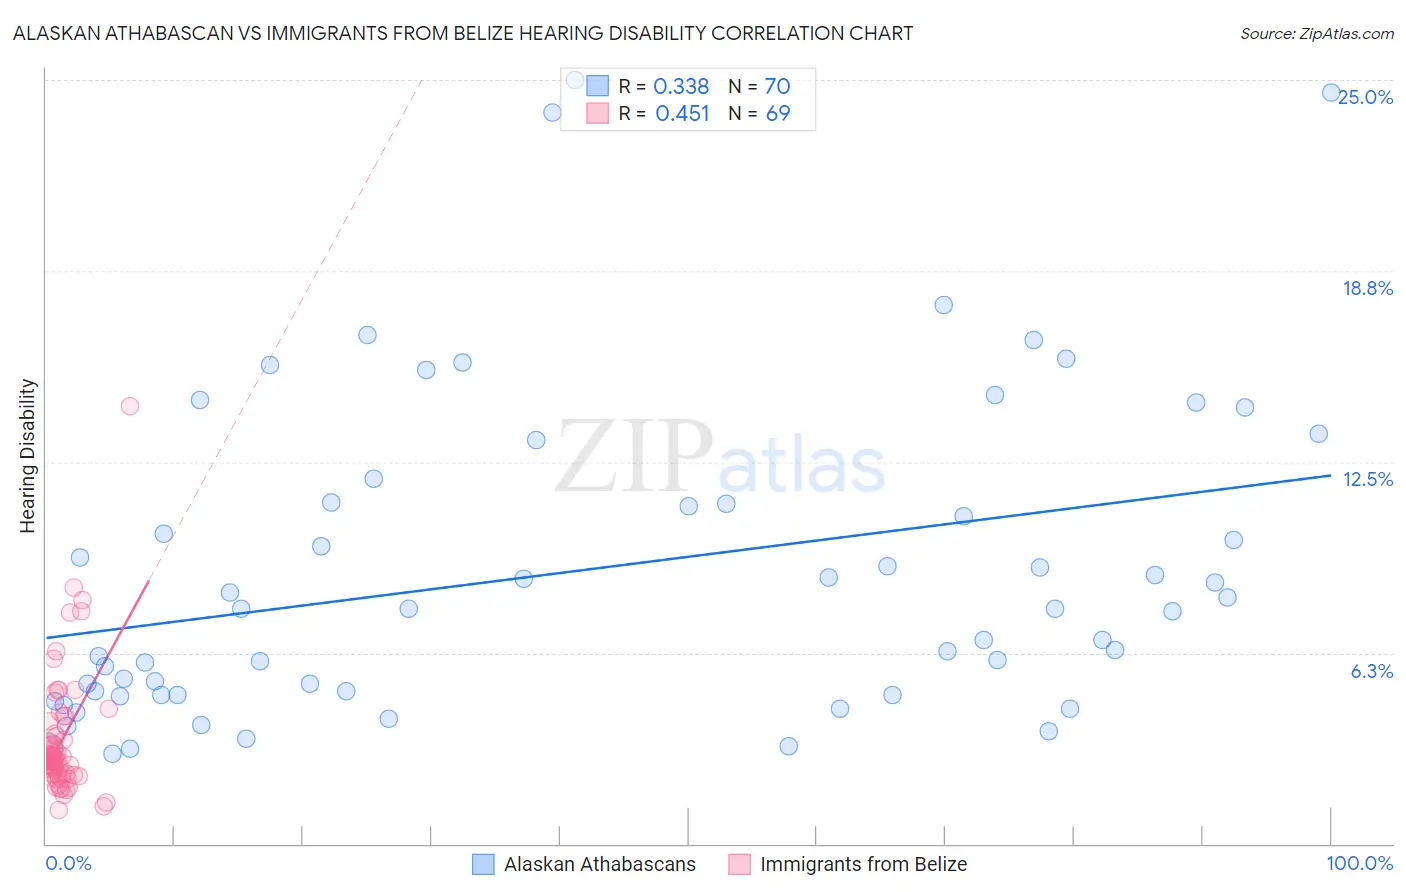
Alaskan Athabascan vs Immigrants from Belize Hearing Disability Correlation Chart
The statistical analysis conducted on geographies consisting of 45,819,269 people shows a mild positive correlation between the proportion of Alaskan Athabascans and percentage of population with hearing disability in the United States with a correlation coefficient (R) of 0.338 and weighted average of 5.3%. Similarly, the statistical analysis conducted on geographies consisting of 130,272,611 people shows a moderate positive correlation between the proportion of Immigrants from Belize and percentage of population with hearing disability in the United States with a correlation coefficient (R) of 0.451 and weighted average of 2.7%, a difference of 96.2%.
Hearing Disability Correlation Summary
| Measurement | Alaskan Athabascan | Immigrants from Belize |
| Minimum | 2.9% | 1.1% |
| Maximum | 25.0% | 14.3% |
| Range | 22.1% | 13.2% |
| Mean | 9.0% | 3.4% |
| Median | 7.7% | 2.8% |
| Interquartile 25% (IQ1) | 4.9% | 2.3% |
| Interquartile 75% (IQ3) | 11.2% | 3.6% |
| Interquartile Range (IQR) | 6.3% | 1.3% |
| Standard Deviation (Sample) | 5.2% | 2.1% |
| Standard Deviation (Population) | 5.2% | 2.0% |
Similar Demographics by Hearing Disability
Demographics Similar to Alaskan Athabascans by Hearing Disability
In terms of hearing disability, the demographic groups most similar to Alaskan Athabascans are Colville (5.3%, a difference of 0.43%), Yup'ik (5.8%, a difference of 9.7%), Tlingit-Haida (4.8%, a difference of 9.9%), Inupiat (4.7%, a difference of 12.9%), and Tsimshian (4.7%, a difference of 13.2%).
| Demographics | Rating | Rank | Hearing Disability |
| Dutch West Indians | 0.0 /100 | #333 | Tragic 4.3% |
| Aleuts | 0.0 /100 | #334 | Tragic 4.3% |
| Kiowa | 0.0 /100 | #335 | Tragic 4.3% |
| Creek | 0.0 /100 | #336 | Tragic 4.4% |
| Chickasaw | 0.0 /100 | #337 | Tragic 4.5% |
| Alaska Natives | 0.0 /100 | #338 | Tragic 4.5% |
| Choctaw | 0.0 /100 | #339 | Tragic 4.5% |
| Pueblo | 0.0 /100 | #340 | Tragic 4.6% |
| Navajo | 0.0 /100 | #341 | Tragic 4.6% |
| Tsimshian | 0.0 /100 | #342 | Tragic 4.7% |
| Inupiat | 0.0 /100 | #343 | Tragic 4.7% |
| Tlingit-Haida | 0.0 /100 | #344 | Tragic 4.8% |
| Alaskan Athabascans | 0.0 /100 | #345 | Tragic 5.3% |
| Colville | 0.0 /100 | #346 | Tragic 5.3% |
| Yup'ik | 0.0 /100 | #347 | Tragic 5.8% |
Demographics Similar to Immigrants from Belize by Hearing Disability
In terms of hearing disability, the demographic groups most similar to Immigrants from Belize are Immigrants from Nepal (2.7%, a difference of 0.12%), Immigrants from Sri Lanka (2.7%, a difference of 0.21%), Egyptian (2.7%, a difference of 0.23%), Indian (Asian) (2.7%, a difference of 0.26%), and Immigrants from Uzbekistan (2.7%, a difference of 0.32%).
| Demographics | Rating | Rank | Hearing Disability |
| Immigrants | Eritrea | 98.5 /100 | #59 | Exceptional 2.7% |
| Immigrants | Egypt | 98.5 /100 | #60 | Exceptional 2.7% |
| Immigrants | Uzbekistan | 98.4 /100 | #61 | Exceptional 2.7% |
| Immigrants | Colombia | 98.4 /100 | #62 | Exceptional 2.7% |
| Indians (Asian) | 98.4 /100 | #63 | Exceptional 2.7% |
| Immigrants | Sri Lanka | 98.4 /100 | #64 | Exceptional 2.7% |
| Immigrants | Nepal | 98.3 /100 | #65 | Exceptional 2.7% |
| Immigrants | Belize | 98.2 /100 | #66 | Exceptional 2.7% |
| Egyptians | 98.1 /100 | #67 | Exceptional 2.7% |
| Immigrants | Africa | 98.0 /100 | #68 | Exceptional 2.7% |
| Nicaraguans | 97.9 /100 | #69 | Exceptional 2.7% |
| Peruvians | 97.7 /100 | #70 | Exceptional 2.7% |
| Central Americans | 97.7 /100 | #71 | Exceptional 2.7% |
| Afghans | 97.6 /100 | #72 | Exceptional 2.7% |
| Argentineans | 97.5 /100 | #73 | Exceptional 2.7% |