Alaska Native vs Immigrants from Burma/Myanmar Disability Age 35 to 64
COMPARE
Alaska Native
Immigrants from Burma/Myanmar
Disability Age 35 to 64
Disability Age 35 to 64 Comparison
Alaska Natives
Immigrants from Burma/Myanmar
14.5%
DISABILITY AGE 35 TO 64
0.0/ 100
METRIC RATING
315th/ 347
METRIC RANK
12.3%
DISABILITY AGE 35 TO 64
1.2/ 100
METRIC RATING
250th/ 347
METRIC RANK
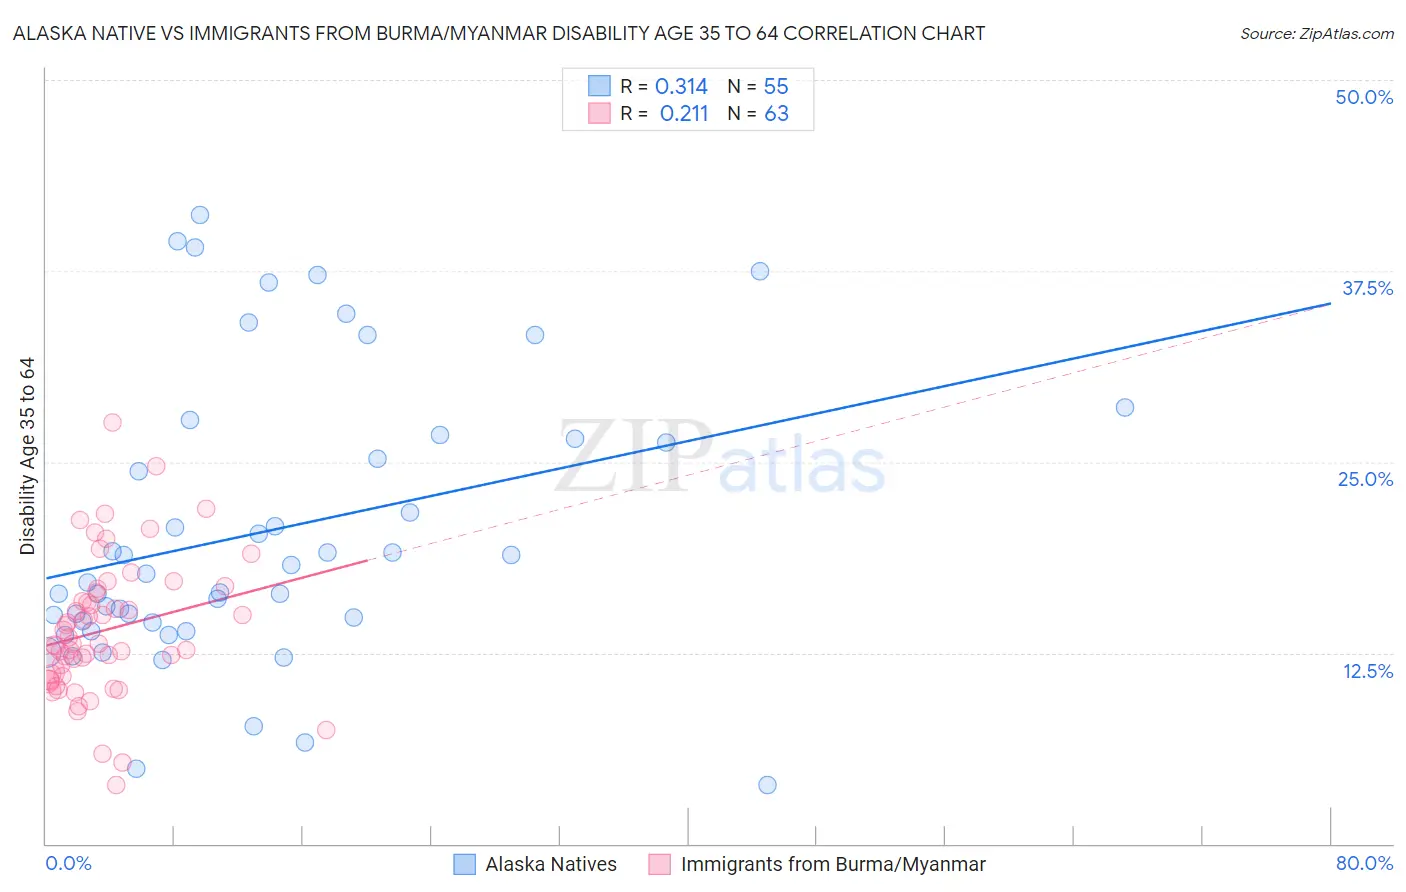
Alaska Native vs Immigrants from Burma/Myanmar Disability Age 35 to 64 Correlation Chart
The statistical analysis conducted on geographies consisting of 76,743,337 people shows a mild positive correlation between the proportion of Alaska Natives and percentage of population with a disability between the ages 34 and 64 in the United States with a correlation coefficient (R) of 0.314 and weighted average of 14.5%. Similarly, the statistical analysis conducted on geographies consisting of 172,272,577 people shows a weak positive correlation between the proportion of Immigrants from Burma/Myanmar and percentage of population with a disability between the ages 34 and 64 in the United States with a correlation coefficient (R) of 0.211 and weighted average of 12.3%, a difference of 17.8%.
Disability Age 35 to 64 Correlation Summary
| Measurement | Alaska Native | Immigrants from Burma/Myanmar |
| Minimum | 3.8% | 3.9% |
| Maximum | 41.2% | 27.6% |
| Range | 37.3% | 23.7% |
| Mean | 20.5% | 14.0% |
| Median | 17.7% | 13.1% |
| Interquartile 25% (IQ1) | 14.5% | 11.0% |
| Interquartile 75% (IQ3) | 26.5% | 16.5% |
| Interquartile Range (IQR) | 12.1% | 5.5% |
| Standard Deviation (Sample) | 9.3% | 4.5% |
| Standard Deviation (Population) | 9.2% | 4.5% |
Similar Demographics by Disability Age 35 to 64
Demographics Similar to Alaska Natives by Disability Age 35 to 64
In terms of disability age 35 to 64, the demographic groups most similar to Alaska Natives are Shoshone (14.5%, a difference of 0.020%), Osage (14.5%, a difference of 0.19%), Iroquois (14.4%, a difference of 0.77%), Crow (14.6%, a difference of 1.1%), and Ottawa (14.6%, a difference of 1.1%).
| Demographics | Rating | Rank | Disability Age 35 to 64 |
| Inupiat | 0.0 /100 | #308 | Tragic 14.1% |
| Cree | 0.0 /100 | #309 | Tragic 14.1% |
| Cape Verdeans | 0.0 /100 | #310 | Tragic 14.1% |
| Immigrants | Azores | 0.0 /100 | #311 | Tragic 14.3% |
| Paiute | 0.0 /100 | #312 | Tragic 14.3% |
| Iroquois | 0.0 /100 | #313 | Tragic 14.4% |
| Shoshone | 0.0 /100 | #314 | Tragic 14.5% |
| Alaska Natives | 0.0 /100 | #315 | Tragic 14.5% |
| Osage | 0.0 /100 | #316 | Tragic 14.5% |
| Crow | 0.0 /100 | #317 | Tragic 14.6% |
| Ottawa | 0.0 /100 | #318 | Tragic 14.6% |
| Immigrants | Cabo Verde | 0.0 /100 | #319 | Tragic 14.7% |
| Blacks/African Americans | 0.0 /100 | #320 | Tragic 14.7% |
| Comanche | 0.0 /100 | #321 | Tragic 14.7% |
| Potawatomi | 0.0 /100 | #322 | Tragic 14.8% |
Demographics Similar to Immigrants from Burma/Myanmar by Disability Age 35 to 64
In terms of disability age 35 to 64, the demographic groups most similar to Immigrants from Burma/Myanmar are German (12.3%, a difference of 0.080%), Hispanic or Latino (12.3%, a difference of 0.13%), Spaniard (12.3%, a difference of 0.16%), Immigrants from Senegal (12.2%, a difference of 0.26%), and Guamanian/Chamorro (12.2%, a difference of 0.29%).
| Demographics | Rating | Rank | Disability Age 35 to 64 |
| Slovaks | 2.7 /100 | #243 | Tragic 12.1% |
| Finns | 2.3 /100 | #244 | Tragic 12.1% |
| Immigrants | Mexico | 2.2 /100 | #245 | Tragic 12.1% |
| Guamanians/Chamorros | 1.4 /100 | #246 | Tragic 12.2% |
| Immigrants | Senegal | 1.3 /100 | #247 | Tragic 12.2% |
| Spaniards | 1.3 /100 | #248 | Tragic 12.3% |
| Hispanics or Latinos | 1.3 /100 | #249 | Tragic 12.3% |
| Immigrants | Burma/Myanmar | 1.2 /100 | #250 | Tragic 12.3% |
| Germans | 1.1 /100 | #251 | Tragic 12.3% |
| Irish | 1.0 /100 | #252 | Tragic 12.3% |
| Dutch | 1.0 /100 | #253 | Tragic 12.3% |
| Hawaiians | 0.9 /100 | #254 | Tragic 12.3% |
| Japanese | 0.8 /100 | #255 | Tragic 12.3% |
| Scottish | 0.8 /100 | #256 | Tragic 12.4% |
| Mexicans | 0.7 /100 | #257 | Tragic 12.4% |