Alaska Native vs Immigrants from Albania Cognitive Disability
COMPARE
Alaska Native
Immigrants from Albania
Cognitive Disability
Cognitive Disability Comparison
Alaska Natives
Immigrants from Albania
17.5%
COGNITIVE DISABILITY
10.4/ 100
METRIC RATING
206th/ 347
METRIC RANK
17.2%
COGNITIVE DISABILITY
64.9/ 100
METRIC RATING
165th/ 347
METRIC RANK
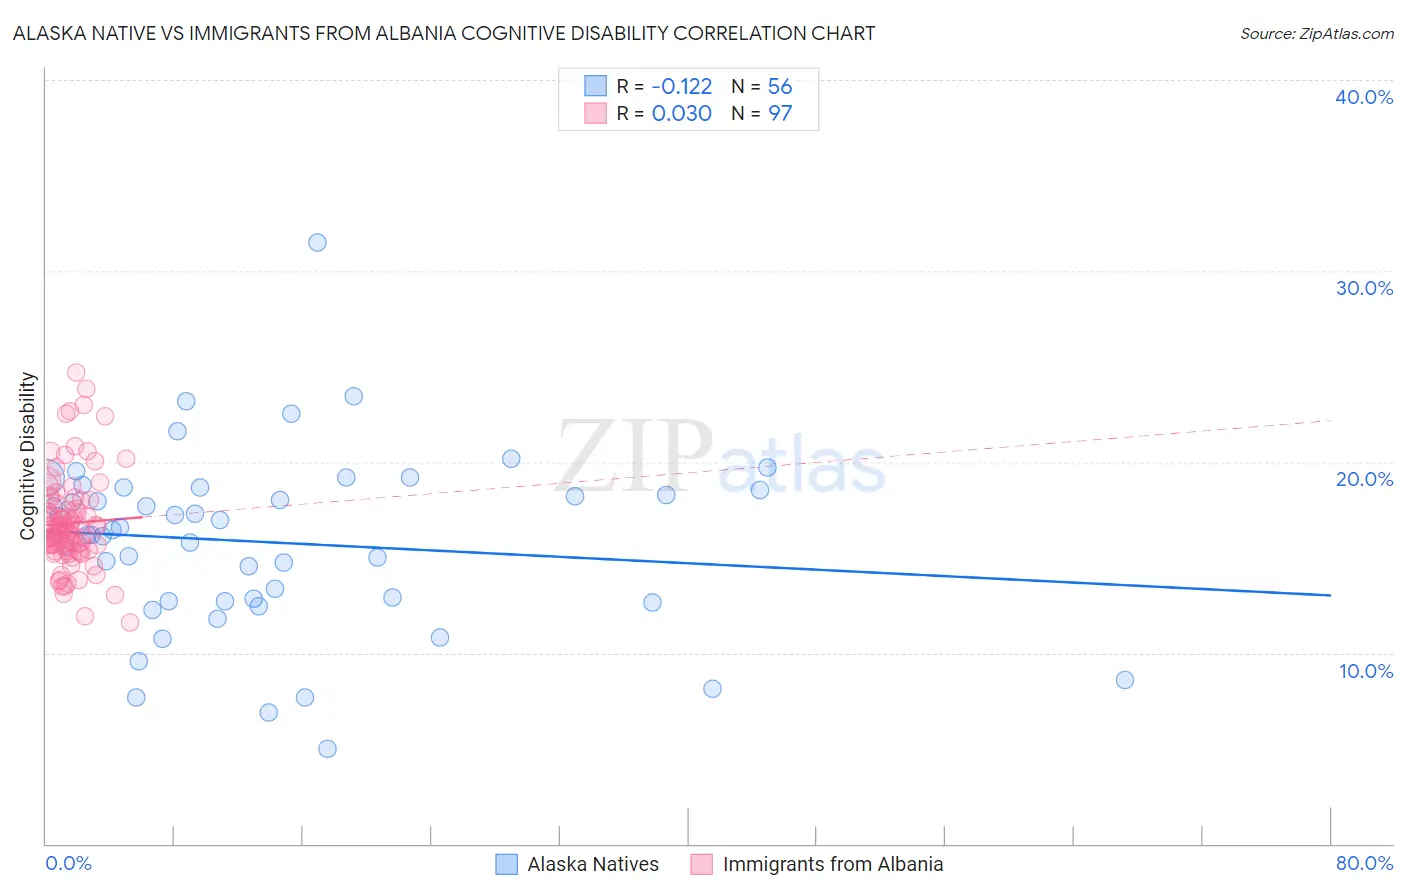
Alaska Native vs Immigrants from Albania Cognitive Disability Correlation Chart
The statistical analysis conducted on geographies consisting of 76,778,470 people shows a poor negative correlation between the proportion of Alaska Natives and percentage of population with cognitive disability in the United States with a correlation coefficient (R) of -0.122 and weighted average of 17.5%. Similarly, the statistical analysis conducted on geographies consisting of 119,394,902 people shows no correlation between the proportion of Immigrants from Albania and percentage of population with cognitive disability in the United States with a correlation coefficient (R) of 0.030 and weighted average of 17.2%, a difference of 2.0%.
Cognitive Disability Correlation Summary
| Measurement | Alaska Native | Immigrants from Albania |
| Minimum | 5.0% | 11.6% |
| Maximum | 31.5% | 24.7% |
| Range | 26.5% | 13.2% |
| Mean | 15.8% | 16.8% |
| Median | 16.3% | 16.4% |
| Interquartile 25% (IQ1) | 12.7% | 15.5% |
| Interquartile 75% (IQ3) | 18.6% | 17.7% |
| Interquartile Range (IQR) | 5.9% | 2.2% |
| Standard Deviation (Sample) | 4.7% | 2.4% |
| Standard Deviation (Population) | 4.7% | 2.4% |
Similar Demographics by Cognitive Disability
Demographics Similar to Alaska Natives by Cognitive Disability
In terms of cognitive disability, the demographic groups most similar to Alaska Natives are Immigrants from Zimbabwe (17.5%, a difference of 0.040%), Puget Sound Salish (17.5%, a difference of 0.040%), Immigrants from Caribbean (17.5%, a difference of 0.050%), Immigrants from Latin America (17.6%, a difference of 0.050%), and Immigrants from Cameroon (17.6%, a difference of 0.090%).
| Demographics | Rating | Rank | Cognitive Disability |
| Immigrants | Singapore | 14.3 /100 | #199 | Poor 17.5% |
| Haitians | 14.1 /100 | #200 | Poor 17.5% |
| South American Indians | 13.0 /100 | #201 | Poor 17.5% |
| Immigrants | Morocco | 12.0 /100 | #202 | Poor 17.5% |
| Immigrants | Caribbean | 11.0 /100 | #203 | Poor 17.5% |
| Immigrants | Zimbabwe | 11.0 /100 | #204 | Poor 17.5% |
| Puget Sound Salish | 10.9 /100 | #205 | Poor 17.5% |
| Alaska Natives | 10.4 /100 | #206 | Poor 17.5% |
| Immigrants | Latin America | 9.7 /100 | #207 | Tragic 17.6% |
| Immigrants | Cameroon | 9.3 /100 | #208 | Tragic 17.6% |
| Immigrants | Trinidad and Tobago | 8.7 /100 | #209 | Tragic 17.6% |
| Immigrants | Jamaica | 8.5 /100 | #210 | Tragic 17.6% |
| Taiwanese | 7.7 /100 | #211 | Tragic 17.6% |
| Immigrants | Oceania | 7.3 /100 | #212 | Tragic 17.6% |
| Hawaiians | 7.2 /100 | #213 | Tragic 17.6% |
Demographics Similar to Immigrants from Albania by Cognitive Disability
In terms of cognitive disability, the demographic groups most similar to Immigrants from Albania are Immigrants from Ecuador (17.2%, a difference of 0.010%), Immigrants from Syria (17.2%, a difference of 0.040%), Immigrants (17.2%, a difference of 0.070%), Immigrants from Portugal (17.2%, a difference of 0.090%), and Ecuadorian (17.2%, a difference of 0.16%).
| Demographics | Rating | Rank | Cognitive Disability |
| Celtics | 74.1 /100 | #158 | Good 17.1% |
| Immigrants | Latvia | 73.2 /100 | #159 | Good 17.2% |
| Australians | 72.4 /100 | #160 | Good 17.2% |
| Americans | 72.2 /100 | #161 | Good 17.2% |
| Yugoslavians | 71.6 /100 | #162 | Good 17.2% |
| Immigrants | Switzerland | 71.5 /100 | #163 | Good 17.2% |
| Armenians | 70.1 /100 | #164 | Good 17.2% |
| Immigrants | Albania | 64.9 /100 | #165 | Good 17.2% |
| Immigrants | Ecuador | 64.4 /100 | #166 | Good 17.2% |
| Immigrants | Syria | 63.5 /100 | #167 | Good 17.2% |
| Immigrants | Immigrants | 62.5 /100 | #168 | Good 17.2% |
| Immigrants | Portugal | 61.8 /100 | #169 | Good 17.2% |
| Ecuadorians | 59.6 /100 | #170 | Average 17.2% |
| Tlingit-Haida | 59.4 /100 | #171 | Average 17.2% |
| Immigrants | Turkey | 56.7 /100 | #172 | Average 17.2% |