Zip Codes with the Highest Percentage of Population Employed in Life, Physical & Social Science in Danbury, CT
RELATED REPORTS & OPTIONS
Life, Physical & Social Science
Danbury
Compare Zip Codes
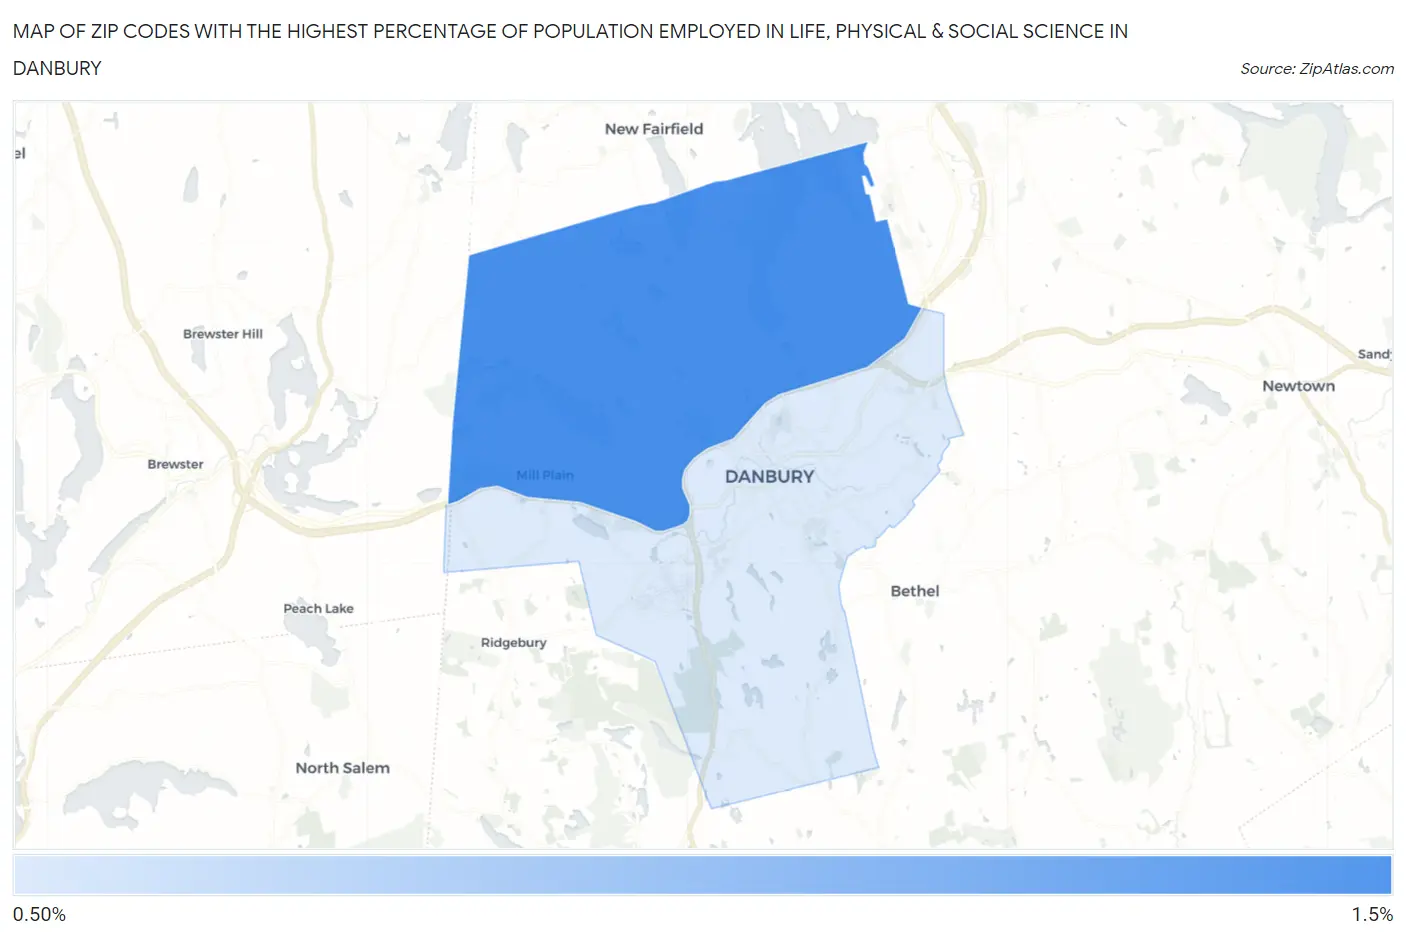
Map of Zip Codes with the Highest Percentage of Population Employed in Life, Physical & Social Science in Danbury
0.87%
1.3%
Zip Codes with the Highest Percentage of Population Employed in Life, Physical & Social Science in Danbury, CT
| Zip Code | % Employed | vs State | vs National | |
| 1. | 06811 | 1.3% | 1.2%(+0.011)#104 | 1.1%(+0.162)#7,112 |
| 2. | 06810 | 0.87% | 1.2%(-0.373)#155 | 1.1%(-0.222)#10,272 |
1
Common Questions
What are the Top Zip Codes with the Highest Percentage of Population Employed in Life, Physical & Social Science in Danbury, CT?
Top Zip Codes with the Highest Percentage of Population Employed in Life, Physical & Social Science in Danbury, CT are:
What zip code has the Highest Percentage of Population Employed in Life, Physical & Social Science in Danbury, CT?
06811 has the Highest Percentage of Population Employed in Life, Physical & Social Science in Danbury, CT with 1.3%.
What is the Percentage of Population Employed in Life, Physical & Social Science in Danbury, CT?
Percentage of Population Employed in Life, Physical & Social Science in Danbury is 1.0%.
What is the Percentage of Population Employed in Life, Physical & Social Science in Connecticut?
Percentage of Population Employed in Life, Physical & Social Science in Connecticut is 1.2%.
What is the Percentage of Population Employed in Life, Physical & Social Science in the United States?
Percentage of Population Employed in Life, Physical & Social Science in the United States is 1.1%.