Zip Codes with the Highest Percentage of Population Employed in Professional & Scientific Services in Rancho Cordova, CA
RELATED REPORTS & OPTIONS
Professional & Scientific Services
Rancho Cordova
Compare Zip Codes
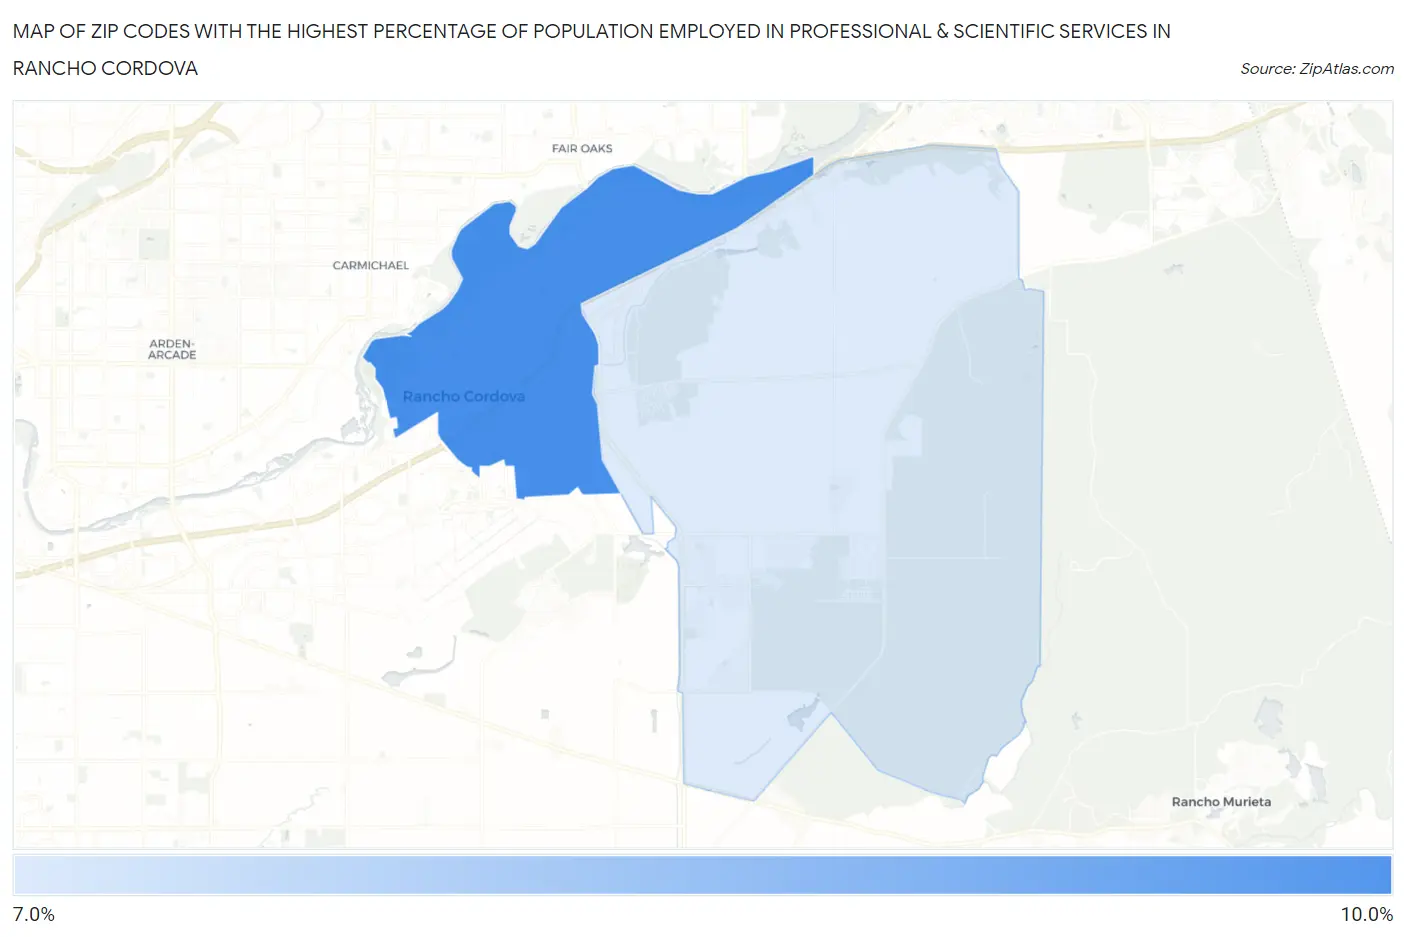
Map of Zip Codes with the Highest Percentage of Population Employed in Professional & Scientific Services in Rancho Cordova
0.0%
10.0%
Zip Codes with the Highest Percentage of Population Employed in Professional & Scientific Services in Rancho Cordova, CA
| Zip Code | % Employed | vs State | vs National | |
| 1. | 95670 | 8.2% | 9.4%(-1.24)#674 | 7.8%(+0.347)#6,415 |
| 2. | 95742 | 7.0% | 9.4%(-2.41)#791 | 7.8%(-0.821)#8,126 |
1
Common Questions
What are the Top Zip Codes with the Highest Percentage of Population Employed in Professional & Scientific Services in Rancho Cordova, CA?
Top Zip Codes with the Highest Percentage of Population Employed in Professional & Scientific Services in Rancho Cordova, CA are:
What zip code has the Highest Percentage of Population Employed in Professional & Scientific Services in Rancho Cordova, CA?
95670 has the Highest Percentage of Population Employed in Professional & Scientific Services in Rancho Cordova, CA with 8.2%.
What is the Percentage of Population Employed in Professional & Scientific Services in Rancho Cordova, CA?
Percentage of Population Employed in Professional & Scientific Services in Rancho Cordova is 7.3%.
What is the Percentage of Population Employed in Professional & Scientific Services in California?
Percentage of Population Employed in Professional & Scientific Services in California is 9.4%.
What is the Percentage of Population Employed in Professional & Scientific Services in the United States?
Percentage of Population Employed in Professional & Scientific Services in the United States is 7.8%.