Zip Codes with the Highest Percentage of Population Employed in Accommodation & Food Services in San Luis, AZ
RELATED REPORTS & OPTIONS
Accommodation & Food Services
San Luis
Compare Zip Codes
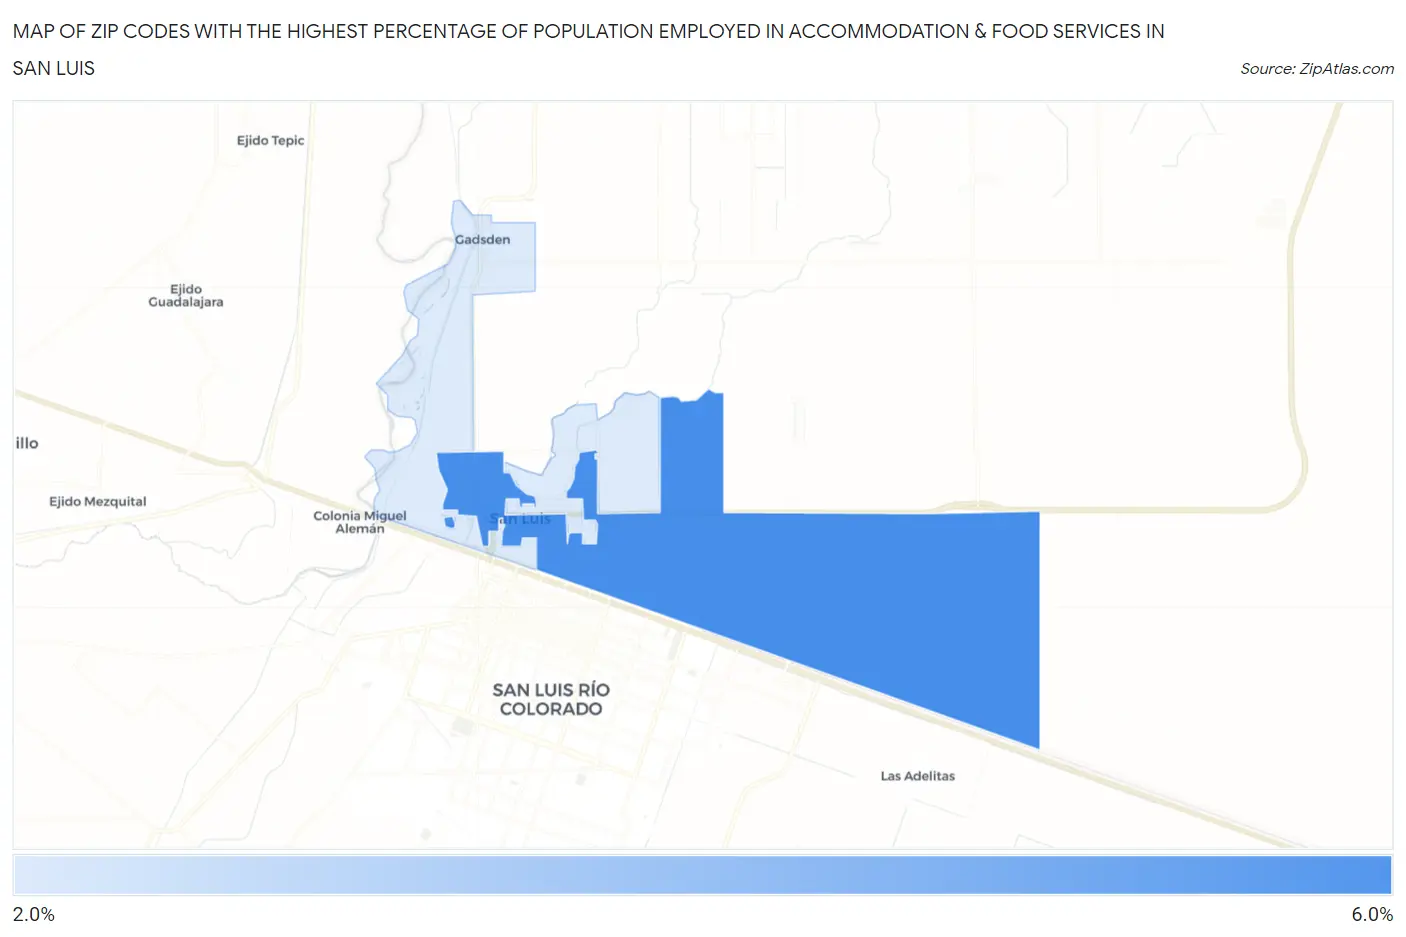
Map of Zip Codes with the Highest Percentage of Population Employed in Accommodation & Food Services in San Luis
2.9%
5.2%
Zip Codes with the Highest Percentage of Population Employed in Accommodation & Food Services in San Luis, AZ
| Zip Code | % Employed | vs State | vs National | |
| 1. | 85349 | 5.2% | 7.6%(-2.35)#278 | 6.9%(-1.68)#16,112 |
| 2. | 85336 | 2.9% | 7.6%(-4.64)#341 | 6.9%(-3.97)#23,463 |
1
Common Questions
What are the Top Zip Codes with the Highest Percentage of Population Employed in Accommodation & Food Services in San Luis, AZ?
Top Zip Codes with the Highest Percentage of Population Employed in Accommodation & Food Services in San Luis, AZ are:
What zip code has the Highest Percentage of Population Employed in Accommodation & Food Services in San Luis, AZ?
85349 has the Highest Percentage of Population Employed in Accommodation & Food Services in San Luis, AZ with 5.2%.
What is the Percentage of Population Employed in Accommodation & Food Services in San Luis, AZ?
Percentage of Population Employed in Accommodation & Food Services in San Luis is 4.6%.
What is the Percentage of Population Employed in Accommodation & Food Services in Arizona?
Percentage of Population Employed in Accommodation & Food Services in Arizona is 7.6%.
What is the Percentage of Population Employed in Accommodation & Food Services in the United States?
Percentage of Population Employed in Accommodation & Food Services in the United States is 6.9%.