Zip Codes with the Highest Percentage of Population Employed in Arts, Entertainment & Recreation in Peoria, AZ
RELATED REPORTS & OPTIONS
Arts, Entertainment & Recreation
Peoria
Compare Zip Codes
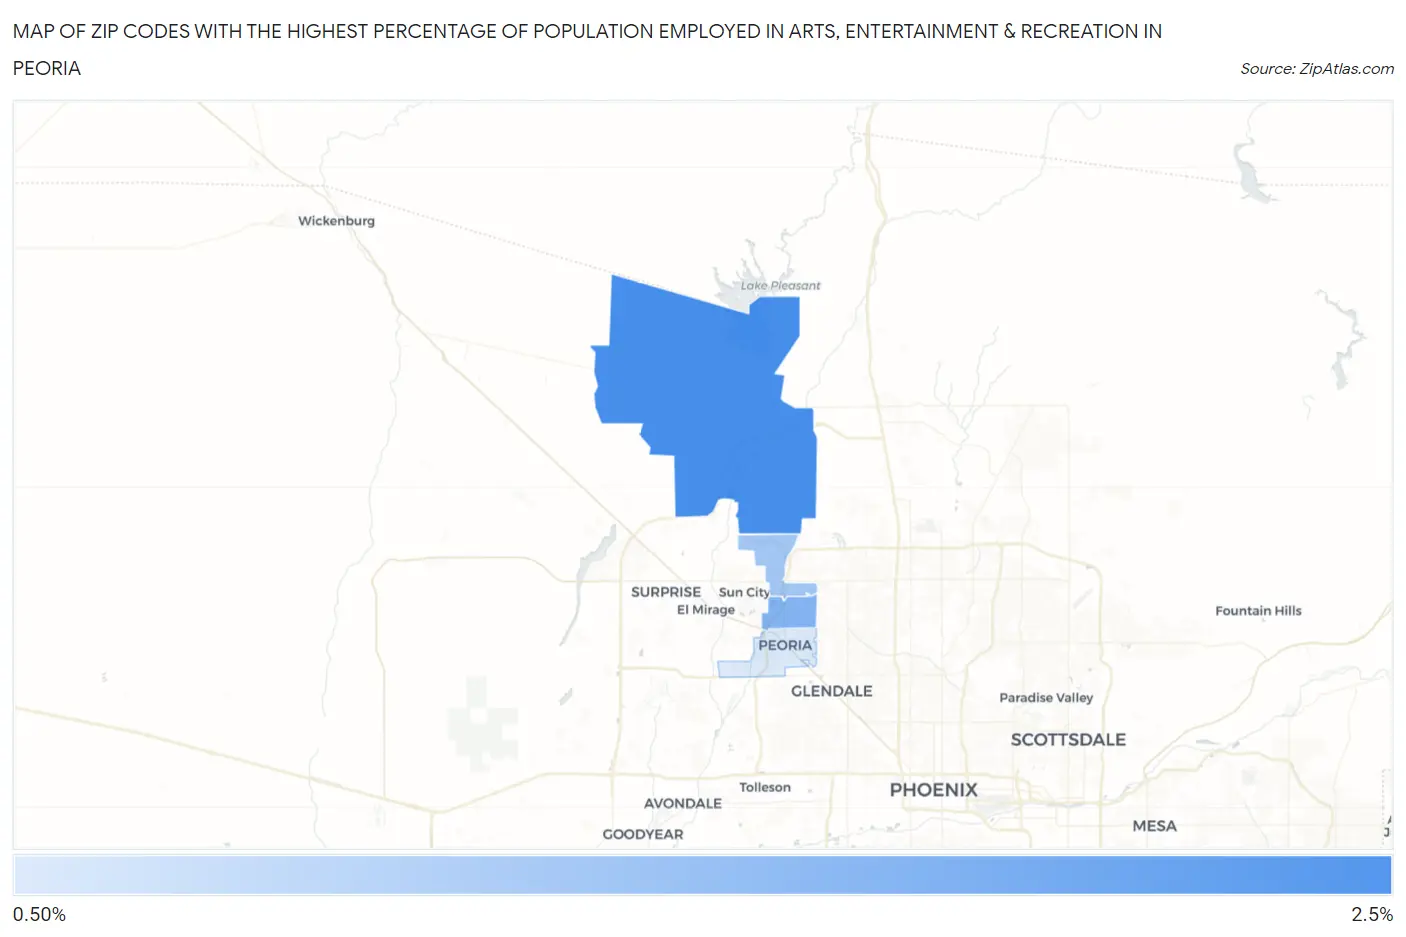
Map of Zip Codes with the Highest Percentage of Population Employed in Arts, Entertainment & Recreation in Peoria
0.0%
2.5%
Zip Codes with the Highest Percentage of Population Employed in Arts, Entertainment & Recreation in Peoria, AZ
| Zip Code | % Employed | vs State | vs National | |
| 1. | 85383 | 2.4% | 2.3%(+0.058)#149 | 2.1%(+0.286)#7,795 |
| 2. | 85381 | 1.9% | 2.3%(-0.375)#196 | 2.1%(-0.148)#10,157 |
| 3. | 85382 | 1.7% | 2.3%(-0.591)#214 | 2.1%(-0.363)#11,593 |
| 4. | 85345 | 1.3% | 2.3%(-0.990)#259 | 2.1%(-0.762)#14,571 |
1
Common Questions
What are the Top 3 Zip Codes with the Highest Percentage of Population Employed in Arts, Entertainment & Recreation in Peoria, AZ?
Top 3 Zip Codes with the Highest Percentage of Population Employed in Arts, Entertainment & Recreation in Peoria, AZ are:
What zip code has the Highest Percentage of Population Employed in Arts, Entertainment & Recreation in Peoria, AZ?
85383 has the Highest Percentage of Population Employed in Arts, Entertainment & Recreation in Peoria, AZ with 2.4%.
What is the Percentage of Population Employed in Arts, Entertainment & Recreation in Peoria, AZ?
Percentage of Population Employed in Arts, Entertainment & Recreation in Peoria is 2.0%.
What is the Percentage of Population Employed in Arts, Entertainment & Recreation in Arizona?
Percentage of Population Employed in Arts, Entertainment & Recreation in Arizona is 2.3%.
What is the Percentage of Population Employed in Arts, Entertainment & Recreation in the United States?
Percentage of Population Employed in Arts, Entertainment & Recreation in the United States is 2.1%.