Zip Codes with the Highest Percentage of Population with a Degree in Visual and Performing Arts in Chandler, AZ
RELATED REPORTS & OPTIONS
Visual and Performing Arts
Chandler
Compare Zip Codes
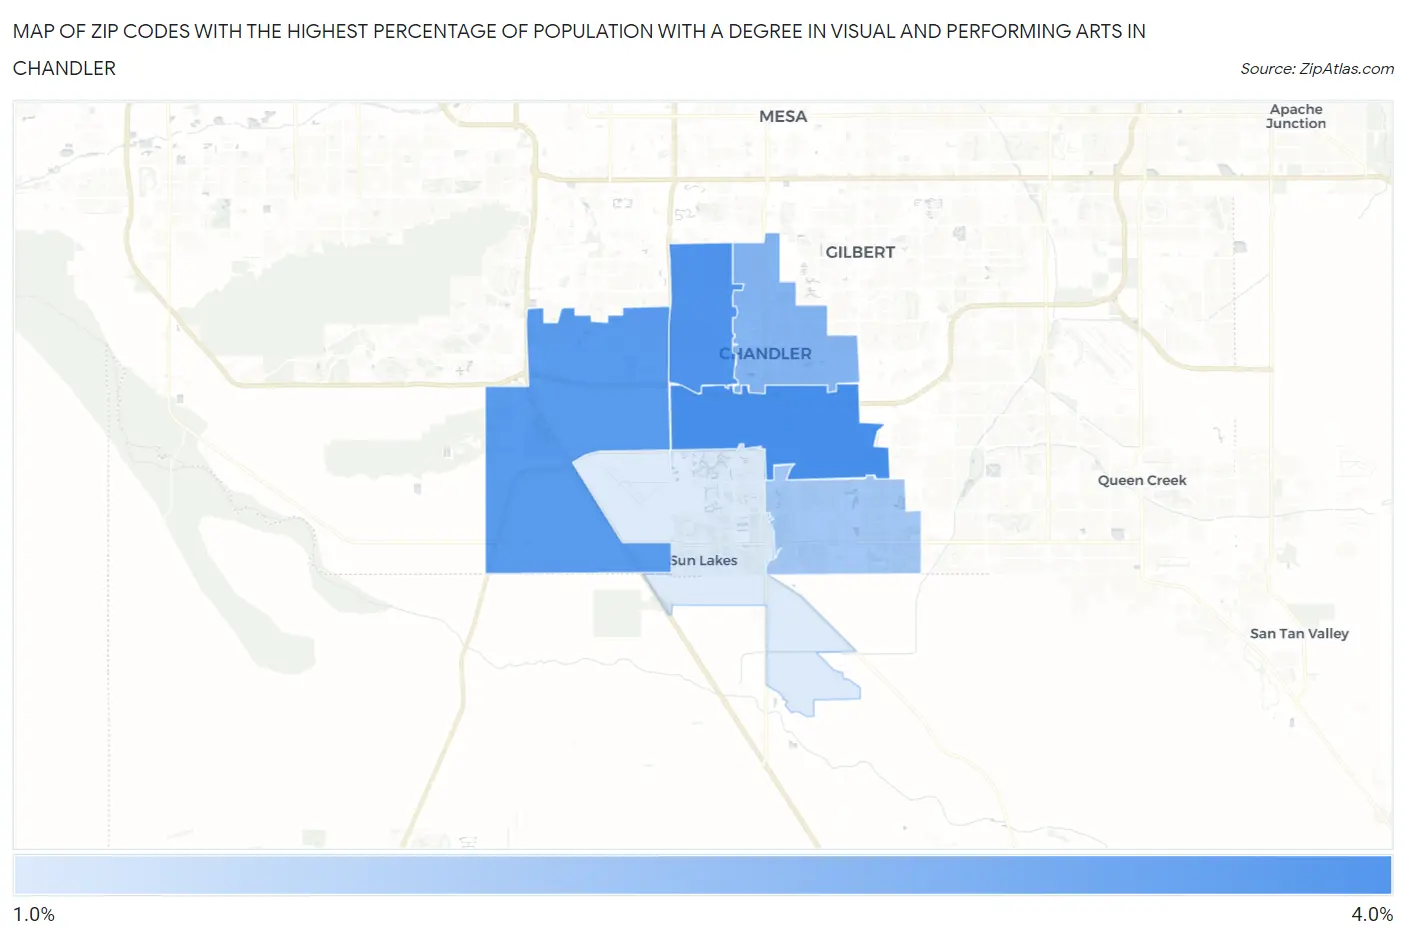
Map of Zip Codes with the Highest Percentage of Population with a Degree in Visual and Performing Arts in Chandler
1.7%
3.0%
Zip Codes with the Highest Percentage of Population with a Degree in Visual and Performing Arts in Chandler, AZ
| Zip Code | % Graduates | vs State | vs National | |
| 1. | 85286 | 3.0% | 3.6%(-0.530)#165 | 4.3%(-1.21)#12,566 |
| 2. | 85224 | 3.0% | 3.6%(-0.605)#175 | 4.3%(-1.28)#12,840 |
| 3. | 85226 | 2.9% | 3.6%(-0.671)#178 | 4.3%(-1.35)#13,091 |
| 4. | 85225 | 2.5% | 3.6%(-1.07)#201 | 4.3%(-1.75)#14,590 |
| 5. | 85249 | 2.2% | 3.6%(-1.35)#215 | 4.3%(-2.03)#15,625 |
| 6. | 85248 | 1.7% | 3.6%(-1.88)#239 | 4.3%(-2.55)#17,493 |
1
Common Questions
What are the Top 5 Zip Codes with the Highest Percentage of Population with a Degree in Visual and Performing Arts in Chandler, AZ?
Top 5 Zip Codes with the Highest Percentage of Population with a Degree in Visual and Performing Arts in Chandler, AZ are:
What zip code has the Highest Percentage of Population with a Degree in Visual and Performing Arts in Chandler, AZ?
85286 has the Highest Percentage of Population with a Degree in Visual and Performing Arts in Chandler, AZ with 3.0%.
What is the Percentage of Population with a Degree in Visual and Performing Arts in Chandler, AZ?
Percentage of Population with a Degree in Visual and Performing Arts in Chandler is 2.6%.
What is the Percentage of Population with a Degree in Visual and Performing Arts in Arizona?
Percentage of Population with a Degree in Visual and Performing Arts in Arizona is 3.6%.
What is the Percentage of Population with a Degree in Visual and Performing Arts in the United States?
Percentage of Population with a Degree in Visual and Performing Arts in the United States is 4.3%.