Zip Codes with the Highest Percentage of Population Employed in Farming, Fishing & Forestry in Fort Smith, AR
RELATED REPORTS & OPTIONS
Farming, Fishing & Forestry
Fort Smith
Compare Zip Codes
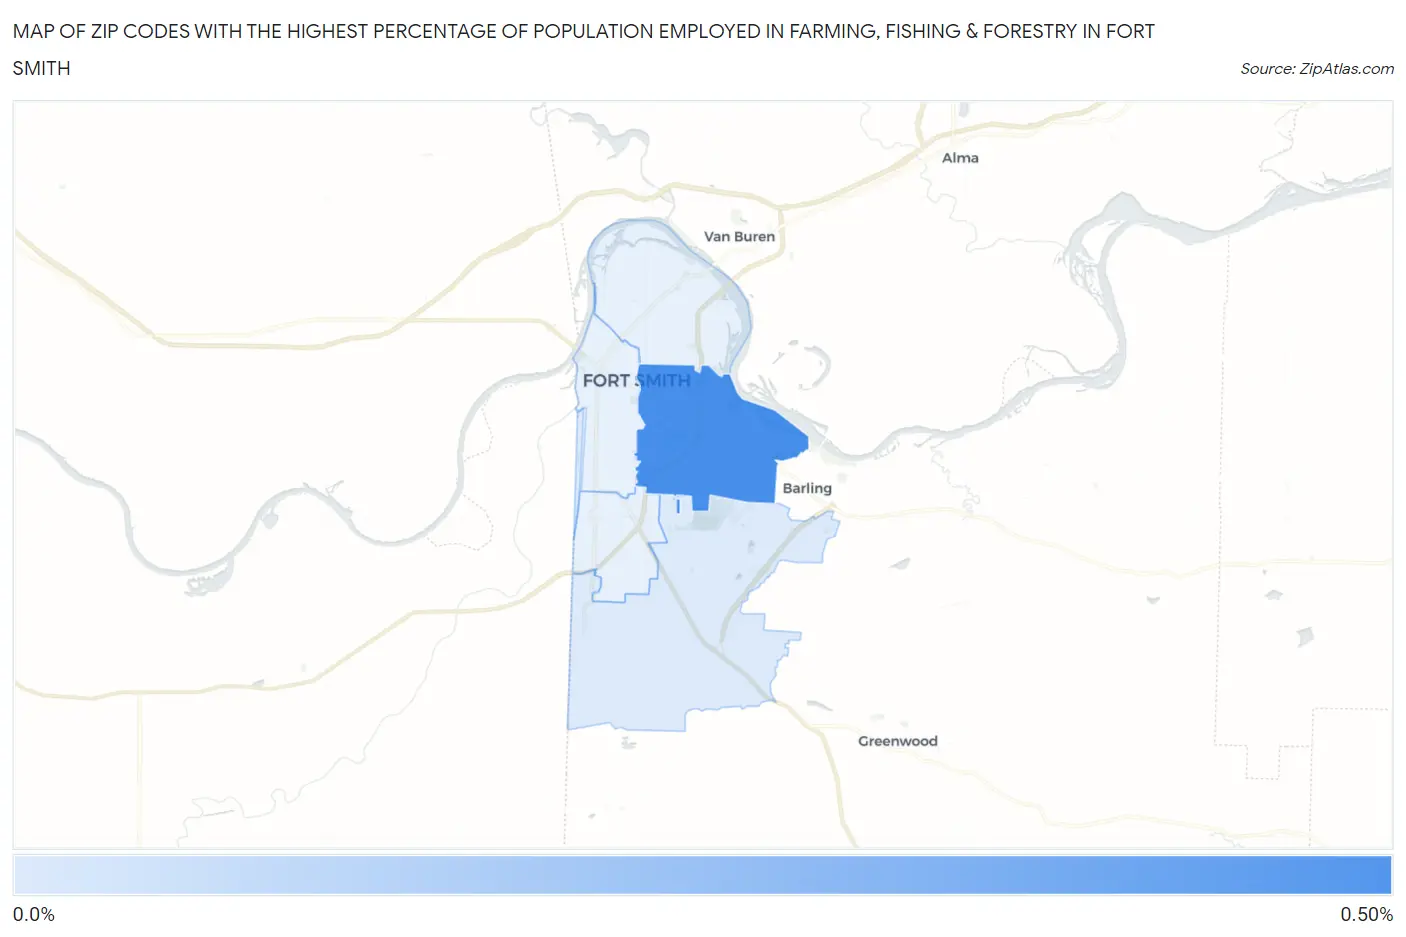
Map of Zip Codes with the Highest Percentage of Population Employed in Farming, Fishing & Forestry in Fort Smith
0.038%
0.50%
Zip Codes with the Highest Percentage of Population Employed in Farming, Fishing & Forestry in Fort Smith, AR
| Zip Code | % Employed | vs State | vs National | |
| 1. | 72903 | 0.50% | 0.96%(-0.462)#286 | 0.61%(-0.110)#12,879 |
| 2. | 72916 | 0.038% | 0.96%(-0.920)#348 | 0.61%(-0.568)#18,847 |
1
Common Questions
What are the Top 3 Zip Codes with the Highest Percentage of Population Employed in Farming, Fishing & Forestry in Fort Smith, AR?
Top 3 Zip Codes with the Highest Percentage of Population Employed in Farming, Fishing & Forestry in Fort Smith, AR are:
What zip code has the Highest Percentage of Population Employed in Farming, Fishing & Forestry in Fort Smith, AR?
72903 has the Highest Percentage of Population Employed in Farming, Fishing & Forestry in Fort Smith, AR with 0.50%.
What is the Percentage of Population Employed in Farming, Fishing & Forestry in Fort Smith, AR?
Percentage of Population Employed in Farming, Fishing & Forestry in Fort Smith is 0.15%.
What is the Percentage of Population Employed in Farming, Fishing & Forestry in Arkansas?
Percentage of Population Employed in Farming, Fishing & Forestry in Arkansas is 0.96%.
What is the Percentage of Population Employed in Farming, Fishing & Forestry in the United States?
Percentage of Population Employed in Farming, Fishing & Forestry in the United States is 0.61%.