Zip Codes with the Highest Percentage of Population Employed in Food Preparation & Serving in Decatur, AL
RELATED REPORTS & OPTIONS
Food Preparation & Serving
Decatur
Compare Zip Codes
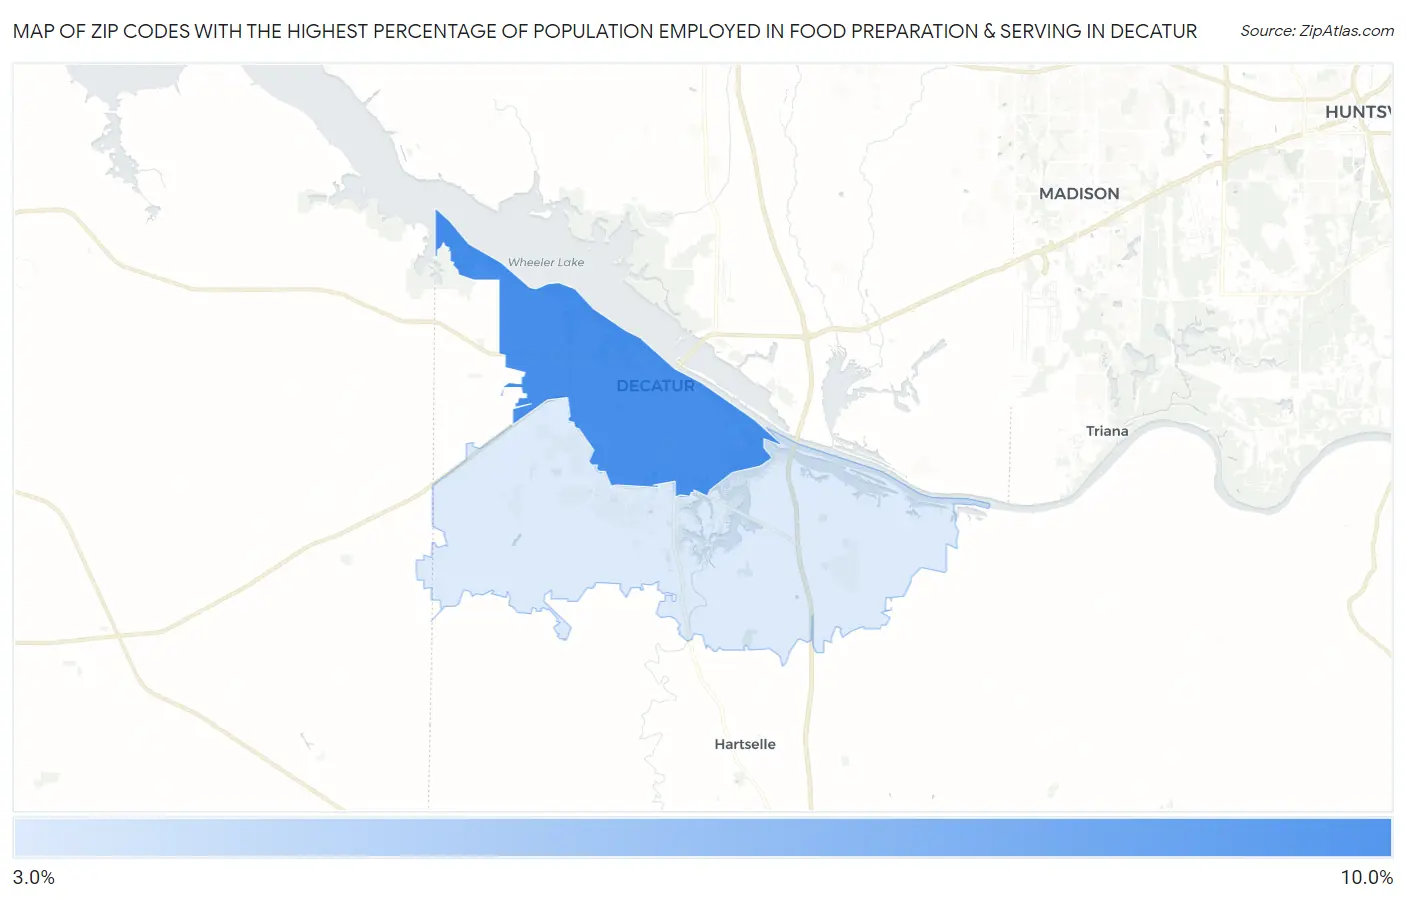
Map of Zip Codes with the Highest Percentage of Population Employed in Food Preparation & Serving in Decatur
4.0%
8.5%
Zip Codes with the Highest Percentage of Population Employed in Food Preparation & Serving in Decatur, AL
| Zip Code | % Employed | vs State | vs National | |
| 1. | 35601 | 8.5% | 5.2%(+3.32)#83 | 5.3%(+3.23)#4,050 |
| 2. | 35603 | 4.0% | 5.2%(-1.20)#323 | 5.3%(-1.29)#17,143 |
1
Common Questions
What are the Top Zip Codes with the Highest Percentage of Population Employed in Food Preparation & Serving in Decatur, AL?
Top Zip Codes with the Highest Percentage of Population Employed in Food Preparation & Serving in Decatur, AL are:
What zip code has the Highest Percentage of Population Employed in Food Preparation & Serving in Decatur, AL?
35601 has the Highest Percentage of Population Employed in Food Preparation & Serving in Decatur, AL with 8.5%.
What is the Percentage of Population Employed in Food Preparation & Serving in Decatur, AL?
Percentage of Population Employed in Food Preparation & Serving in Decatur is 6.6%.
What is the Percentage of Population Employed in Food Preparation & Serving in Alabama?
Percentage of Population Employed in Food Preparation & Serving in Alabama is 5.2%.
What is the Percentage of Population Employed in Food Preparation & Serving in the United States?
Percentage of Population Employed in Food Preparation & Serving in the United States is 5.3%.