Zip Codes with the Highest Percentage of Population Employed in Food Preparation & Serving in Daphne, AL
RELATED REPORTS & OPTIONS
Food Preparation & Serving
Daphne
Compare Zip Codes
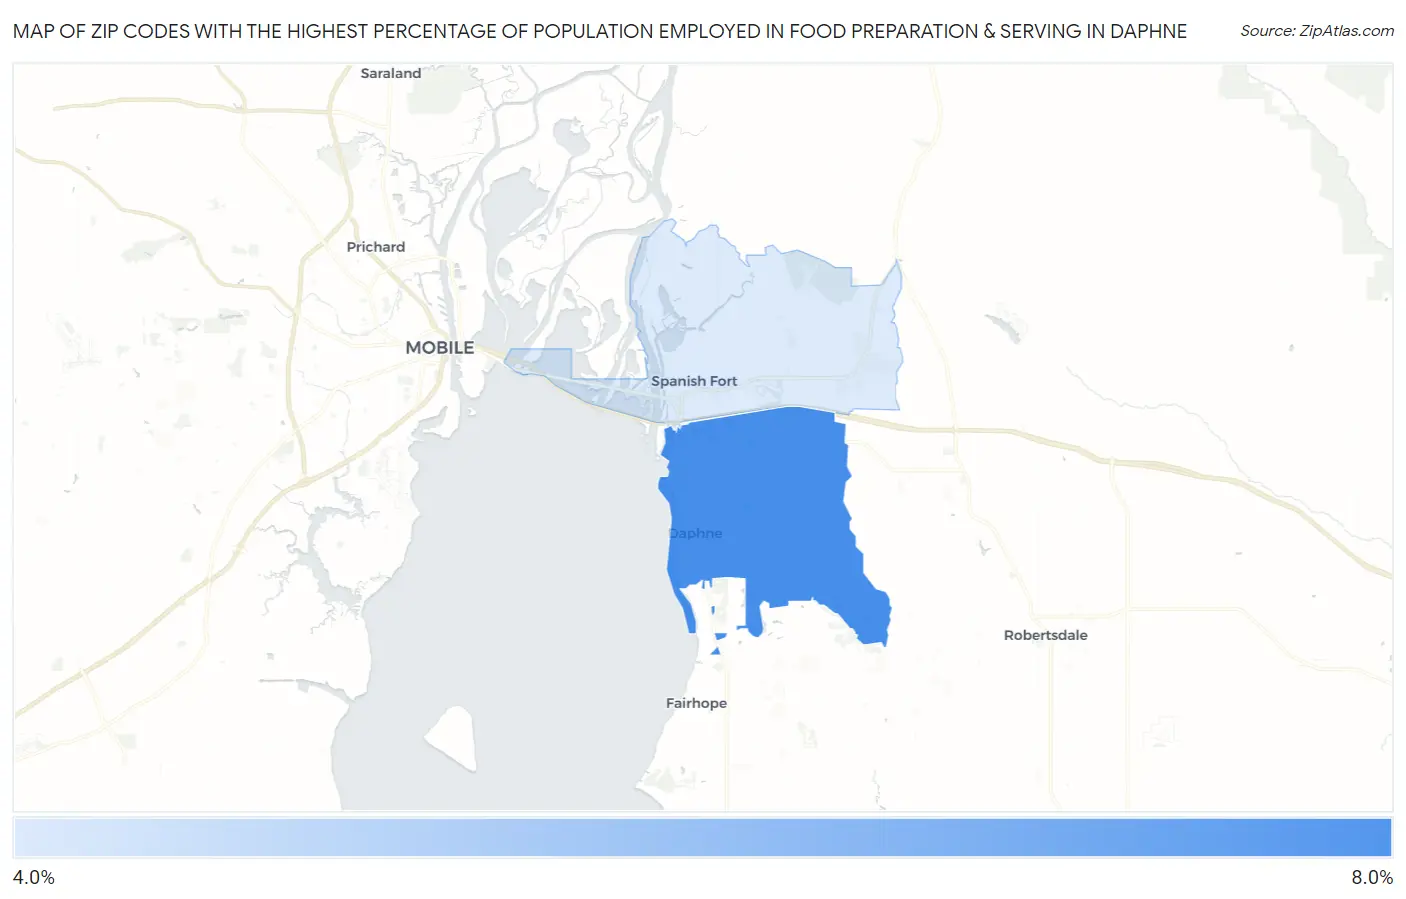
Map of Zip Codes with the Highest Percentage of Population Employed in Food Preparation & Serving in Daphne
4.9%
6.6%
Zip Codes with the Highest Percentage of Population Employed in Food Preparation & Serving in Daphne, AL
| Zip Code | % Employed | vs State | vs National | |
| 1. | 36526 | 6.6% | 5.2%(+1.35)#153 | 5.3%(+1.27)#7,717 |
| 2. | 36527 | 4.9% | 5.2%(-0.339)#262 | 5.3%(-0.425)#13,513 |
1
Common Questions
What are the Top Zip Codes with the Highest Percentage of Population Employed in Food Preparation & Serving in Daphne, AL?
Top Zip Codes with the Highest Percentage of Population Employed in Food Preparation & Serving in Daphne, AL are:
What zip code has the Highest Percentage of Population Employed in Food Preparation & Serving in Daphne, AL?
36526 has the Highest Percentage of Population Employed in Food Preparation & Serving in Daphne, AL with 6.6%.
What is the Percentage of Population Employed in Food Preparation & Serving in Daphne, AL?
Percentage of Population Employed in Food Preparation & Serving in Daphne is 7.9%.
What is the Percentage of Population Employed in Food Preparation & Serving in Alabama?
Percentage of Population Employed in Food Preparation & Serving in Alabama is 5.2%.
What is the Percentage of Population Employed in Food Preparation & Serving in the United States?
Percentage of Population Employed in Food Preparation & Serving in the United States is 5.3%.