Zip Codes with the Highest Percentage of Population Employed in Food Preparation & Serving in Bessemer, AL
RELATED REPORTS & OPTIONS
Food Preparation & Serving
Bessemer
Compare Zip Codes
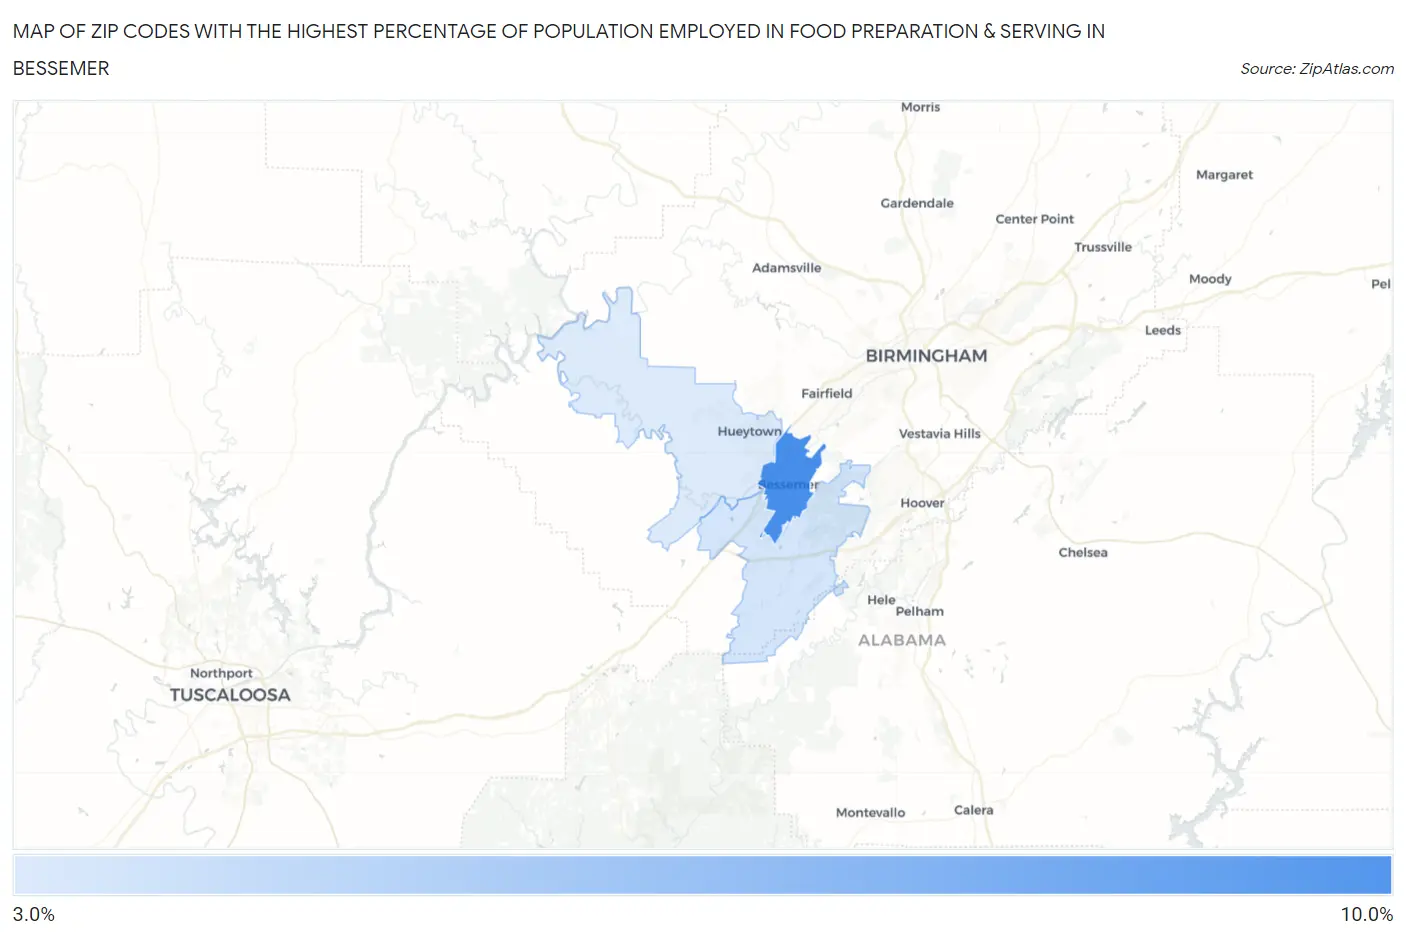
Map of Zip Codes with the Highest Percentage of Population Employed in Food Preparation & Serving in Bessemer
3.2%
9.8%
Zip Codes with the Highest Percentage of Population Employed in Food Preparation & Serving in Bessemer, AL
| Zip Code | % Employed | vs State | vs National | |
| 1. | 35020 | 9.8% | 5.2%(+4.62)#52 | 5.3%(+4.53)#2,784 |
| 2. | 35022 | 3.6% | 5.2%(-1.57)#347 | 5.3%(-1.66)#18,644 |
| 3. | 35023 | 3.2% | 5.2%(-1.95)#368 | 5.3%(-2.04)#20,287 |
1
Common Questions
What are the Top Zip Codes with the Highest Percentage of Population Employed in Food Preparation & Serving in Bessemer, AL?
Top Zip Codes with the Highest Percentage of Population Employed in Food Preparation & Serving in Bessemer, AL are:
What zip code has the Highest Percentage of Population Employed in Food Preparation & Serving in Bessemer, AL?
35020 has the Highest Percentage of Population Employed in Food Preparation & Serving in Bessemer, AL with 9.8%.
What is the Percentage of Population Employed in Food Preparation & Serving in Bessemer, AL?
Percentage of Population Employed in Food Preparation & Serving in Bessemer is 9.8%.
What is the Percentage of Population Employed in Food Preparation & Serving in Alabama?
Percentage of Population Employed in Food Preparation & Serving in Alabama is 5.2%.
What is the Percentage of Population Employed in Food Preparation & Serving in the United States?
Percentage of Population Employed in Food Preparation & Serving in the United States is 5.3%.