Zip Codes with the Highest Percentage of Population Employed in Food Preparation & Serving in Northport, AL
RELATED REPORTS & OPTIONS
Food Preparation & Serving
Northport
Compare Zip Codes
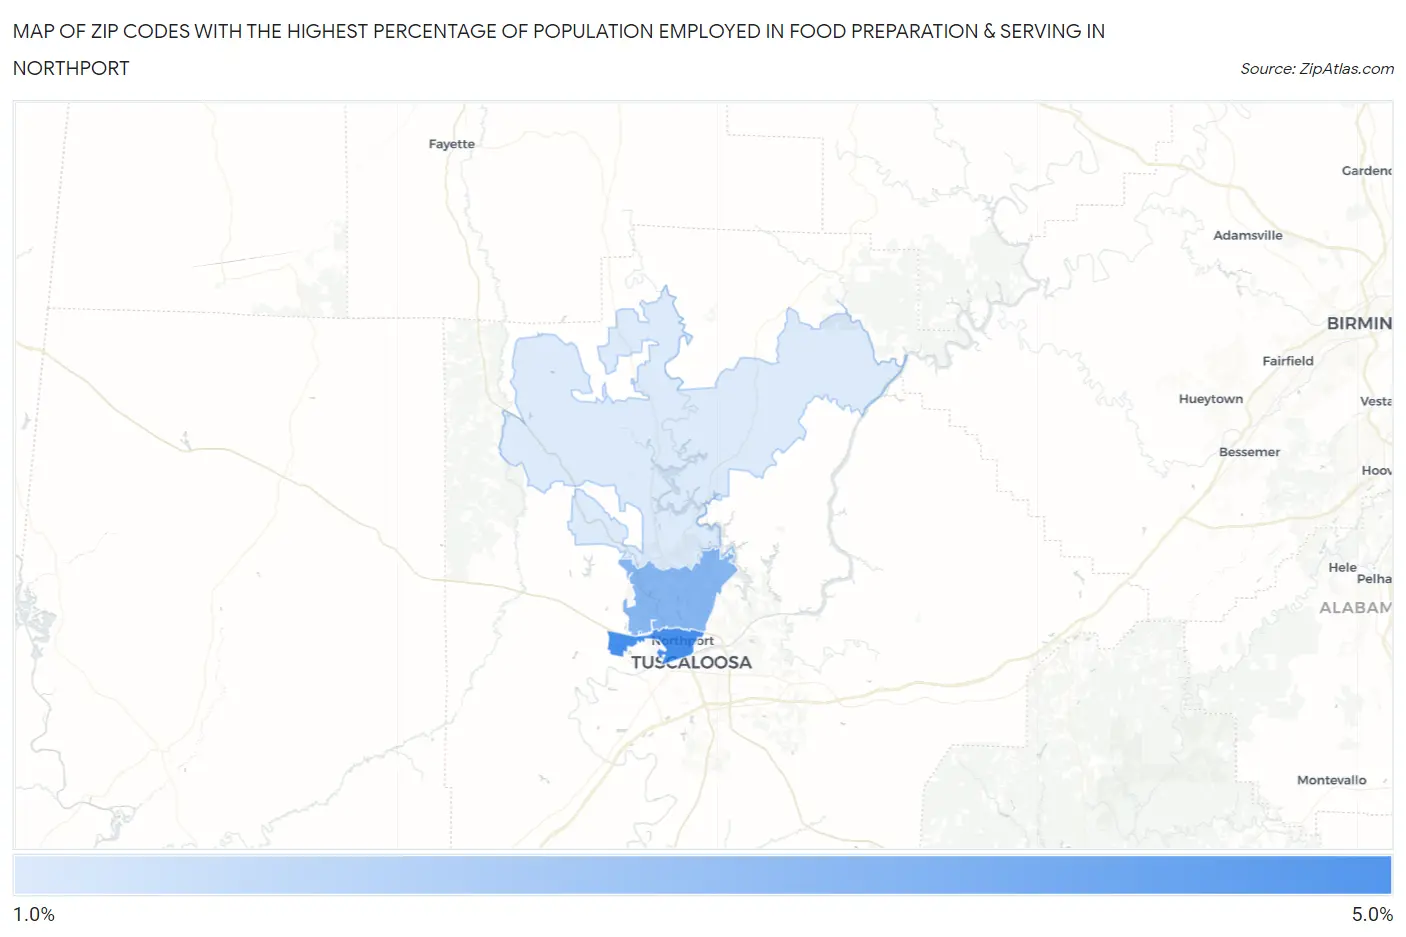
Map of Zip Codes with the Highest Percentage of Population Employed in Food Preparation & Serving in Northport
1.3%
4.1%
Zip Codes with the Highest Percentage of Population Employed in Food Preparation & Serving in Northport, AL
| Zip Code | % Employed | vs State | vs National | |
| 1. | 35476 | 4.1% | 5.2%(-1.06)#308 | 5.3%(-1.14)#16,527 |
| 2. | 35473 | 2.9% | 5.2%(-2.30)#398 | 5.3%(-2.39)#21,658 |
| 3. | 35475 | 1.3% | 5.2%(-3.94)#500 | 5.3%(-4.02)#26,477 |
1
Common Questions
What are the Top Zip Codes with the Highest Percentage of Population Employed in Food Preparation & Serving in Northport, AL?
Top Zip Codes with the Highest Percentage of Population Employed in Food Preparation & Serving in Northport, AL are:
What zip code has the Highest Percentage of Population Employed in Food Preparation & Serving in Northport, AL?
35476 has the Highest Percentage of Population Employed in Food Preparation & Serving in Northport, AL with 4.1%.
What is the Percentage of Population Employed in Food Preparation & Serving in Northport, AL?
Percentage of Population Employed in Food Preparation & Serving in Northport is 2.7%.
What is the Percentage of Population Employed in Food Preparation & Serving in Alabama?
Percentage of Population Employed in Food Preparation & Serving in Alabama is 5.2%.
What is the Percentage of Population Employed in Food Preparation & Serving in the United States?
Percentage of Population Employed in Food Preparation & Serving in the United States is 5.3%.