Zip Codes with the Highest Percentage of Population Employed in Arts, Entertainment & Recreation in Milwaukee, WI

RELATED REPORTS & OPTIONS

Arts, Entertainment & Recreation
Population
Families and Households
Female Fertility
Female Fertility (Unmarried)
Race (Community Size)
Race (Percentage)
Ancestry (Community Size)
AfricanAlaska NativeAlaskan AthabascanAlbanianAleutAlsatianAmericanApacheArabArgentineanArmenianAssyrian / Chaldean / SyriacAustralianAustrianBahamianBangladeshiBarbadianBelgianBelizeanBhutaneseBlackfeetBolivianBrazilianBritishBritish West IndianBulgarianBurmeseCanadianCape VerdeanCarpatho RusynCelticCentral AmericanCentral American IndianCherokeeCheyenneChickasawChileanChippewaChoctawColombianCosta RicanCreekCroatianCrowCubanCzechCzechoslovakianDanishDominicanDutchEastern EuropeanEcuadorianEgyptianEnglishEstonianEthiopianEuropeanFilipinoFinnishFrenchFrench American IndianFrench CanadianGermanGerman RussianGhanaianGreekGuamanian / ChamorroGuatemalanHaitianHonduranHungarianIcelanderIndian (Asian)IndonesianIranianIraqiIrishIroquoisIsraeliItalianJamaicanJapaneseJordanianKenyanKoreanLaotianLatvianLebaneseLithuanianLuxembourgerMacedonianMalaysianMenomineeMexicanMexican American IndianMongolianMoroccanNative HawaiianNavajoNicaraguanNigerianNorthern EuropeanNorwegianOttawaPakistaniPalestinianPanamanianParaguayanPennsylvania GermanPeruvianPimaPolishPortuguesePotawatomiPuerto RicanRomanianRussianSalvadoranSamoanScandinavianScotch-IrishScottishSeminoleSenegaleseSerbianSiouxSlavicSlovakSloveneSomaliSouth AfricanSouth AmericanSouth American IndianSpaniardSpanishSri LankanSubsaharan AfricanSwedishSwissSyrianThaiTonganTrinidadian and TobagonianTurkishUgandanUkrainianVenezuelanVietnameseWelshWest IndianYugoslavian
Ancestry (Percentage)
AfricanAlaska NativeAlaskan AthabascanAlbanianAleutAlsatianAmericanApacheArabArgentineanArmenianAssyrian / Chaldean / SyriacAustralianAustrianBahamianBangladeshiBarbadianBelgianBelizeanBhutaneseBlackfeetBolivianBrazilianBritishBritish West IndianBulgarianBurmeseCanadianCape VerdeanCarpatho RusynCelticCentral AmericanCentral American IndianCherokeeCheyenneChickasawChileanChippewaChoctawColombianCosta RicanCreekCroatianCrowCubanCzechCzechoslovakianDanishDominicanDutchEastern EuropeanEcuadorianEgyptianEnglishEstonianEthiopianEuropeanFilipinoFinnishFrenchFrench American IndianFrench CanadianGermanGerman RussianGhanaianGreekGuamanian / ChamorroGuatemalanHaitianHonduranHungarianIcelanderIndian (Asian)IndonesianIranianIraqiIrishIroquoisIsraeliItalianJamaicanJapaneseJordanianKenyanKoreanLaotianLatvianLebaneseLithuanianLuxembourgerMacedonianMalaysianMenomineeMexicanMexican American IndianMongolianMoroccanNative HawaiianNavajoNicaraguanNigerianNorthern EuropeanNorwegianOttawaPakistaniPalestinianPanamanianParaguayanPennsylvania GermanPeruvianPimaPolishPortuguesePotawatomiPuerto RicanRomanianRussianSalvadoranSamoanScandinavianScotch-IrishScottishSeminoleSenegaleseSerbianSiouxSlavicSlovakSloveneSomaliSouth AfricanSouth AmericanSouth American IndianSpaniardSpanishSri LankanSubsaharan AfricanSwedishSwissSyrianThaiTonganTrinidadian and TobagonianTurkishUgandanUkrainianVenezuelanVietnameseWelshWest IndianYugoslavian
Immigrant Origin (Total)
AfricaAlbaniaArgentinaAsiaAustraliaAustriaBangladeshBelarusBelgiumBelizeBoliviaBosnia and HerzegovinaBrazilBulgariaBurma / MyanmarCambodiaCameroonCanadaCaribbeanCentral AmericaChileChinaColombiaCongoCosta RicaCroatiaCubaCzechoslovakiaDominicaDominican RepublicEastern AfricaEastern AsiaEastern EuropeEcuadorEgyptEl SalvadorEnglandEritreaEthiopiaEuropeFranceGermanyGhanaGreeceGuatemalaHaitiHondurasHong KongHungaryIndiaIndonesiaIranIraqIrelandIsraelItalyJamaicaJapanJordanKazakhstanKenyaKoreaKuwaitLaosLatin AmericaLatviaLebanonLiberiaLithuaniaMalaysiaMexicoMiddle AfricaMoroccoNepalNetherlandsNicaraguaNigeriaNorthern AfricaNorthern EuropeOceaniaPakistanPanamaPeruPhilippinesPolandRomaniaRussiaSaudi ArabiaScotlandSenegalSerbiaSierra LeoneSingaporeSomaliaSouth AfricaSouth AmericaSouth Central AsiaSouth Eastern AsiaSouthern EuropeSpainSwedenTaiwanThailandTrinidad and TobagoTurkeyUgandaUkraineUzbekistanVenezuelaVietnamWestern AfricaWestern AsiaWestern EuropeZaire
Immigrant Origin (Percentage)
AfricaAlbaniaArgentinaAsiaAustraliaAustriaBangladeshBelarusBelgiumBelizeBoliviaBosnia and HerzegovinaBrazilBulgariaBurma / MyanmarCambodiaCameroonCanadaCaribbeanCentral AmericaChileChinaColombiaCongoCosta RicaCroatiaCubaCzechoslovakiaDominicaDominican RepublicEastern AfricaEastern AsiaEastern EuropeEcuadorEgyptEl SalvadorEnglandEritreaEthiopiaEuropeFranceGermanyGhanaGreeceGuatemalaHaitiHondurasHong KongHungaryIndiaIndonesiaIranIraqIrelandIsraelItalyJamaicaJapanJordanKazakhstanKenyaKoreaKuwaitLaosLatin AmericaLatviaLebanonLiberiaLithuaniaMalaysiaMexicoMiddle AfricaMoroccoNepalNetherlandsNicaraguaNigeriaNorthern AfricaNorthern EuropeOceaniaPakistanPanamaPeruPhilippinesPolandRomaniaRussiaSaudi ArabiaScotlandSenegalSerbiaSierra LeoneSingaporeSomaliaSouth AfricaSouth AmericaSouth Central AsiaSouth Eastern AsiaSouthern EuropeSpainSwedenTaiwanThailandTrinidad and TobagoTurkeyUgandaUkraineUzbekistanVenezuelaVietnamWestern AfricaWestern AsiaWestern EuropeZaire
Income
Income (Families)
Income (Households)
Poverty
Poverty (Families)
Unemployment
Employment Occupations
Employment Industries
Employer Class
Commute Time
Commute Means
School Enrollment
Education by Degree Field
Occupancy
Finances
Physical Characteristics
Milwaukee
Compare Zip Codes
Comparison Subject

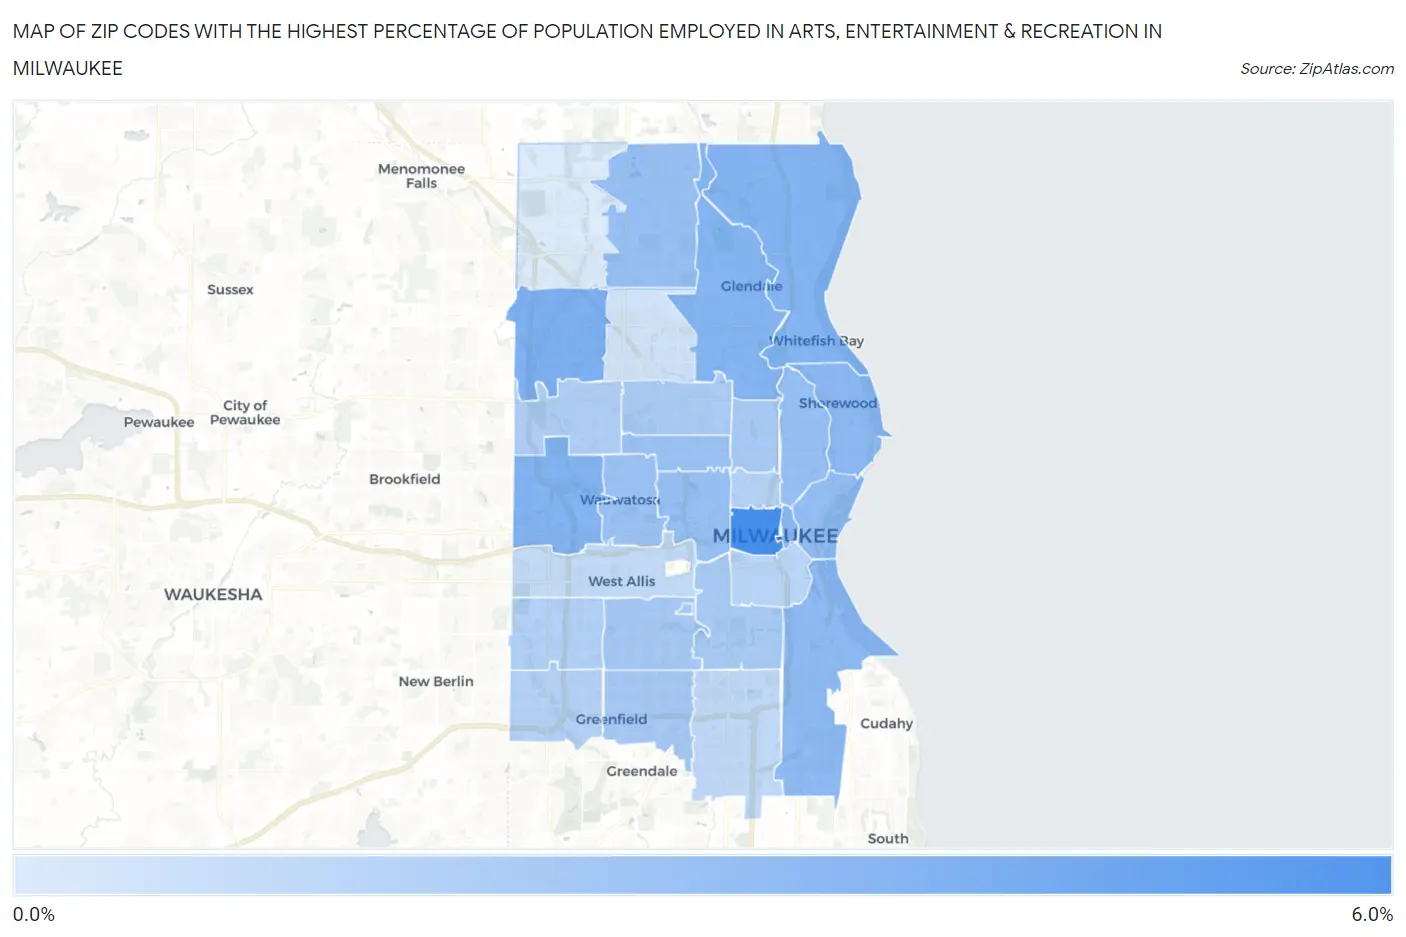
Map of Zip Codes with the Highest Percentage of Population Employed in Arts, Entertainment & Recreation in Milwaukee

0.0%
6.0%
Zip Codes with the Highest Percentage of Population Employed in Arts, Entertainment & Recreation in Milwaukee Map

Zip Codes with the Highest Percentage of Population Employed in Arts, Entertainment & Recreation in Milwaukee, WI

Zip Code % Employed vs State vs National
1.532335.1%1.7%(+3.43)#442.1%(+3.02)#2,211
2.532253.3%1.7%(+1.60)#902.1%(+1.20)#4,608
3.532263.1%1.7%(+1.41)#962.1%(+1.01)#5,095
4.532173.1%1.7%(+1.38)#982.1%(+0.977)#5,196
5.532093.0%1.7%(+1.34)#1012.1%(+0.938)#5,302
6.532032.9%1.7%(+1.25)#1062.1%(+0.844)#5,575
7.532112.8%1.7%(+1.08)#1142.1%(+0.675)#6,153
8.532072.7%1.7%(+1.01)#1182.1%(+0.603)#6,410
9.532022.6%1.7%(+0.893)#1292.1%(+0.489)#6,865
10.532232.4%1.7%(+0.715)#1402.1%(+0.311)#7,668
11.532082.4%1.7%(+0.701)#1442.1%(+0.297)#7,745
12.532122.4%1.7%(+0.700)#1462.1%(+0.296)#7,750
13.532102.3%1.7%(+0.664)#1492.1%(+0.260)#7,914
14.532132.3%1.7%(+0.655)#1512.1%(+0.251)#7,964
15.532192.0%1.7%(+0.316)#1932.1%(-0.088)#9,816
16.532202.0%1.7%(+0.297)#1982.1%(-0.107)#9,915
17.532061.9%1.7%(+0.223)#2092.1%(-0.181)#10,372
18.532151.9%1.7%(+0.193)#2152.1%(-0.211)#10,542
19.532161.8%1.7%(+0.120)#2302.1%(-0.284)#11,021
20.532221.7%1.7%(-0.028)#2522.1%(-0.432)#12,077
21.532271.5%1.7%(-0.138)#2852.1%(-0.542)#12,954
22.532281.4%1.7%(-0.257)#3132.1%(-0.661)#13,805
23.532051.4%1.7%(-0.265)#3152.1%(-0.669)#13,871
24.532041.3%1.7%(-0.391)#3542.1%(-0.795)#14,809
25.532211.0%1.7%(-0.644)#4252.1%(-1.05)#16,693
26.532141.0%1.7%(-0.674)#4372.1%(-1.08)#16,921
27.532180.56%1.7%(-1.12)#5522.1%(-1.52)#20,094
28.532240.16%1.7%(-1.52)#6632.1%(-1.92)#22,358

Common Questions

What are the Top 10 Zip Codes with the Highest Percentage of Population Employed in Arts, Entertainment & Recreation in Milwaukee, WI?
Top 10 Zip Codes with the Highest Percentage of Population Employed in Arts, Entertainment & Recreation in Milwaukee, WI are:
#1
5.1%
#2
3.3%
#3
3.1%
#4
3.1%
#5
3.0%
#6
2.9%
#7
2.8%
#8
2.7%
#9
2.6%
#10
2.4%
What zip code has the Highest Percentage of Population Employed in Arts, Entertainment & Recreation in Milwaukee, WI?
53233 has the Highest Percentage of Population Employed in Arts, Entertainment & Recreation in Milwaukee, WI with 5.1%.
What is the Percentage of Population Employed in Arts, Entertainment & Recreation in Milwaukee, WI?
Percentage of Population Employed in Arts, Entertainment & Recreation in Milwaukee is 2.1%.
What is the Percentage of Population Employed in Arts, Entertainment & Recreation in Wisconsin?
Percentage of Population Employed in Arts, Entertainment & Recreation in Wisconsin is 1.7%.
What is the Percentage of Population Employed in Arts, Entertainment & Recreation in the United States?
Percentage of Population Employed in Arts, Entertainment & Recreation in the United States is 2.1%.