Zip Codes with the Highest Percentage of Population Employed in Administrative & Support Services in Woodinville, WA
RELATED REPORTS & OPTIONS
Administrative & Support Services
Woodinville
Compare Zip Codes
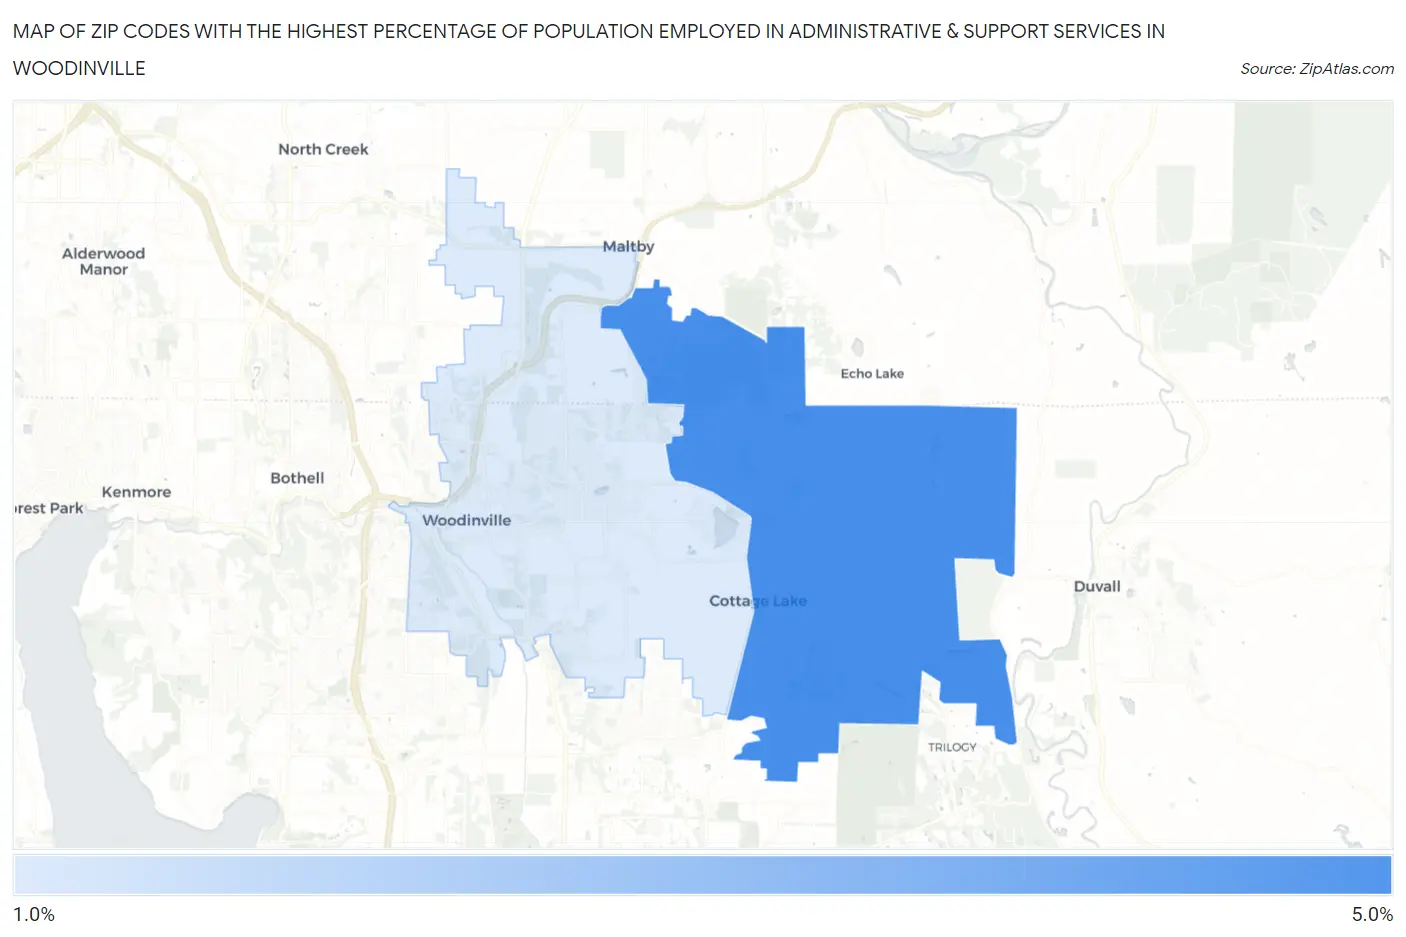
Map of Zip Codes with the Highest Percentage of Population Employed in Administrative & Support Services in Woodinville
2.0%
4.6%
Zip Codes with the Highest Percentage of Population Employed in Administrative & Support Services in Woodinville, WA
| Zip Code | % Employed | vs State | vs National | |
| 1. | 98077 | 4.6% | 3.8%(+0.878)#135 | 4.1%(+0.494)#8,216 |
| 2. | 98072 | 2.0% | 3.8%(-1.80)#408 | 4.1%(-2.19)#20,804 |
1
Common Questions
What are the Top Zip Codes with the Highest Percentage of Population Employed in Administrative & Support Services in Woodinville, WA?
Top Zip Codes with the Highest Percentage of Population Employed in Administrative & Support Services in Woodinville, WA are:
What zip code has the Highest Percentage of Population Employed in Administrative & Support Services in Woodinville, WA?
98077 has the Highest Percentage of Population Employed in Administrative & Support Services in Woodinville, WA with 4.6%.
What is the Percentage of Population Employed in Administrative & Support Services in Woodinville, WA?
Percentage of Population Employed in Administrative & Support Services in Woodinville is 1.2%.
What is the Percentage of Population Employed in Administrative & Support Services in Washington?
Percentage of Population Employed in Administrative & Support Services in Washington is 3.8%.
What is the Percentage of Population Employed in Administrative & Support Services in the United States?
Percentage of Population Employed in Administrative & Support Services in the United States is 4.1%.