Zip Codes with the Highest Percentage of Population Employed in Architecture & Engineering in Puyallup, WA
RELATED REPORTS & OPTIONS
Architecture & Engineering
Puyallup
Compare Zip Codes
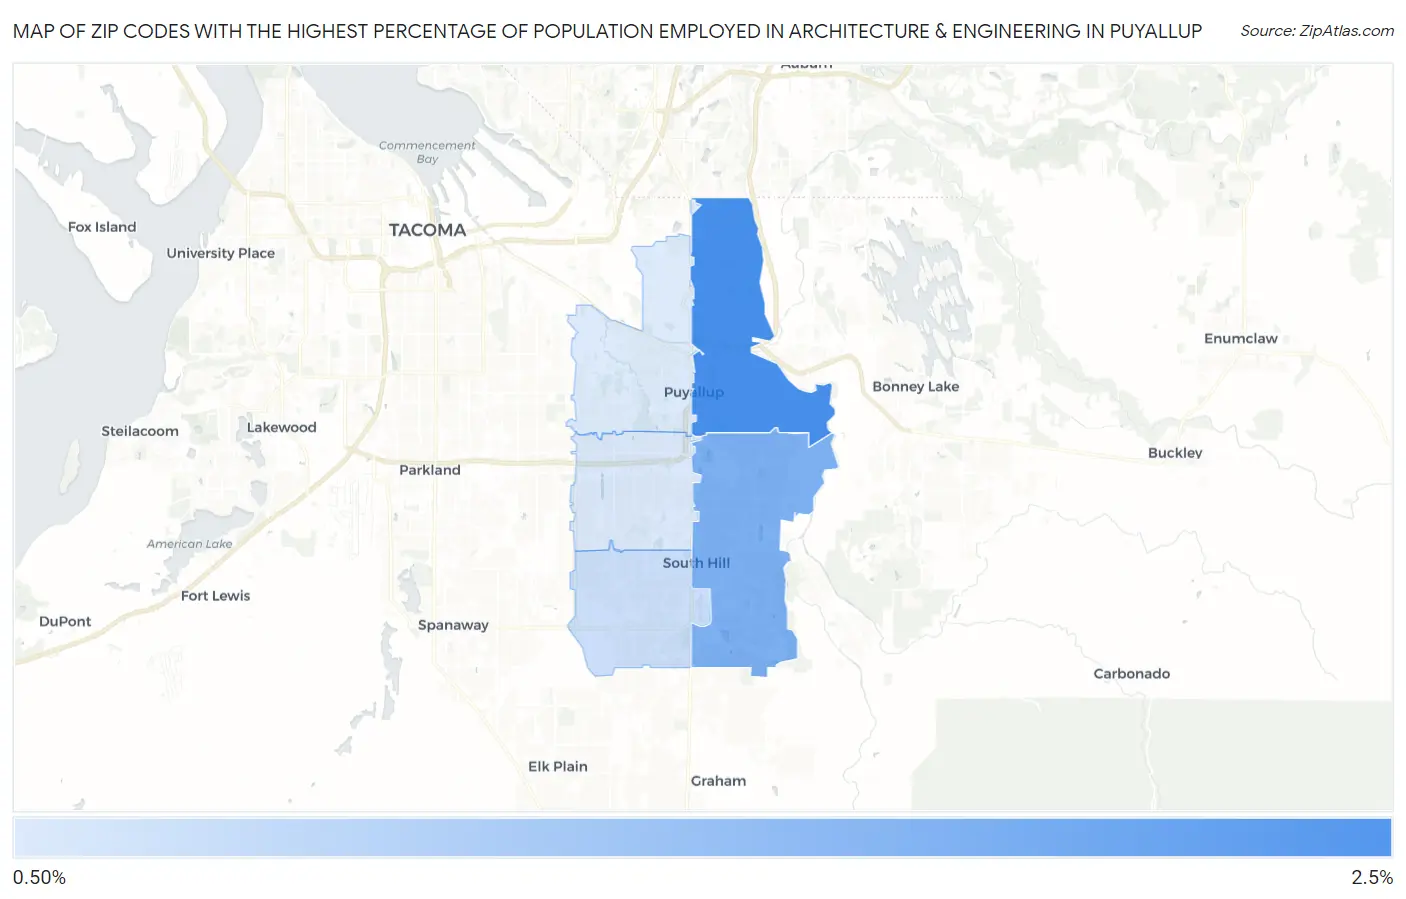
Map of Zip Codes with the Highest Percentage of Population Employed in Architecture & Engineering in Puyallup
0.77%
2.4%
Zip Codes with the Highest Percentage of Population Employed in Architecture & Engineering in Puyallup, WA
| Zip Code | % Employed | vs State | vs National | |
| 1. | 98372 | 2.4% | 2.8%(-0.430)#192 | 2.1%(+0.212)#7,665 |
| 2. | 98374 | 1.8% | 2.8%(-0.990)#252 | 2.1%(-0.348)#10,816 |
| 3. | 98375 | 0.97% | 2.8%(-1.82)#347 | 2.1%(-1.18)#16,836 |
| 4. | 98373 | 0.80% | 2.8%(-1.99)#362 | 2.1%(-1.35)#18,148 |
| 5. | 98371 | 0.77% | 2.8%(-2.02)#365 | 2.1%(-1.38)#18,381 |
1
Common Questions
What are the Top 3 Zip Codes with the Highest Percentage of Population Employed in Architecture & Engineering in Puyallup, WA?
Top 3 Zip Codes with the Highest Percentage of Population Employed in Architecture & Engineering in Puyallup, WA are:
What zip code has the Highest Percentage of Population Employed in Architecture & Engineering in Puyallup, WA?
98372 has the Highest Percentage of Population Employed in Architecture & Engineering in Puyallup, WA with 2.4%.
What is the Percentage of Population Employed in Architecture & Engineering in Puyallup, WA?
Percentage of Population Employed in Architecture & Engineering in Puyallup is 1.5%.
What is the Percentage of Population Employed in Architecture & Engineering in Washington?
Percentage of Population Employed in Architecture & Engineering in Washington is 2.8%.
What is the Percentage of Population Employed in Architecture & Engineering in the United States?
Percentage of Population Employed in Architecture & Engineering in the United States is 2.1%.