Zip Codes with the Highest Percentage of Population Employed in Installation, Maintenance & Repair in Puyallup, WA
RELATED REPORTS & OPTIONS
Installation, Maintenance & Repair
Puyallup
Compare Zip Codes
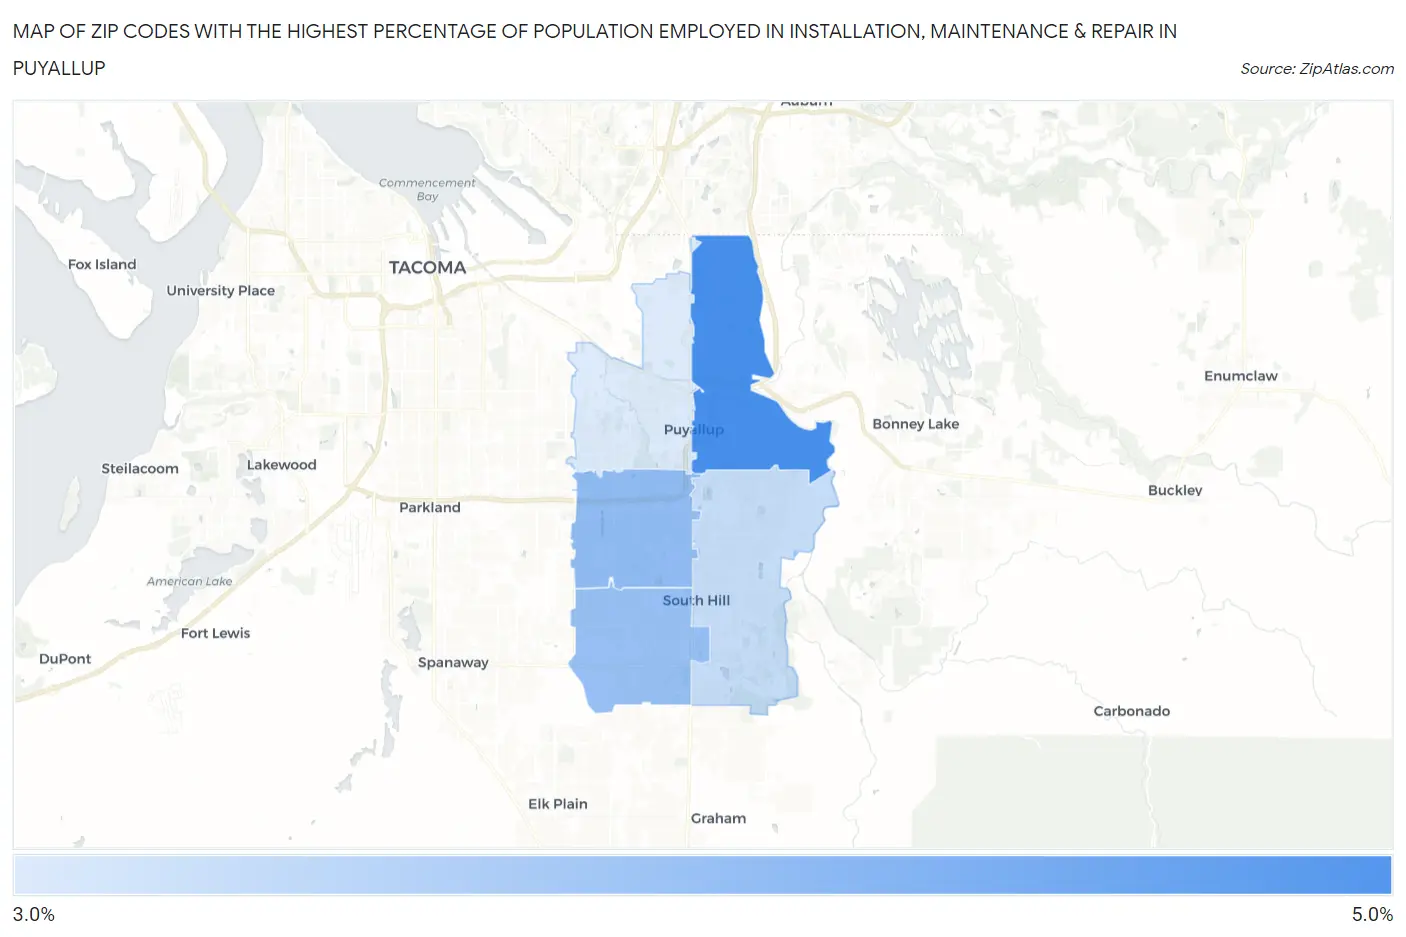
Map of Zip Codes with the Highest Percentage of Population Employed in Installation, Maintenance & Repair in Puyallup
3.5%
4.7%
Zip Codes with the Highest Percentage of Population Employed in Installation, Maintenance & Repair in Puyallup, WA
| Zip Code | % Employed | vs State | vs National | |
| 1. | 98372 | 4.7% | 2.9%(+1.82)#145 | 3.1%(+1.68)#9,535 |
| 2. | 98373 | 4.1% | 2.9%(+1.22)#184 | 3.1%(+1.08)#11,735 |
| 3. | 98375 | 4.1% | 2.9%(+1.15)#189 | 3.1%(+1.02)#11,993 |
| 4. | 98374 | 3.7% | 2.9%(+0.779)#218 | 3.1%(+0.640)#13,633 |
| 5. | 98371 | 3.5% | 2.9%(+0.594)#229 | 3.1%(+0.455)#14,522 |
1
Common Questions
What are the Top 3 Zip Codes with the Highest Percentage of Population Employed in Installation, Maintenance & Repair in Puyallup, WA?
Top 3 Zip Codes with the Highest Percentage of Population Employed in Installation, Maintenance & Repair in Puyallup, WA are:
What zip code has the Highest Percentage of Population Employed in Installation, Maintenance & Repair in Puyallup, WA?
98372 has the Highest Percentage of Population Employed in Installation, Maintenance & Repair in Puyallup, WA with 4.7%.
What is the Percentage of Population Employed in Installation, Maintenance & Repair in Puyallup, WA?
Percentage of Population Employed in Installation, Maintenance & Repair in Puyallup is 4.3%.
What is the Percentage of Population Employed in Installation, Maintenance & Repair in Washington?
Percentage of Population Employed in Installation, Maintenance & Repair in Washington is 2.9%.
What is the Percentage of Population Employed in Installation, Maintenance & Repair in the United States?
Percentage of Population Employed in Installation, Maintenance & Repair in the United States is 3.1%.