Zip Codes with the Highest Percentage of Population with a Degree in Liberal Arts and History in Layton, UT
RELATED REPORTS & OPTIONS
Liberal Arts and History
Layton
Compare Zip Codes
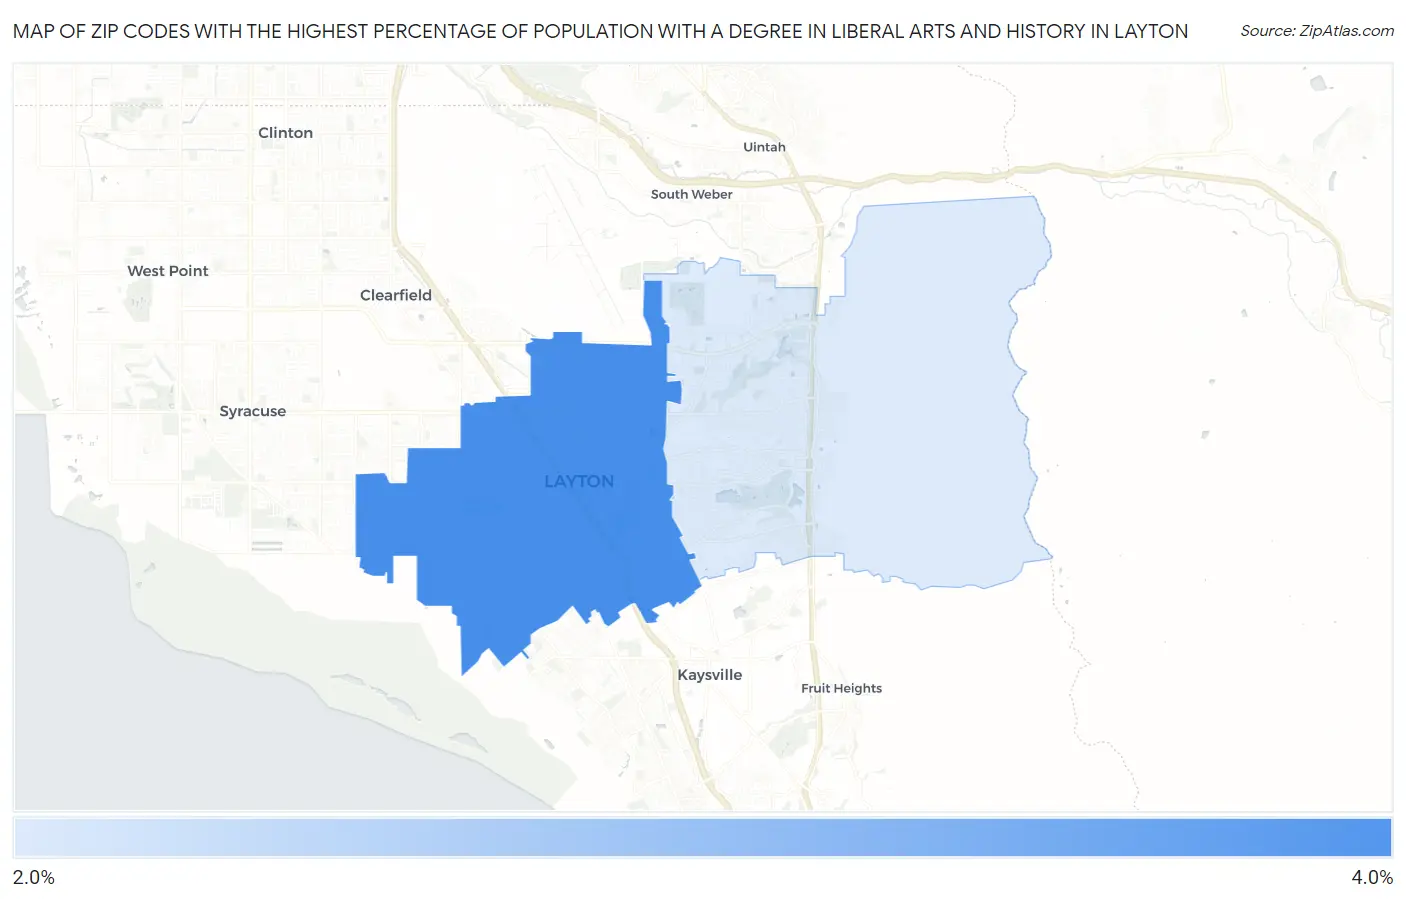
Map of Zip Codes with the Highest Percentage of Population with a Degree in Liberal Arts and History in Layton
2.5%
3.3%
Zip Codes with the Highest Percentage of Population with a Degree in Liberal Arts and History in Layton, UT
| Zip Code | % Graduates | vs State | vs National | |
| 1. | 84041 | 3.3% | 3.3%(+0.027)#93 | 4.9%(-1.53)#17,156 |
| 2. | 84040 | 2.5% | 3.3%(-0.823)#141 | 4.9%(-2.38)#20,001 |
1
Common Questions
What are the Top Zip Codes with the Highest Percentage of Population with a Degree in Liberal Arts and History in Layton, UT?
Top Zip Codes with the Highest Percentage of Population with a Degree in Liberal Arts and History in Layton, UT are:
What zip code has the Highest Percentage of Population with a Degree in Liberal Arts and History in Layton, UT?
84041 has the Highest Percentage of Population with a Degree in Liberal Arts and History in Layton, UT with 3.3%.
What is the Percentage of Population with a Degree in Liberal Arts and History in Layton, UT?
Percentage of Population with a Degree in Liberal Arts and History in Layton is 3.0%.
What is the Percentage of Population with a Degree in Liberal Arts and History in Utah?
Percentage of Population with a Degree in Liberal Arts and History in Utah is 3.3%.
What is the Percentage of Population with a Degree in Liberal Arts and History in the United States?
Percentage of Population with a Degree in Liberal Arts and History in the United States is 4.9%.