Zip Codes with the Highest Percentage of Population Employed in Administrative & Support Services in Provo, UT
RELATED REPORTS & OPTIONS
Administrative & Support Services
Provo
Compare Zip Codes
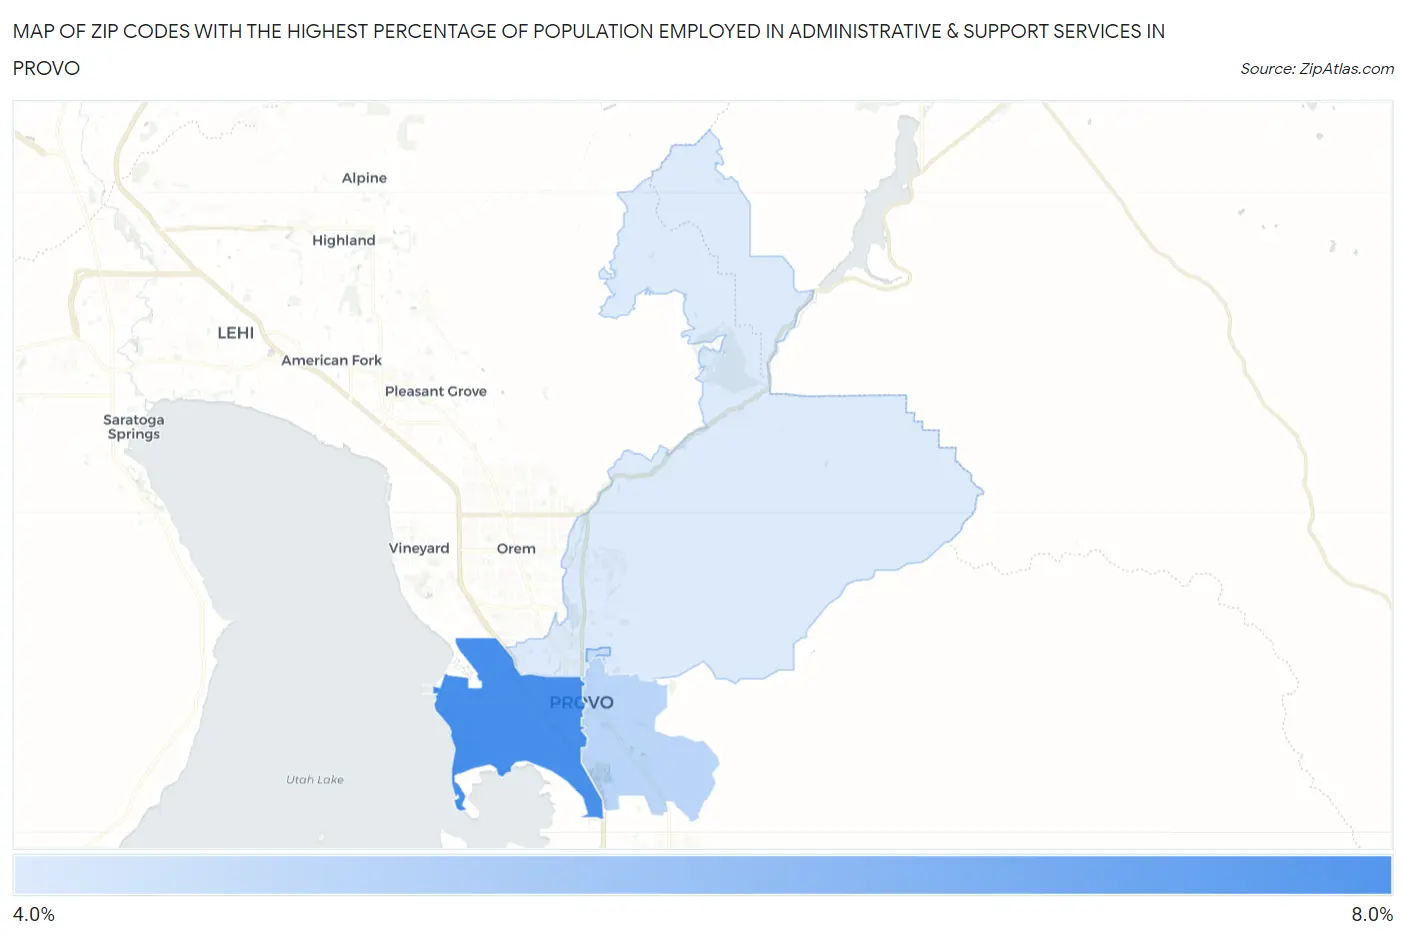
Map of Zip Codes with the Highest Percentage of Population Employed in Administrative & Support Services in Provo
4.3%
7.4%
Zip Codes with the Highest Percentage of Population Employed in Administrative & Support Services in Provo, UT
| Zip Code | % Employed | vs State | vs National | |
| 1. | 84601 | 7.4% | 4.3%(+3.08)#22 | 4.1%(+3.23)#2,815 |
| 2. | 84606 | 5.0% | 4.3%(+0.695)#63 | 4.1%(+0.837)#7,146 |
| 3. | 84602 | 4.7% | 4.3%(+0.400)#71 | 4.1%(+0.542)#8,063 |
| 4. | 84604 | 4.3% | 4.3%(-0.004)#83 | 4.1%(+0.137)#9,488 |
1
Common Questions
What are the Top 3 Zip Codes with the Highest Percentage of Population Employed in Administrative & Support Services in Provo, UT?
Top 3 Zip Codes with the Highest Percentage of Population Employed in Administrative & Support Services in Provo, UT are:
What zip code has the Highest Percentage of Population Employed in Administrative & Support Services in Provo, UT?
84601 has the Highest Percentage of Population Employed in Administrative & Support Services in Provo, UT with 7.4%.
What is the Percentage of Population Employed in Administrative & Support Services in Provo, UT?
Percentage of Population Employed in Administrative & Support Services in Provo is 5.4%.
What is the Percentage of Population Employed in Administrative & Support Services in Utah?
Percentage of Population Employed in Administrative & Support Services in Utah is 4.3%.
What is the Percentage of Population Employed in Administrative & Support Services in the United States?
Percentage of Population Employed in Administrative & Support Services in the United States is 4.1%.