Vernon, UT Map & Demographics
Vernon Map
Vernon Overview
$26,037
PER CAPITA INCOME
$75,000
AVG FAMILY INCOME
$52,344
AVG HOUSEHOLD INCOME
70.5%
WAGE / INCOME GAP [ % ]
29.5¢/ $1
WAGE / INCOME GAP [ $ ]
0.40
INEQUALITY / GINI INDEX
228
TOTAL POPULATION
123
MALE POPULATION
105
FEMALE POPULATION
117.14
MALES / 100 FEMALES
85.37
FEMALES / 100 MALES
42.3
MEDIAN AGE
3.5
AVG FAMILY SIZE
2.6
AVG HOUSEHOLD SIZE
84
LABOR FORCE [ PEOPLE ]
48.6%
PERCENT IN LABOR FORCE
1.2%
UNEMPLOYMENT RATE
Vernon Zip Codes
Vernon Area Codes
Income in Vernon
Income Overview in Vernon
Per Capita Income in Vernon is $26,037, while median incomes of families and households are $75,000 and $52,344 respectively.
| Characteristic | Number | Measure |
| Per Capita Income | 228 | $26,037 |
| Median Family Income | 56 | $75,000 |
| Mean Family Income | 56 | $86,839 |
| Median Household Income | 87 | $52,344 |
| Mean Household Income | 87 | $67,339 |
| Income Deficit | 56 | $0 |
| Wage / Income Gap (%) | 228 | 70.45% |
| Wage / Income Gap ($) | 228 | 29.55¢ per $1 |
| Gini / Inequality Index | 228 | 0.40 |
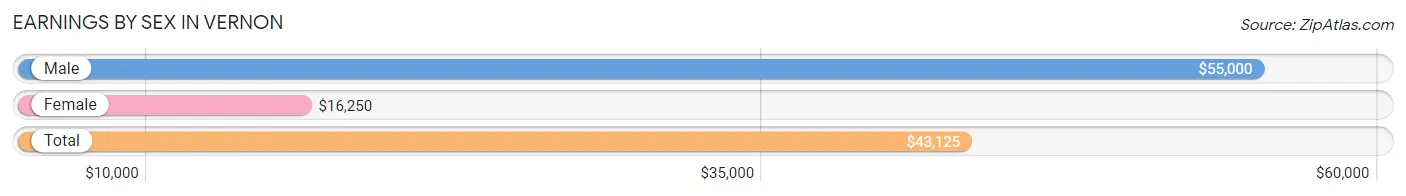
Earnings by Sex in Vernon
Average Earnings in Vernon are $43,125, $55,000 for men and $16,250 for women, a difference of 70.5%.
| Sex | Number | Average Earnings |
| Male | 54 (56.8%) | $55,000 |
| Female | 41 (43.2%) | $16,250 |
| Total | 95 (100.0%) | $43,125 |
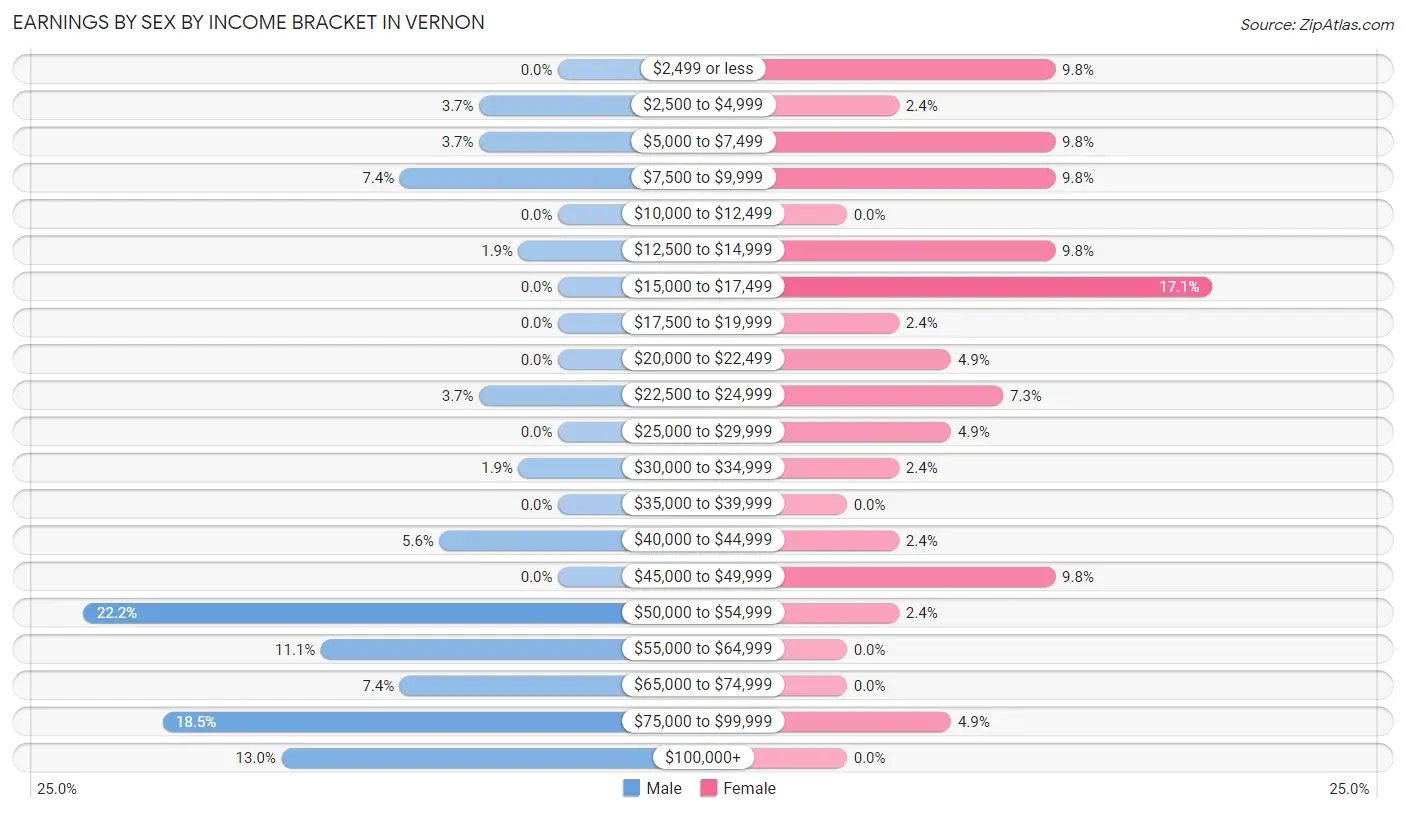
Earnings by Sex by Income Bracket in Vernon
The most common earnings brackets in Vernon are $50,000 to $54,999 for men (12 | 22.2%) and $15,000 to $17,499 for women (7 | 17.1%).
| Income | Male | Female |
| $2,499 or less | 0 (0.0%) | 4 (9.8%) |
| $2,500 to $4,999 | 2 (3.7%) | 1 (2.4%) |
| $5,000 to $7,499 | 2 (3.7%) | 4 (9.8%) |
| $7,500 to $9,999 | 4 (7.4%) | 4 (9.8%) |
| $10,000 to $12,499 | 0 (0.0%) | 0 (0.0%) |
| $12,500 to $14,999 | 1 (1.8%) | 4 (9.8%) |
| $15,000 to $17,499 | 0 (0.0%) | 7 (17.1%) |
| $17,500 to $19,999 | 0 (0.0%) | 1 (2.4%) |
| $20,000 to $22,499 | 0 (0.0%) | 2 (4.9%) |
| $22,500 to $24,999 | 2 (3.7%) | 3 (7.3%) |
| $25,000 to $29,999 | 0 (0.0%) | 2 (4.9%) |
| $30,000 to $34,999 | 1 (1.8%) | 1 (2.4%) |
| $35,000 to $39,999 | 0 (0.0%) | 0 (0.0%) |
| $40,000 to $44,999 | 3 (5.6%) | 1 (2.4%) |
| $45,000 to $49,999 | 0 (0.0%) | 4 (9.8%) |
| $50,000 to $54,999 | 12 (22.2%) | 1 (2.4%) |
| $55,000 to $64,999 | 6 (11.1%) | 0 (0.0%) |
| $65,000 to $74,999 | 4 (7.4%) | 0 (0.0%) |
| $75,000 to $99,999 | 10 (18.5%) | 2 (4.9%) |
| $100,000+ | 7 (13.0%) | 0 (0.0%) |
| Total | 54 (100.0%) | 41 (100.0%) |
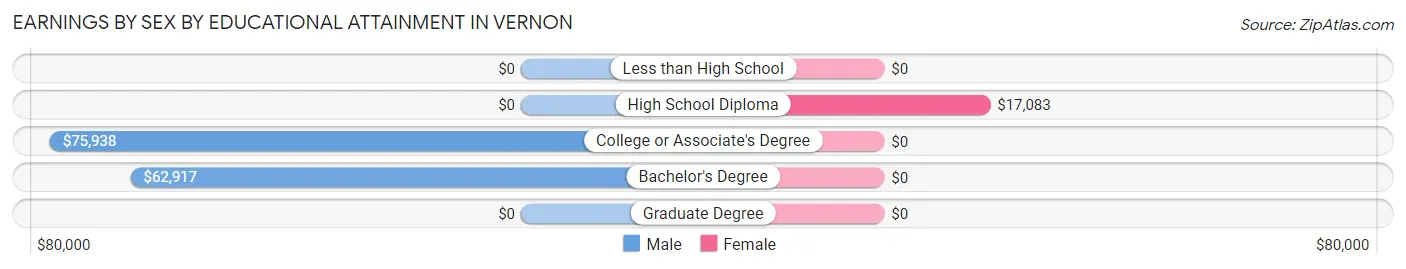
Earnings by Sex by Educational Attainment in Vernon
Average earnings in Vernon are $70,625 for men and $16,000 for women, a difference of 77.3%. Men with an educational attainment of college or associate's degree enjoy the highest average annual earnings of $75,938, while those with bachelor's degree education earn the least with $62,917. Women with an educational attainment of high school diploma earn the most with the average annual earnings of $17,083, while those with high school diploma education have the smallest earnings of $17,083.
| Educational Attainment | Male Income | Female Income |
| Less than High School | - | - |
| High School Diploma | - | - |
| College or Associate's Degree | $75,938 | $0 |
| Bachelor's Degree | $62,917 | $0 |
| Graduate Degree | - | - |
| Total | $70,625 | $16,000 |
Family Income in Vernon
Family Income Brackets in Vernon
According to the Vernon family income data, there are 13 families falling into the $35,000 to $49,999 income range, which is the most common income bracket and makes up 23.2% of all families.
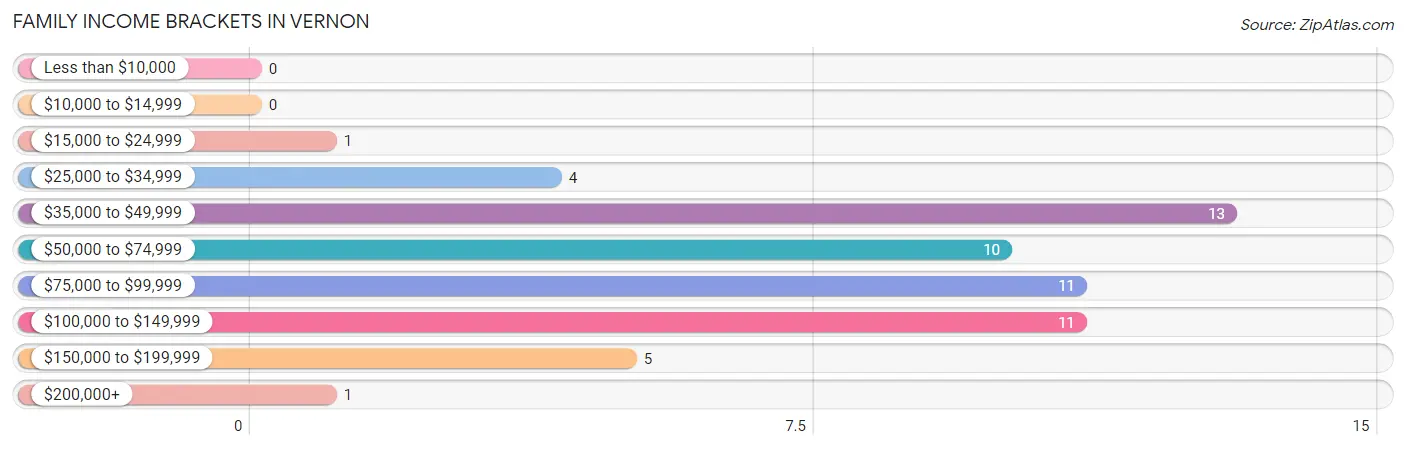
| Income Bracket | # Families | % Families |
| Less than $10,000 | 0 | 0.0% |
| $10,000 to $14,999 | 0 | 0.0% |
| $15,000 to $24,999 | 1 | 1.8% |
| $25,000 to $34,999 | 4 | 7.1% |
| $35,000 to $49,999 | 13 | 23.2% |
| $50,000 to $74,999 | 10 | 17.9% |
| $75,000 to $99,999 | 11 | 19.6% |
| $100,000 to $149,999 | 11 | 19.6% |
| $150,000 to $199,999 | 5 | 8.9% |
| $200,000+ | 1 | 1.8% |
Family Income by Famaliy Size in Vernon
4-person families (8 | 14.3%) account for the highest median family income in Vernon with $95,000 per family, while 2-person families (25 | 44.6%) have the highest median income of $25,312 per family member.
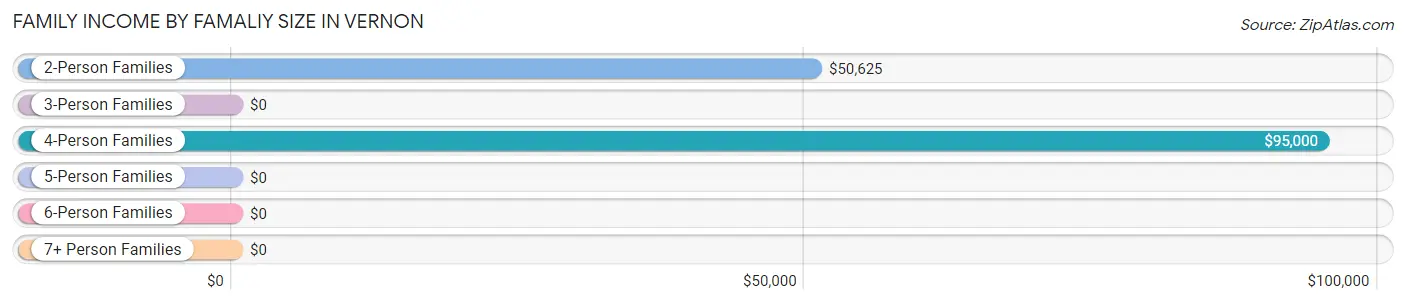
| Income Bracket | # Families | Median Income |
| 2-Person Families | 25 (44.6%) | $50,625 |
| 3-Person Families | 6 (10.7%) | $0 |
| 4-Person Families | 8 (14.3%) | $95,000 |
| 5-Person Families | 10 (17.9%) | $0 |
| 6-Person Families | 2 (3.6%) | $0 |
| 7+ Person Families | 5 (8.9%) | $0 |
| Total | 56 (100.0%) | $75,000 |
Family Income by Number of Earners in Vernon
The median family income in Vernon is $75,000, with families comprising 3+ earners (13) having the highest median family income of $135,417, while families with no earners (18) have the lowest median family income of $42,000, accounting for 23.2% and 32.1% of families, respectively.
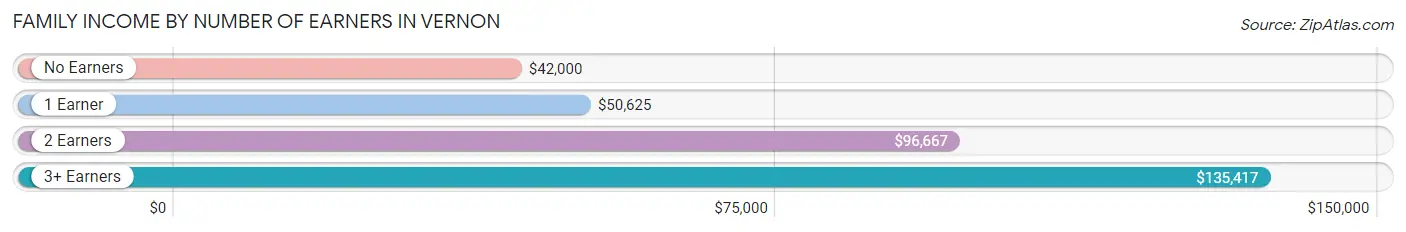
| Number of Earners | # Families | Median Income |
| No Earners | 18 (32.1%) | $42,000 |
| 1 Earner | 9 (16.1%) | $50,625 |
| 2 Earners | 16 (28.6%) | $96,667 |
| 3+ Earners | 13 (23.2%) | $135,417 |
| Total | 56 (100.0%) | $75,000 |
Household Income in Vernon
Household Income Brackets in Vernon
With 21 households falling in the category, the $50,000 to $74,999 income range is the most frequent in Vernon, accounting for 24.1% of all households.
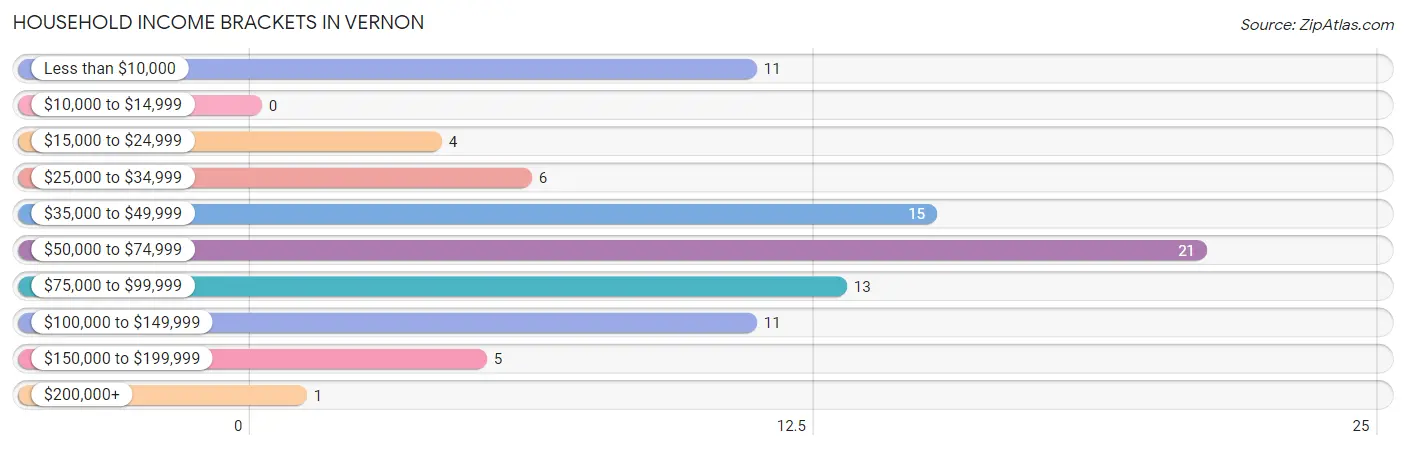
| Income Bracket | # Households | % Households |
| Less than $10,000 | 11 | 12.6% |
| $10,000 to $14,999 | 0 | 0.0% |
| $15,000 to $24,999 | 4 | 4.6% |
| $25,000 to $34,999 | 6 | 6.9% |
| $35,000 to $49,999 | 15 | 17.2% |
| $50,000 to $74,999 | 21 | 24.1% |
| $75,000 to $99,999 | 13 | 14.9% |
| $100,000 to $149,999 | 11 | 12.6% |
| $150,000 to $199,999 | 5 | 5.7% |
| $200,000+ | 1 | 1.1% |
Household Income by Householder Age in Vernon
The median household income in Vernon is $52,344, with the highest median household income of $96,250 found in the 45 to 64 years age bracket for the primary householder. A total of 24 households (27.6%) fall into this category. Meanwhile, the 15 to 24 years age bracket for the primary householder has the lowest median household income of $0, with 2 households (2.3%) in this group.
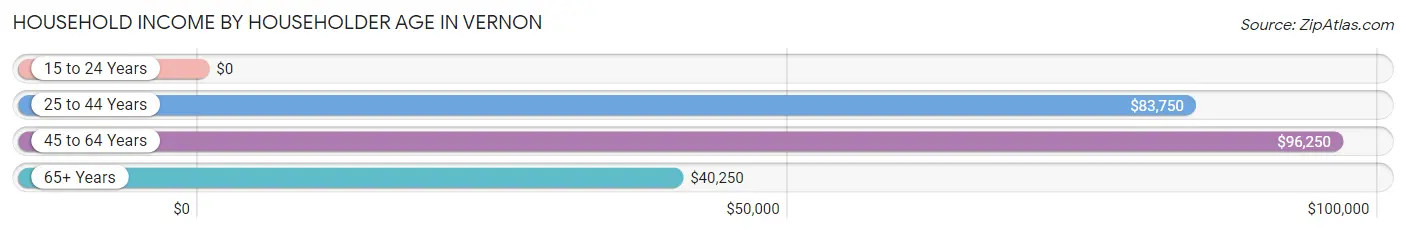
| Income Bracket | # Households | Median Income |
| 15 to 24 Years | 2 (2.3%) | $0 |
| 25 to 44 Years | 24 (27.6%) | $83,750 |
| 45 to 64 Years | 24 (27.6%) | $96,250 |
| 65+ Years | 37 (42.5%) | $40,250 |
| Total | 87 (100.0%) | $52,344 |
Poverty in Vernon
Income Below Poverty by Sex and Age in Vernon
With 9.8% poverty level for males and 7.6% for females among the residents of Vernon, 65 to 74 year old males and 16 and 17 year old females are the most vulnerable to poverty, with 7 males (36.8%) and 1 females (33.3%) in their respective age groups living below the poverty level.
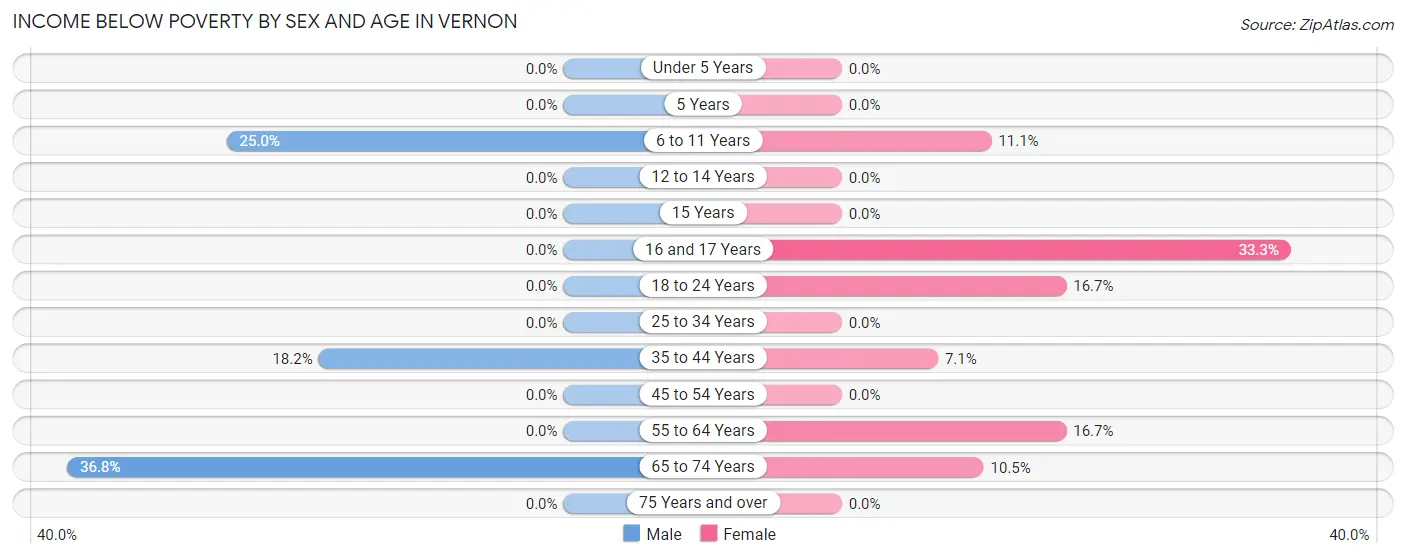
| Age Bracket | Male | Female |
| Under 5 Years | 0 (0.0%) | 0 (0.0%) |
| 5 Years | 0 (0.0%) | 0 (0.0%) |
| 6 to 11 Years | 3 (25.0%) | 1 (11.1%) |
| 12 to 14 Years | 0 (0.0%) | 0 (0.0%) |
| 15 Years | 0 (0.0%) | 0 (0.0%) |
| 16 and 17 Years | 0 (0.0%) | 1 (33.3%) |
| 18 to 24 Years | 0 (0.0%) | 1 (16.7%) |
| 25 to 34 Years | 0 (0.0%) | 0 (0.0%) |
| 35 to 44 Years | 2 (18.2%) | 1 (7.1%) |
| 45 to 54 Years | 0 (0.0%) | 0 (0.0%) |
| 55 to 64 Years | 0 (0.0%) | 2 (16.7%) |
| 65 to 74 Years | 7 (36.8%) | 2 (10.5%) |
| 75 Years and over | 0 (0.0%) | 0 (0.0%) |
| Total | 12 (9.8%) | 8 (7.6%) |
Income Above Poverty by Sex and Age in Vernon
According to the poverty statistics in Vernon, males aged under 5 years and females aged under 5 years are the age groups that are most secure financially, with 100.0% of males and 100.0% of females in these age groups living above the poverty line.
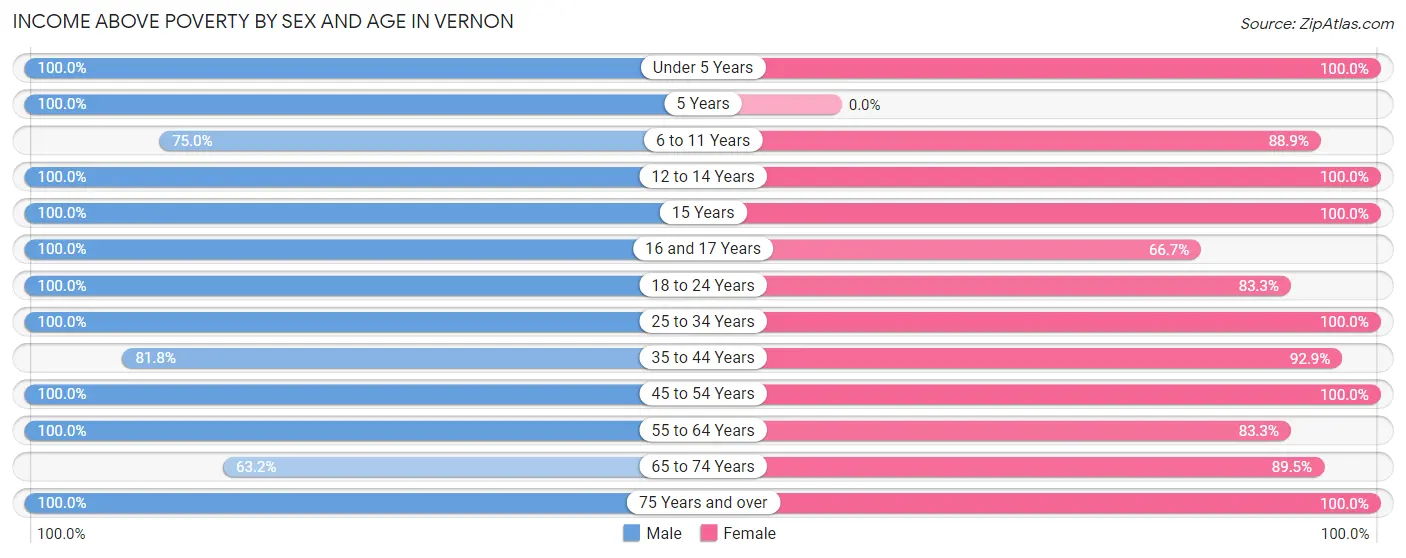
| Age Bracket | Male | Female |
| Under 5 Years | 9 (100.0%) | 3 (100.0%) |
| 5 Years | 2 (100.0%) | 0 (0.0%) |
| 6 to 11 Years | 9 (75.0%) | 8 (88.9%) |
| 12 to 14 Years | 7 (100.0%) | 1 (100.0%) |
| 15 Years | 4 (100.0%) | 8 (100.0%) |
| 16 and 17 Years | 3 (100.0%) | 2 (66.7%) |
| 18 to 24 Years | 15 (100.0%) | 5 (83.3%) |
| 25 to 34 Years | 11 (100.0%) | 9 (100.0%) |
| 35 to 44 Years | 9 (81.8%) | 13 (92.9%) |
| 45 to 54 Years | 16 (100.0%) | 7 (100.0%) |
| 55 to 64 Years | 7 (100.0%) | 10 (83.3%) |
| 65 to 74 Years | 12 (63.2%) | 17 (89.5%) |
| 75 Years and over | 7 (100.0%) | 14 (100.0%) |
| Total | 111 (90.2%) | 97 (92.4%) |
Income Below Poverty Among Married-Couple Families in Vernon
The poverty statistics for married-couple families in Vernon show that 3.7% or 2 of the total 54 families live below the poverty line. Families with 3 or 4 children have the highest poverty rate of 16.7%, comprising of 2 families. On the other hand, families with no children have the lowest poverty rate of 0.0%, which includes 0 families.
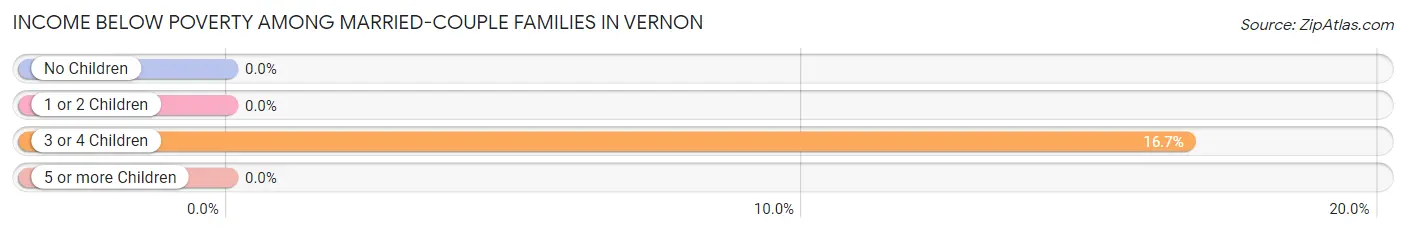
| Children | Above Poverty | Below Poverty |
| No Children | 25 (100.0%) | 0 (0.0%) |
| 1 or 2 Children | 17 (100.0%) | 0 (0.0%) |
| 3 or 4 Children | 10 (83.3%) | 2 (16.7%) |
| 5 or more Children | 0 (0.0%) | 0 (0.0%) |
| Total | 52 (96.3%) | 2 (3.7%) |
Income Below Poverty Among Single-Parent Households in Vernon
| Children | Single Father | Single Mother |
| No Children | 0 (0.0%) | 0 (0.0%) |
| 1 or 2 Children | 0 (0.0%) | 0 (0.0%) |
| 3 or 4 Children | 0 (0.0%) | 0 (0.0%) |
| 5 or more Children | 0 (0.0%) | 0 (0.0%) |
| Total | 0 (0.0%) | 0 (0.0%) |
Income Below Poverty Among Married-Couple vs Single-Parent Households in Vernon
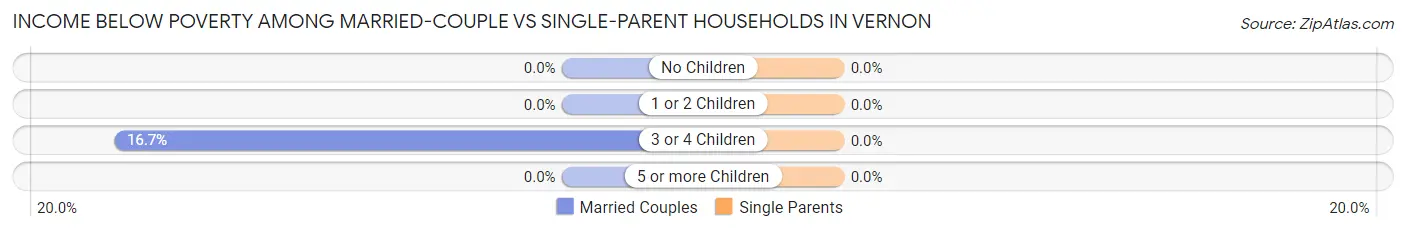
| Children | Married-Couple Families | Single-Parent Households |
| No Children | 0 (0.0%) | 0 (0.0%) |
| 1 or 2 Children | 0 (0.0%) | 0 (0.0%) |
| 3 or 4 Children | 2 (16.7%) | 0 (0.0%) |
| 5 or more Children | 0 (0.0%) | 0 (0.0%) |
| Total | 2 (3.7%) | 0 (0.0%) |
Race in Vernon
The most populous races in Vernon are White / Caucasian (224 | 98.3%), Two or more Races (4 | 1.8%), and Hispanic or Latino (3 | 1.3%).
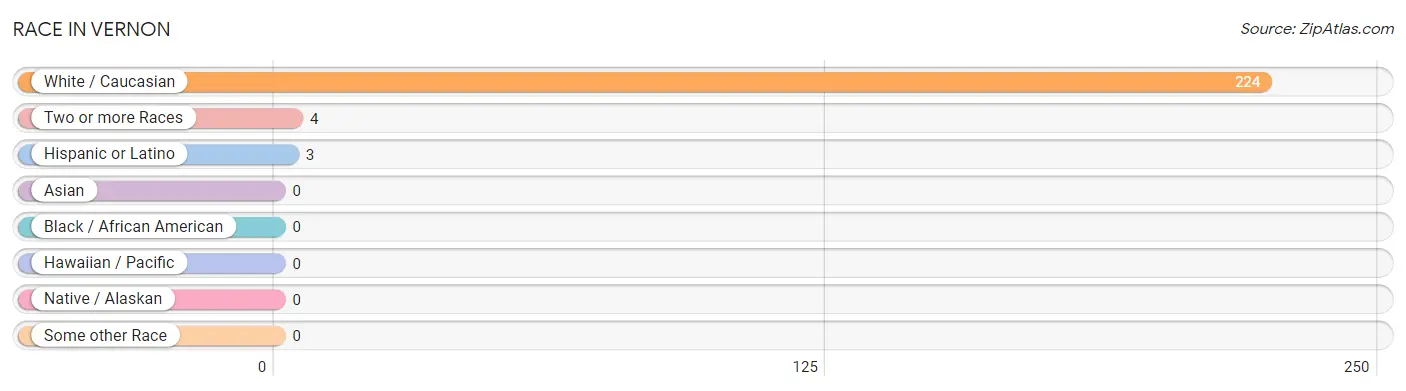
| Race | # Population | % Population |
| Asian | 0 | 0.0% |
| Black / African American | 0 | 0.0% |
| Hawaiian / Pacific | 0 | 0.0% |
| Hispanic or Latino | 3 | 1.3% |
| Native / Alaskan | 0 | 0.0% |
| White / Caucasian | 224 | 98.3% |
| Two or more Races | 4 | 1.8% |
| Some other Race | 0 | 0.0% |
| Total | 228 | 100.0% |
Ancestry in Vernon
The most populous ancestries reported in Vernon are English (110 | 48.2%), Danish (26 | 11.4%), Swedish (26 | 11.4%), American (25 | 11.0%), and Dutch (20 | 8.8%), together accounting for 90.8% of all Vernon residents.
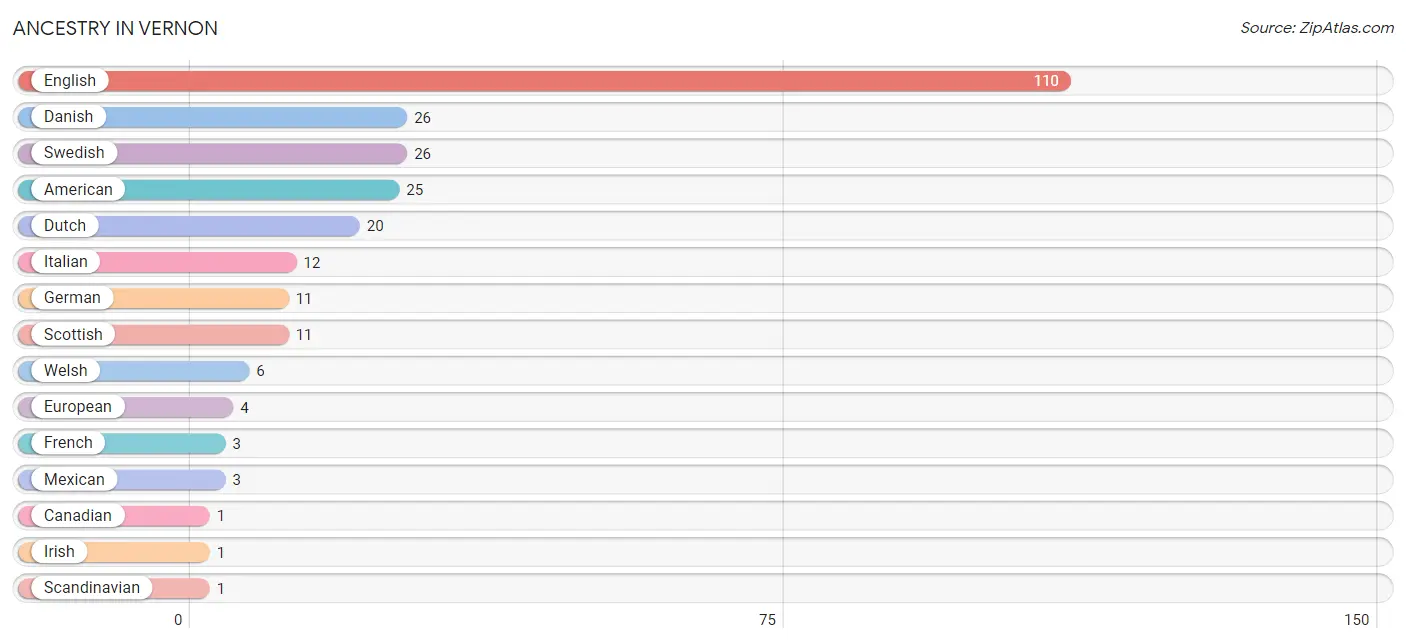
| Ancestry | # Population | % Population |
| American | 25 | 11.0% |
| Canadian | 1 | 0.4% |
| Danish | 26 | 11.4% |
| Dutch | 20 | 8.8% |
| English | 110 | 48.2% |
| European | 4 | 1.8% |
| French | 3 | 1.3% |
| German | 11 | 4.8% |
| Irish | 1 | 0.4% |
| Italian | 12 | 5.3% |
| Mexican | 3 | 1.3% |
| Scandinavian | 1 | 0.4% |
| Scottish | 11 | 4.8% |
| Shoshone | 1 | 0.4% |
| Swedish | 26 | 11.4% |
| Swiss | 1 | 0.4% |
| Welsh | 6 | 2.6% | View All 17 Rows |
Immigrants in Vernon

| Immigration Origin | # Population | % Population | View All 0 Rows |
Sex and Age in Vernon
Sex and Age in Vernon
The most populous age groups in Vernon are 15 to 19 Years (16 | 13.0%) for men and 40 to 44 Years (14 | 13.3%) for women.
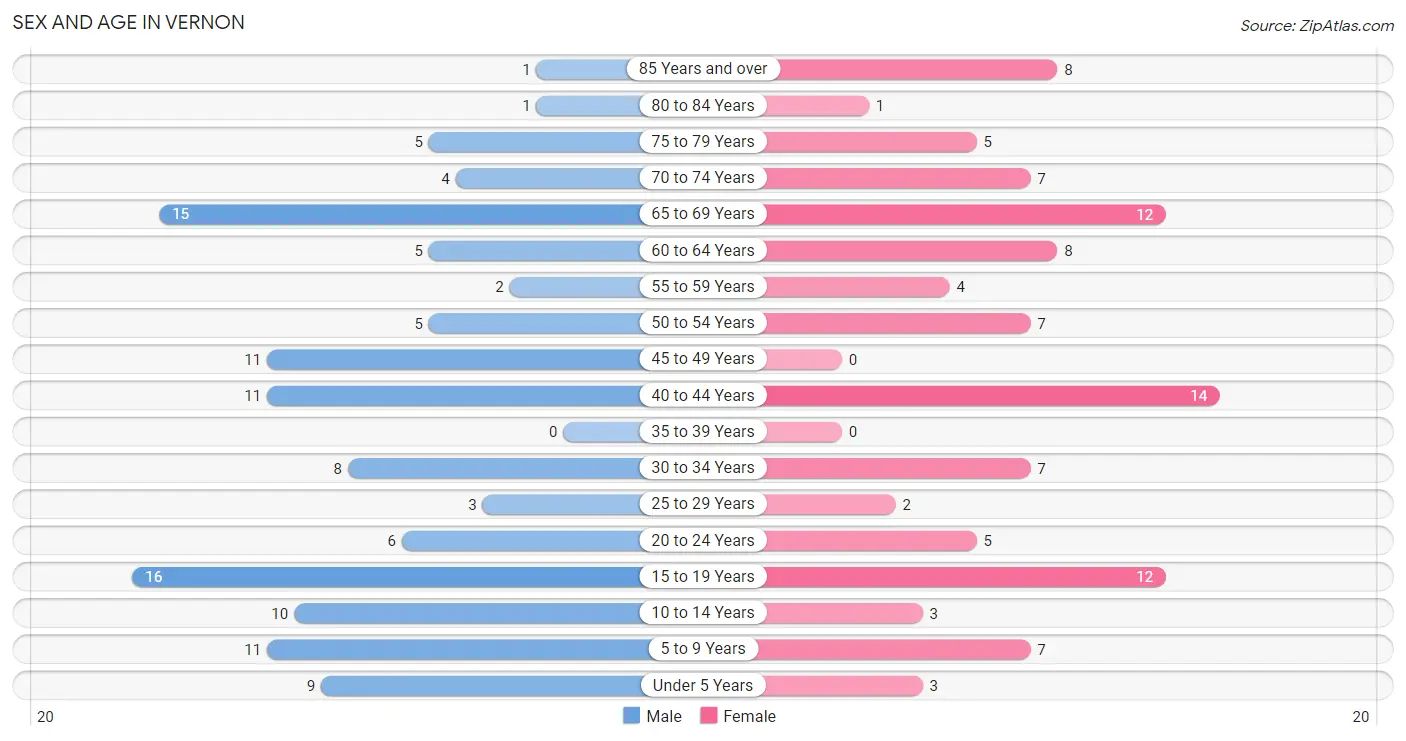
| Age Bracket | Male | Female |
| Under 5 Years | 9 (7.3%) | 3 (2.9%) |
| 5 to 9 Years | 11 (8.9%) | 7 (6.7%) |
| 10 to 14 Years | 10 (8.1%) | 3 (2.9%) |
| 15 to 19 Years | 16 (13.0%) | 12 (11.4%) |
| 20 to 24 Years | 6 (4.9%) | 5 (4.8%) |
| 25 to 29 Years | 3 (2.4%) | 2 (1.9%) |
| 30 to 34 Years | 8 (6.5%) | 7 (6.7%) |
| 35 to 39 Years | 0 (0.0%) | 0 (0.0%) |
| 40 to 44 Years | 11 (8.9%) | 14 (13.3%) |
| 45 to 49 Years | 11 (8.9%) | 0 (0.0%) |
| 50 to 54 Years | 5 (4.1%) | 7 (6.7%) |
| 55 to 59 Years | 2 (1.6%) | 4 (3.8%) |
| 60 to 64 Years | 5 (4.1%) | 8 (7.6%) |
| 65 to 69 Years | 15 (12.2%) | 12 (11.4%) |
| 70 to 74 Years | 4 (3.3%) | 7 (6.7%) |
| 75 to 79 Years | 5 (4.1%) | 5 (4.8%) |
| 80 to 84 Years | 1 (0.8%) | 1 (0.9%) |
| 85 Years and over | 1 (0.8%) | 8 (7.6%) |
| Total | 123 (100.0%) | 105 (100.0%) |
Families and Households in Vernon
Median Family Size in Vernon
The median family size in Vernon is 3.52 persons per family, with married-couple families (54 | 96.4%) accounting for the largest median family size of 3.54 persons per family. On the other hand, single male/father families (1 | 1.8%) represent the smallest median family size with 3.00 persons per family.
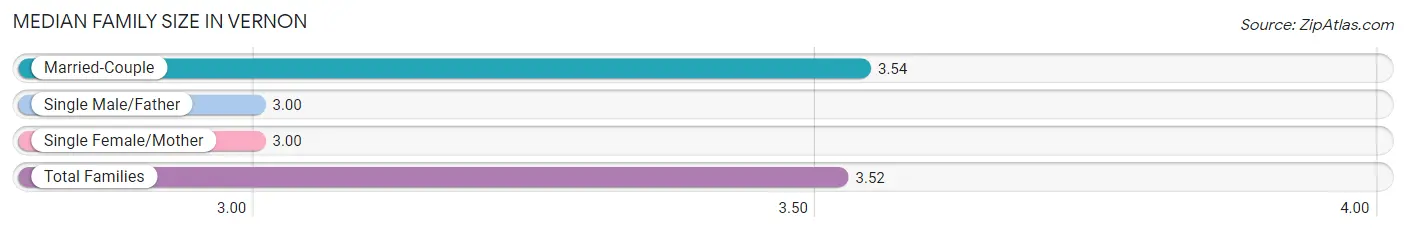
| Family Type | # Families | Family Size |
| Married-Couple | 54 (96.4%) | 3.54 |
| Single Male/Father | 1 (1.8%) | 3.00 |
| Single Female/Mother | 1 (1.8%) | 3.00 |
| Total Families | 56 (100.0%) | 3.52 |
Median Household Size in Vernon
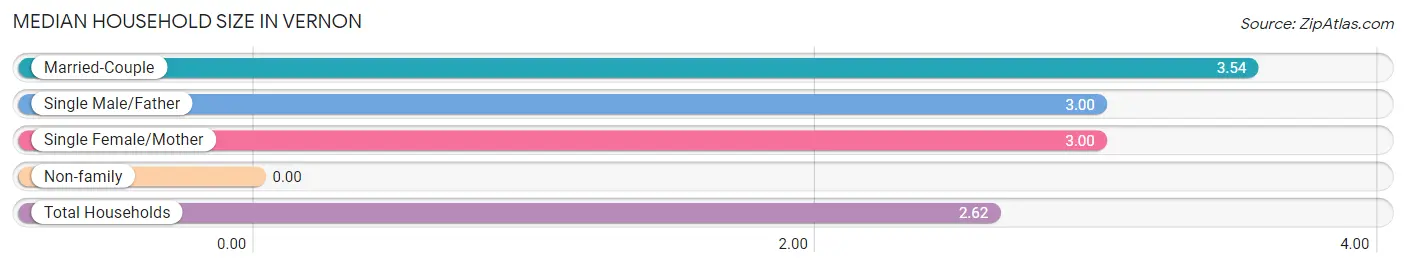
| Household Type | # Households | Household Size |
| Married-Couple | 54 (62.1%) | 3.54 |
| Single Male/Father | 1 (1.1%) | 3.00 |
| Single Female/Mother | 1 (1.1%) | 3.00 |
| Non-family | 31 (35.6%) | - |
| Total Households | 87 (100.0%) | 2.62 |
Household Size by Marriage Status in Vernon
Out of a total of 87 households in Vernon, 56 (64.4%) are family households, while 31 (35.6%) are nonfamily households. The most numerous type of family households are 2-person households, comprising 25, and the most common type of nonfamily households are 1-person households, comprising 31.
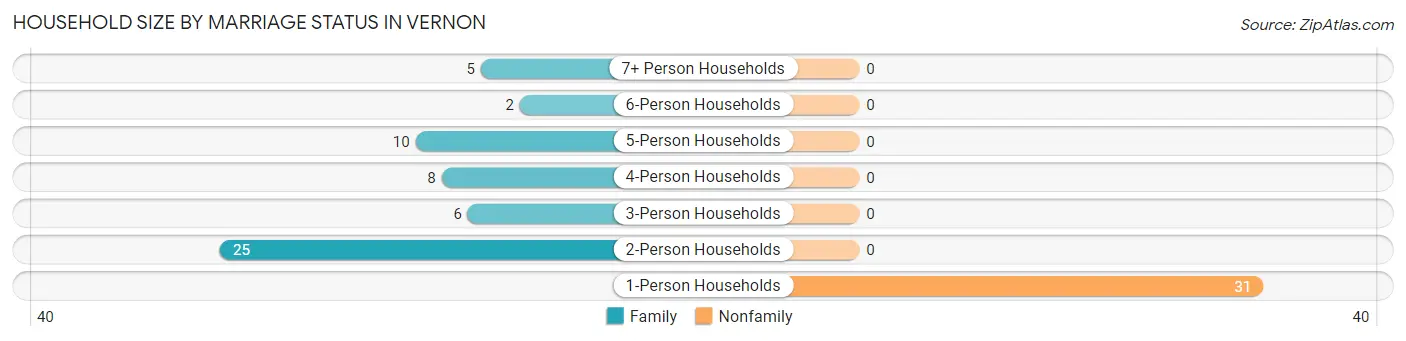
| Household Size | Family Households | Nonfamily Households |
| 1-Person Households | - | 31 (35.6%) |
| 2-Person Households | 25 (28.7%) | 0 (0.0%) |
| 3-Person Households | 6 (6.9%) | 0 (0.0%) |
| 4-Person Households | 8 (9.2%) | 0 (0.0%) |
| 5-Person Households | 10 (11.5%) | 0 (0.0%) |
| 6-Person Households | 2 (2.3%) | 0 (0.0%) |
| 7+ Person Households | 5 (5.8%) | 0 (0.0%) |
| Total | 56 (64.4%) | 31 (35.6%) |
Female Fertility in Vernon
Fertility by Age in Vernon
Average fertility rate in Vernon is 186.0 births per 1,000 women. Women in the age bracket of 20 to 34 years have the highest fertility rate with 286.0 births per 1,000 women. Women in the age bracket of 20 to 34 years acount for 50.0% of all women with births.
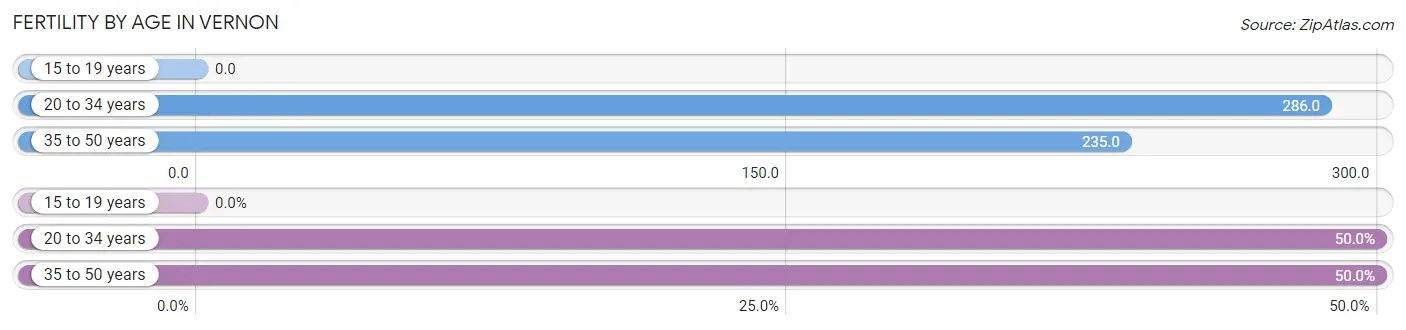
| Age Bracket | Women with Births | Births / 1,000 Women |
| 15 to 19 years | 0 (0.0%) | 0.0 |
| 20 to 34 years | 4 (50.0%) | 286.0 |
| 35 to 50 years | 4 (50.0%) | 235.0 |
| Total | 8 (100.0%) | 186.0 |
Fertility by Age by Marriage Status in Vernon
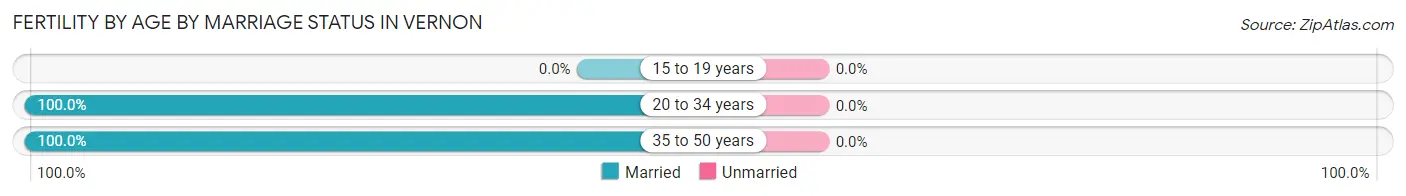
| Age Bracket | Married | Unmarried |
| 15 to 19 years | 0 (0.0%) | 0 (0.0%) |
| 20 to 34 years | 4 (100.0%) | 0 (0.0%) |
| 35 to 50 years | 4 (100.0%) | 0 (0.0%) |
| Total | 8 (100.0%) | 0 (0.0%) |
Fertility by Education in Vernon
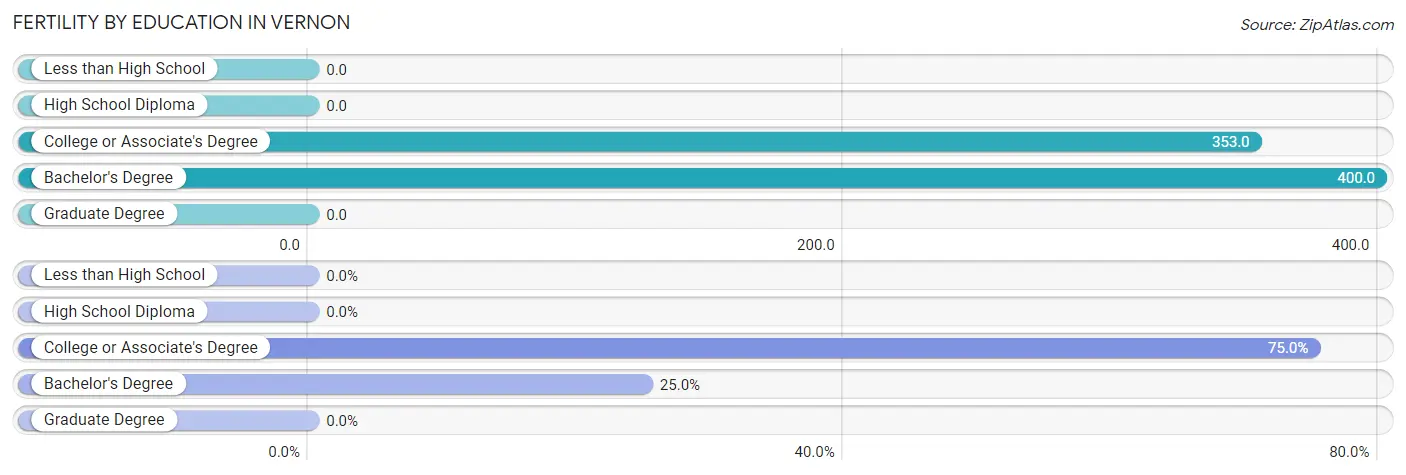
| Educational Attainment | Women with Births | Births / 1,000 Women |
| Less than High School | 0 (0.0%) | 0.0 |
| High School Diploma | 0 (0.0%) | 0.0 |
| College or Associate's Degree | 6 (75.0%) | 353.0 |
| Bachelor's Degree | 2 (25.0%) | 400.0 |
| Graduate Degree | 0 (0.0%) | 0.0 |
| Total | 8 (100.0%) | 186.0 |
Fertility by Education by Marriage Status in Vernon
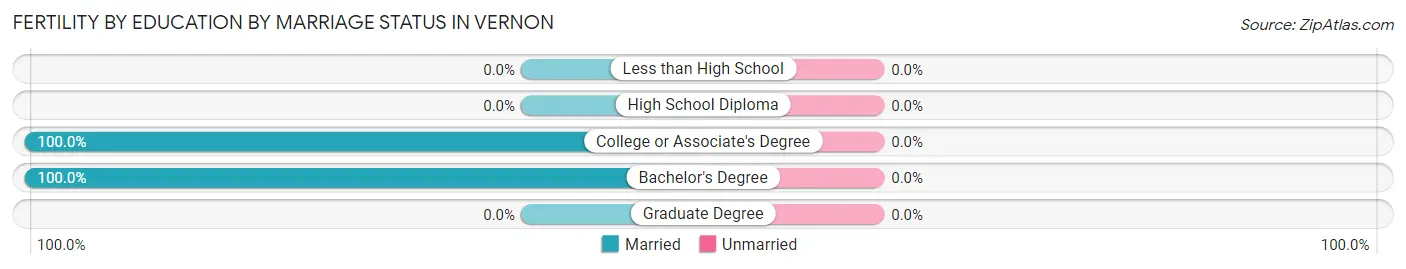
| Educational Attainment | Married | Unmarried |
| Less than High School | 0 (0.0%) | 0 (0.0%) |
| High School Diploma | 0 (0.0%) | 0 (0.0%) |
| College or Associate's Degree | 6 (100.0%) | 0 (0.0%) |
| Bachelor's Degree | 2 (100.0%) | 0 (0.0%) |
| Graduate Degree | 0 (0.0%) | 0 (0.0%) |
| Total | 8 (100.0%) | 0 (0.0%) |
Employment Characteristics in Vernon
Employment by Class of Employer in Vernon
Among the 83 employed individuals in Vernon, private company employees (47 | 56.6%), federal government employees (20 | 24.1%), and local government employees (7 | 8.4%) make up the most common classes of employment.
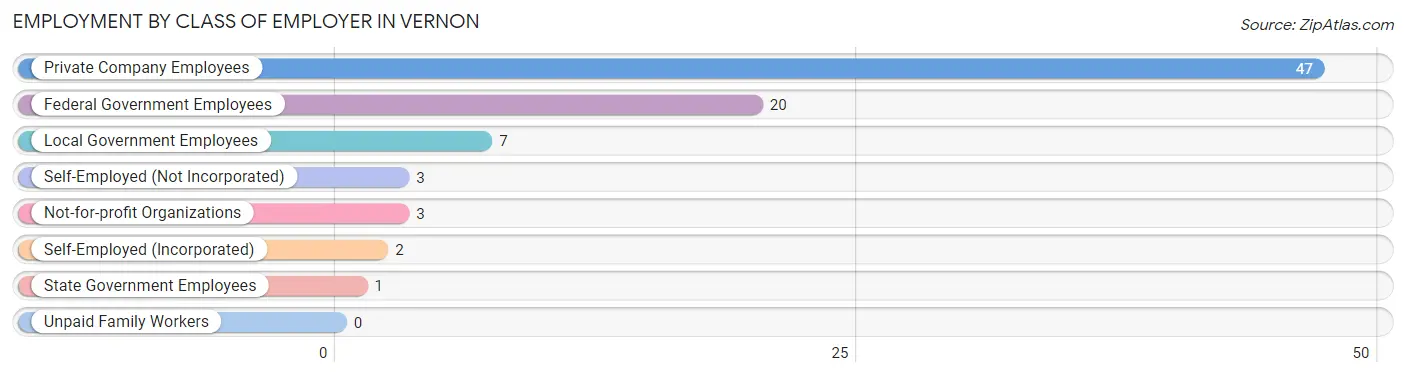
| Employer Class | # Employees | % Employees |
| Private Company Employees | 47 | 56.6% |
| Self-Employed (Incorporated) | 2 | 2.4% |
| Self-Employed (Not Incorporated) | 3 | 3.6% |
| Not-for-profit Organizations | 3 | 3.6% |
| Local Government Employees | 7 | 8.4% |
| State Government Employees | 1 | 1.2% |
| Federal Government Employees | 20 | 24.1% |
| Unpaid Family Workers | 0 | 0.0% |
| Total | 83 | 100.0% |
Employment Status by Age in Vernon
According to the labor force statistics for Vernon, out of the total population over 16 years of age (173), 48.6% or 84 individuals are in the labor force, with 1.2% or 1 of them unemployed. The age group with the highest labor force participation rate is 20 to 24 years, with 100.0% or 11 individuals in the labor force. Within the labor force, the 25 to 29 years age range has the highest percentage of unemployed individuals, with 20.0% or 1 of them being unemployed.
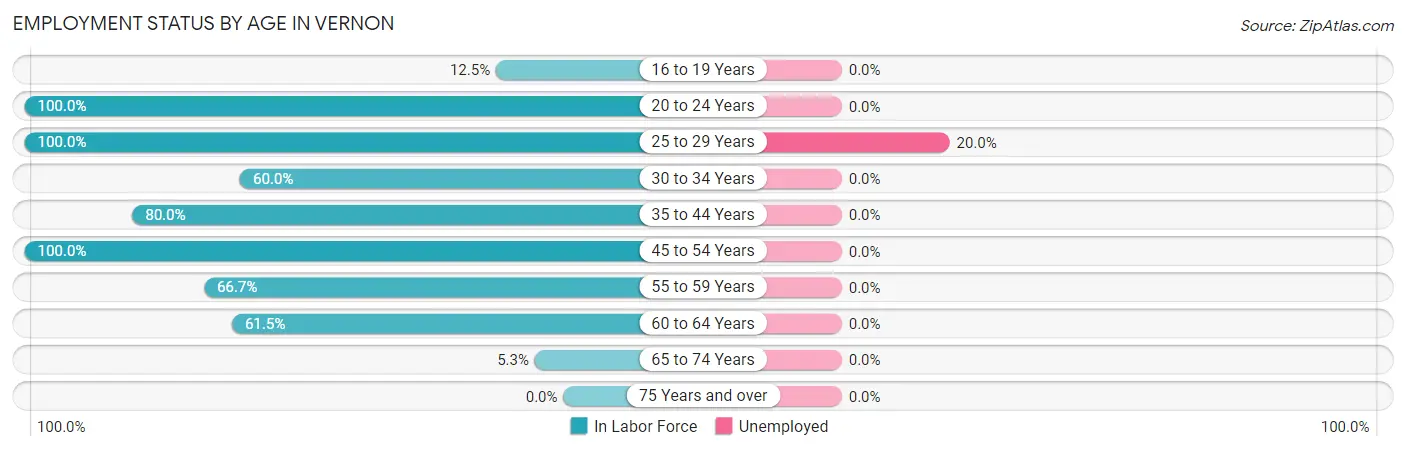
| Age Bracket | In Labor Force | Unemployed |
| 16 to 19 Years | 2 (12.5%) | 0 (0.0%) |
| 20 to 24 Years | 11 (100.0%) | 0 (0.0%) |
| 25 to 29 Years | 5 (100.0%) | 1 (20.0%) |
| 30 to 34 Years | 9 (60.0%) | 0 (0.0%) |
| 35 to 44 Years | 20 (80.0%) | 0 (0.0%) |
| 45 to 54 Years | 23 (100.0%) | 0 (0.0%) |
| 55 to 59 Years | 4 (66.7%) | 0 (0.0%) |
| 60 to 64 Years | 8 (61.5%) | 0 (0.0%) |
| 65 to 74 Years | 2 (5.3%) | 0 (0.0%) |
| 75 Years and over | 0 (0.0%) | 0 (0.0%) |
| Total | 84 (48.6%) | 1 (1.2%) |
Employment Status by Educational Attainment in Vernon
According to labor force statistics for Vernon, 79.3% of individuals (69) out of the total population between 25 and 64 years of age (87) are in the labor force, with 1.4% or 1 of them being unemployed. The group with the highest labor force participation rate are those with the educational attainment of bachelor's degree or higher, with 100.0% or 10 individuals in the labor force. Within the labor force, individuals with high school diploma education have the highest percentage of unemployment, with 3.6% or 1 of them being unemployed.
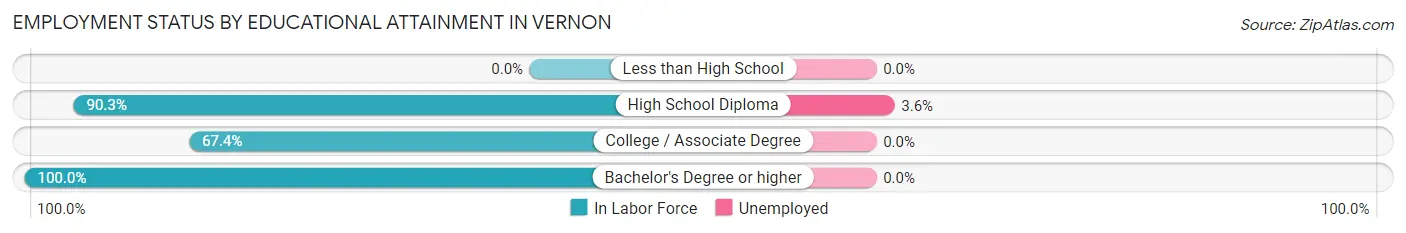
| Educational Attainment | In Labor Force | Unemployed |
| Less than High School | 0 (0.0%) | 0 (0.0%) |
| High School Diploma | 28 (90.3%) | 1 (3.6%) |
| College / Associate Degree | 31 (67.4%) | 0 (0.0%) |
| Bachelor's Degree or higher | 10 (100.0%) | 0 (0.0%) |
| Total | 69 (79.3%) | 1 (1.4%) |
Employment Occupations by Sex in Vernon
Management, Business, Science and Arts Occupations
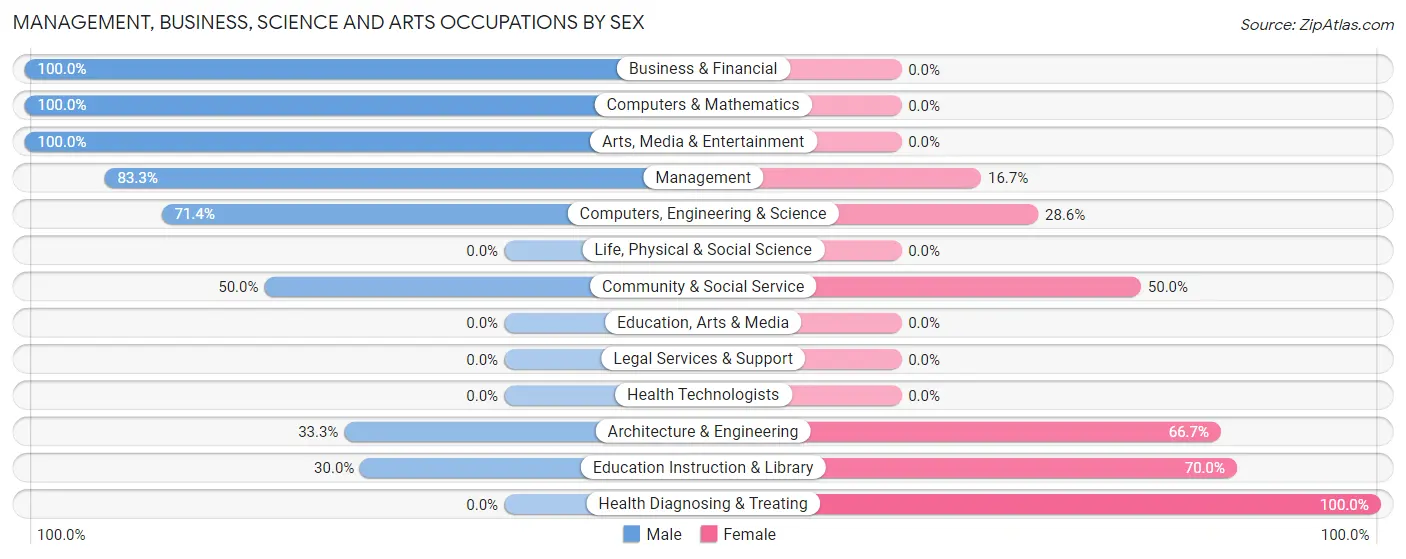
The most common Management, Business, Science and Arts occupations in Vernon are Community & Social Service (14 | 16.9%), Education Instruction & Library (10 | 12.0%), Computers, Engineering & Science (7 | 8.4%), Management (6 | 7.2%), and Computers & Mathematics (4 | 4.8%).
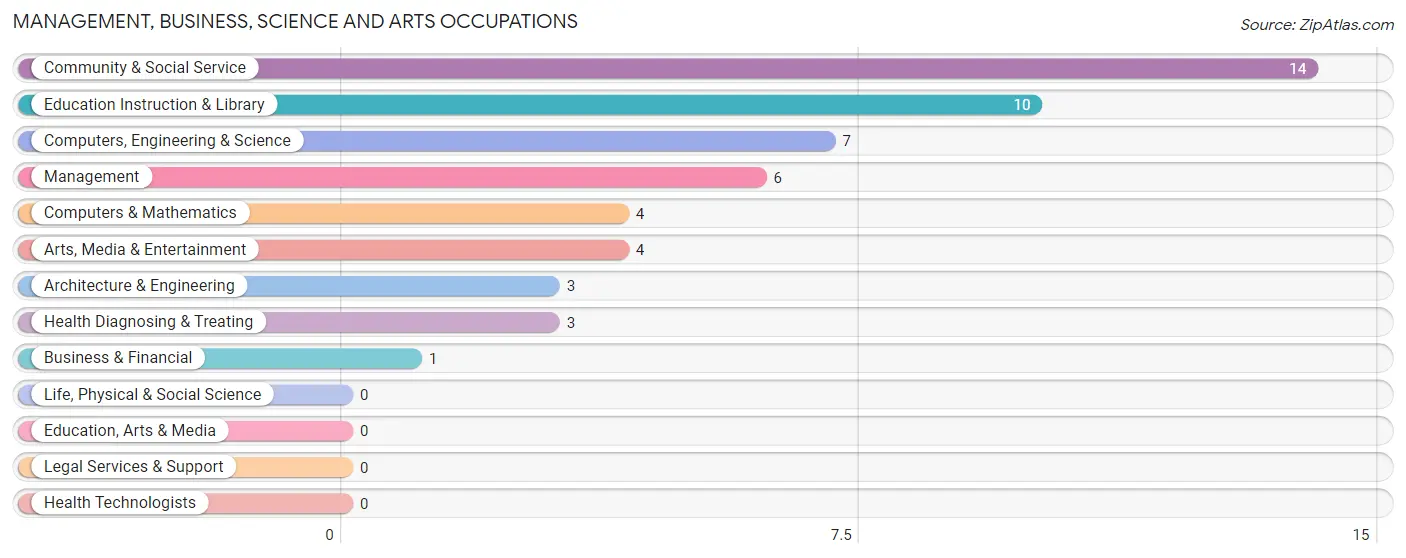
Management, Business, Science and Arts Occupations by Sex
Within the Management, Business, Science and Arts occupations in Vernon, the most male-oriented occupations are Business & Financial (100.0%), Computers & Mathematics (100.0%), and Arts, Media & Entertainment (100.0%), while the most female-oriented occupations are Health Diagnosing & Treating (100.0%), Education Instruction & Library (70.0%), and Architecture & Engineering (66.7%).
| Occupation | Male | Female |
| Management | 5 (83.3%) | 1 (16.7%) |
| Business & Financial | 1 (100.0%) | 0 (0.0%) |
| Computers, Engineering & Science | 5 (71.4%) | 2 (28.6%) |
| Computers & Mathematics | 4 (100.0%) | 0 (0.0%) |
| Architecture & Engineering | 1 (33.3%) | 2 (66.7%) |
| Life, Physical & Social Science | 0 (0.0%) | 0 (0.0%) |
| Community & Social Service | 7 (50.0%) | 7 (50.0%) |
| Education, Arts & Media | 0 (0.0%) | 0 (0.0%) |
| Legal Services & Support | 0 (0.0%) | 0 (0.0%) |
| Education Instruction & Library | 3 (30.0%) | 7 (70.0%) |
| Arts, Media & Entertainment | 4 (100.0%) | 0 (0.0%) |
| Health Diagnosing & Treating | 0 (0.0%) | 3 (100.0%) |
| Health Technologists | 0 (0.0%) | 0 (0.0%) |
| Total (Category) | 18 (58.1%) | 13 (41.9%) |
| Total (Overall) | 46 (55.4%) | 37 (44.6%) |
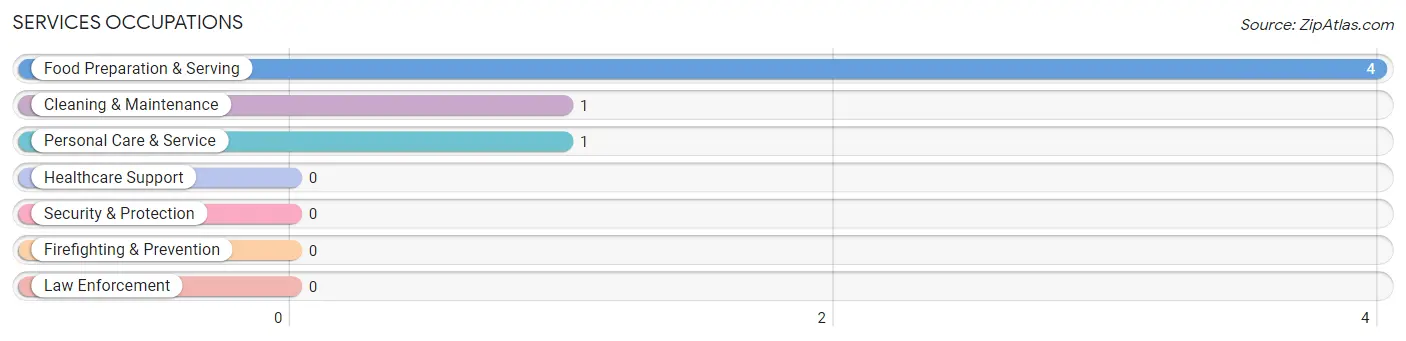
Services Occupations
The most common Services occupations in Vernon are Food Preparation & Serving (4 | 4.8%), Cleaning & Maintenance (1 | 1.2%), and Personal Care & Service (1 | 1.2%).
Services Occupations by Sex
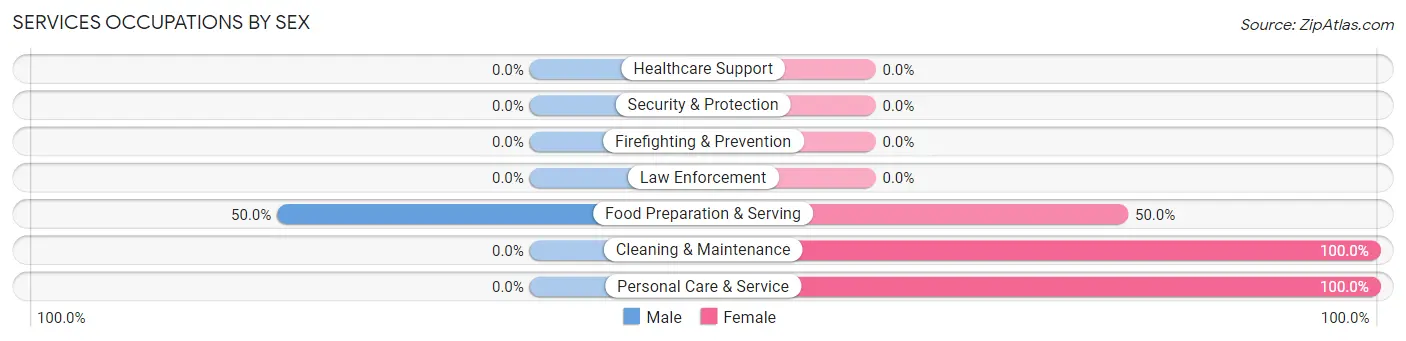
| Occupation | Male | Female |
| Healthcare Support | 0 (0.0%) | 0 (0.0%) |
| Security & Protection | 0 (0.0%) | 0 (0.0%) |
| Firefighting & Prevention | 0 (0.0%) | 0 (0.0%) |
| Law Enforcement | 0 (0.0%) | 0 (0.0%) |
| Food Preparation & Serving | 2 (50.0%) | 2 (50.0%) |
| Cleaning & Maintenance | 0 (0.0%) | 1 (100.0%) |
| Personal Care & Service | 0 (0.0%) | 1 (100.0%) |
| Total (Category) | 2 (33.3%) | 4 (66.7%) |
| Total (Overall) | 46 (55.4%) | 37 (44.6%) |
Sales and Office Occupations
The most common Sales and Office occupations in Vernon are , and Office & Administration (14 | 16.9%).
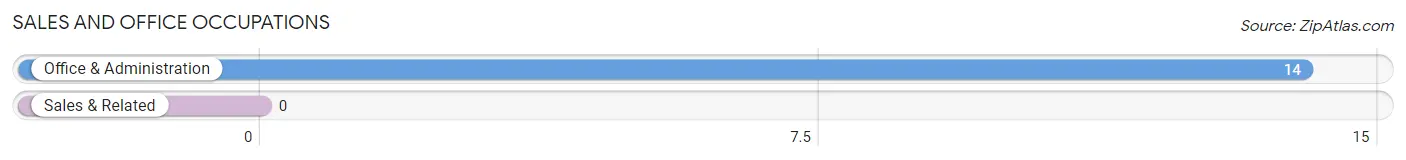
Sales and Office Occupations by Sex
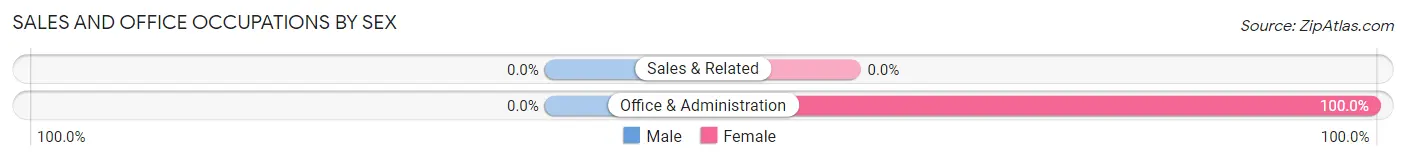
| Occupation | Male | Female |
| Sales & Related | 0 (0.0%) | 0 (0.0%) |
| Office & Administration | 0 (0.0%) | 14 (100.0%) |
| Total (Category) | 0 (0.0%) | 14 (100.0%) |
| Total (Overall) | 46 (55.4%) | 37 (44.6%) |
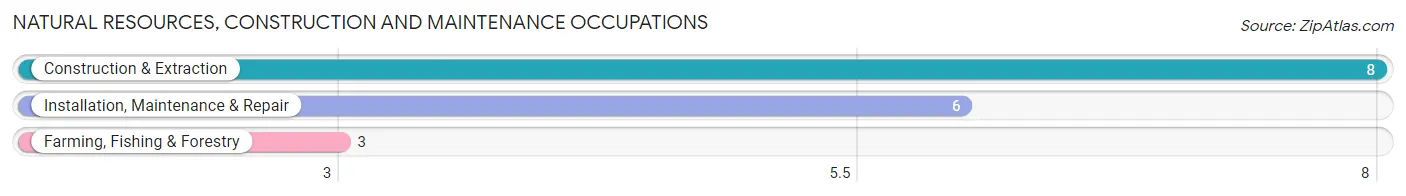
Natural Resources, Construction and Maintenance Occupations
The most common Natural Resources, Construction and Maintenance occupations in Vernon are Construction & Extraction (8 | 9.6%), Installation, Maintenance & Repair (6 | 7.2%), and Farming, Fishing & Forestry (3 | 3.6%).
Natural Resources, Construction and Maintenance Occupations by Sex
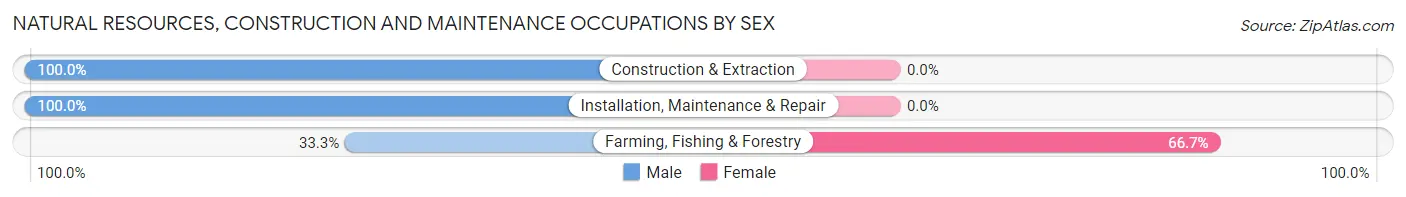
| Occupation | Male | Female |
| Farming, Fishing & Forestry | 1 (33.3%) | 2 (66.7%) |
| Construction & Extraction | 8 (100.0%) | 0 (0.0%) |
| Installation, Maintenance & Repair | 6 (100.0%) | 0 (0.0%) |
| Total (Category) | 15 (88.2%) | 2 (11.8%) |
| Total (Overall) | 46 (55.4%) | 37 (44.6%) |
Production, Transportation and Moving Occupations
The most common Production, Transportation and Moving occupations in Vernon are Production (11 | 13.3%), and Transportation (4 | 4.8%).
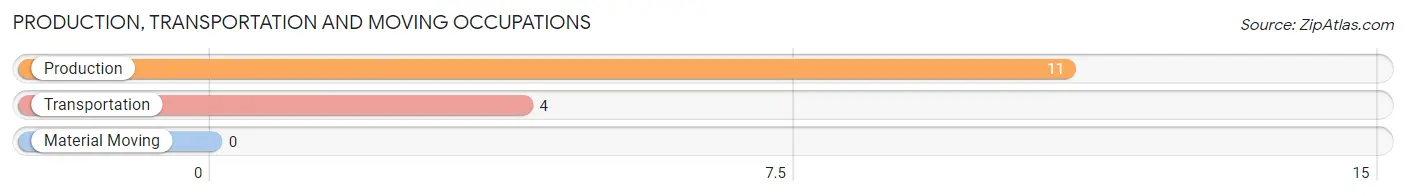
Production, Transportation and Moving Occupations by Sex
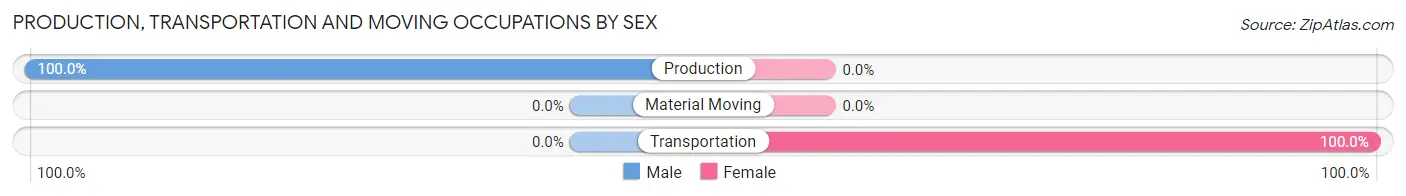
| Occupation | Male | Female |
| Production | 11 (100.0%) | 0 (0.0%) |
| Transportation | 0 (0.0%) | 4 (100.0%) |
| Material Moving | 0 (0.0%) | 0 (0.0%) |
| Total (Category) | 11 (73.3%) | 4 (26.7%) |
| Total (Overall) | 46 (55.4%) | 37 (44.6%) |
Employment Industries by Sex in Vernon
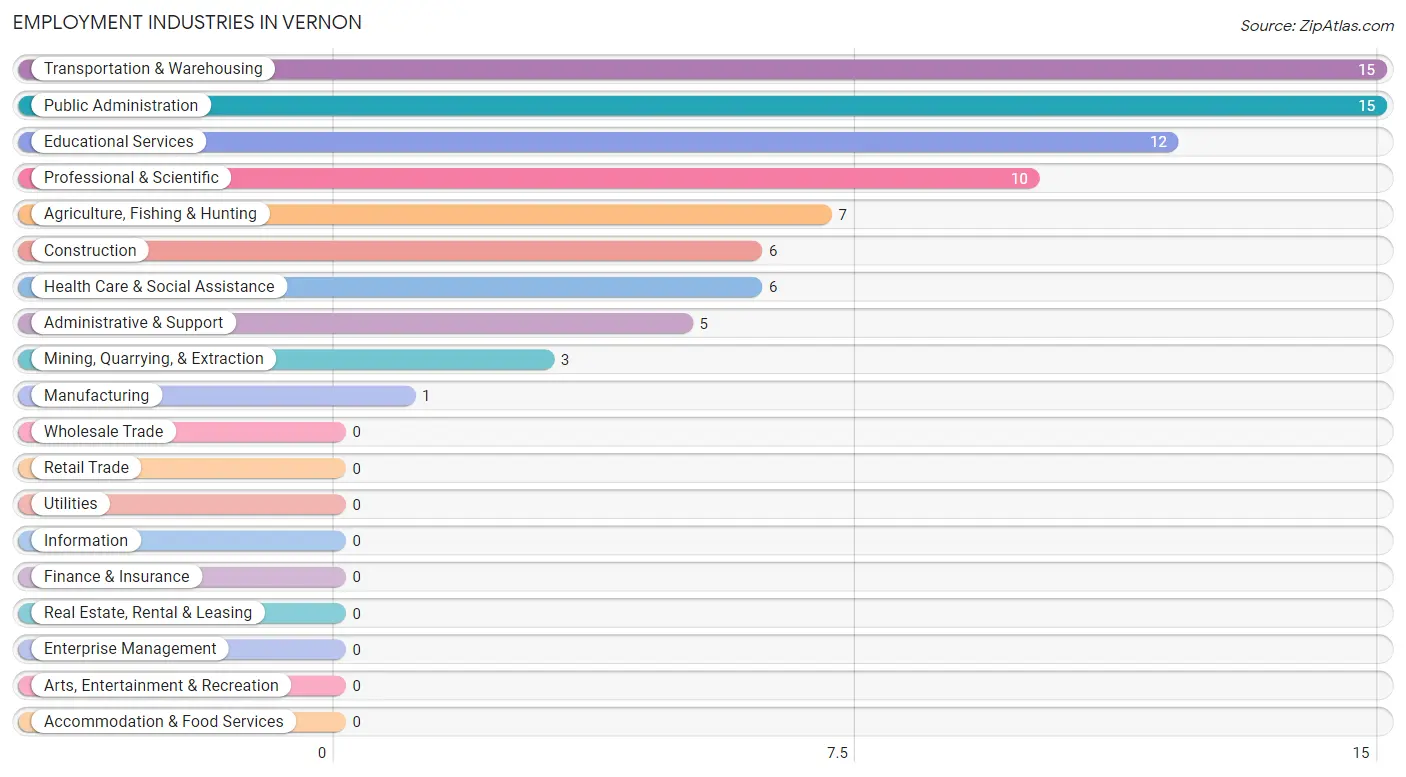
Employment Industries in Vernon
The major employment industries in Vernon include Transportation & Warehousing (15 | 18.1%), Public Administration (15 | 18.1%), Educational Services (12 | 14.5%), Professional & Scientific (10 | 12.0%), and Agriculture, Fishing & Hunting (7 | 8.4%).
Employment Industries by Sex in Vernon
The Vernon industries that see more men than women are Mining, Quarrying, & Extraction (100.0%), Construction (100.0%), and Manufacturing (100.0%), whereas the industries that tend to have a higher number of women are Transportation & Warehousing (100.0%), Health Care & Social Assistance (100.0%), and Educational Services (75.0%).
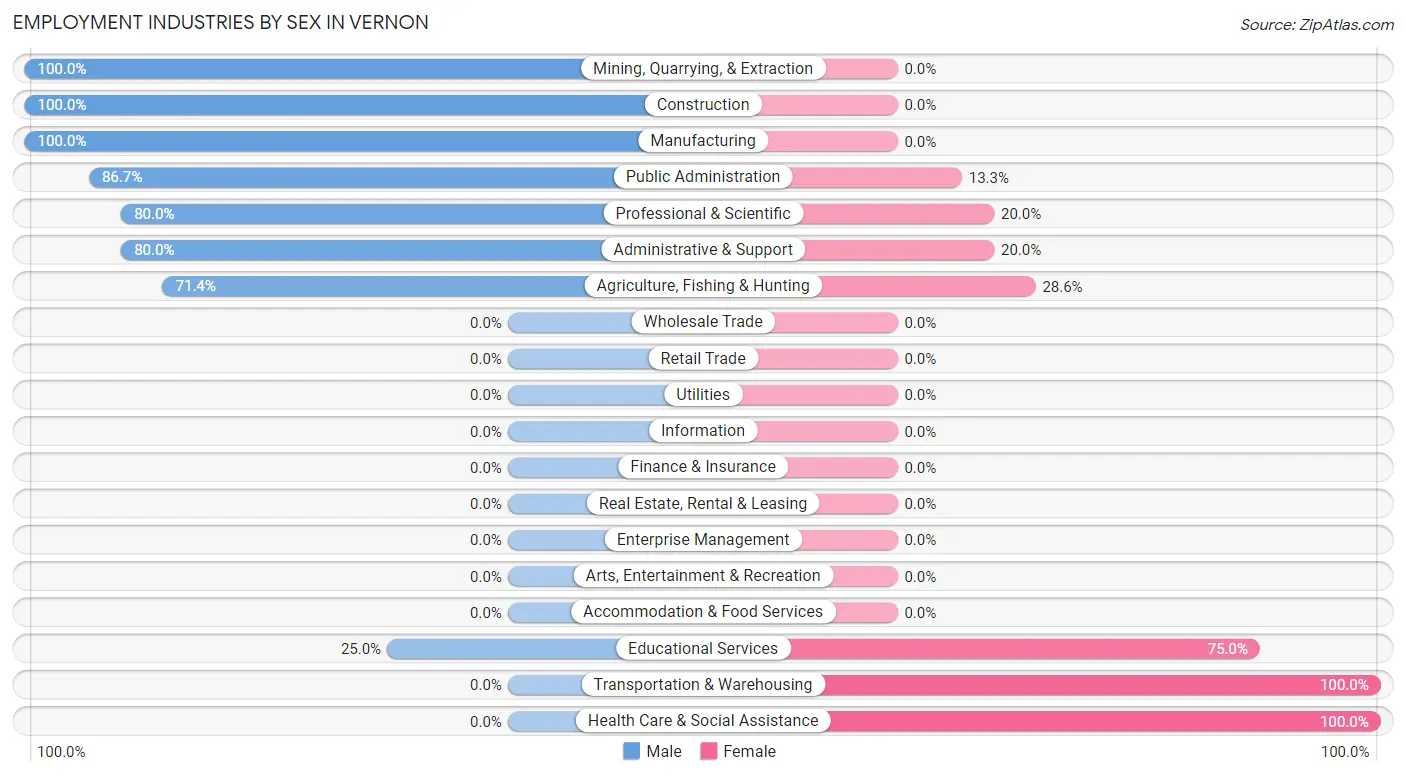
| Industry | Male | Female |
| Agriculture, Fishing & Hunting | 5 (71.4%) | 2 (28.6%) |
| Mining, Quarrying, & Extraction | 3 (100.0%) | 0 (0.0%) |
| Construction | 6 (100.0%) | 0 (0.0%) |
| Manufacturing | 1 (100.0%) | 0 (0.0%) |
| Wholesale Trade | 0 (0.0%) | 0 (0.0%) |
| Retail Trade | 0 (0.0%) | 0 (0.0%) |
| Transportation & Warehousing | 0 (0.0%) | 15 (100.0%) |
| Utilities | 0 (0.0%) | 0 (0.0%) |
| Information | 0 (0.0%) | 0 (0.0%) |
| Finance & Insurance | 0 (0.0%) | 0 (0.0%) |
| Real Estate, Rental & Leasing | 0 (0.0%) | 0 (0.0%) |
| Professional & Scientific | 8 (80.0%) | 2 (20.0%) |
| Enterprise Management | 0 (0.0%) | 0 (0.0%) |
| Administrative & Support | 4 (80.0%) | 1 (20.0%) |
| Educational Services | 3 (25.0%) | 9 (75.0%) |
| Health Care & Social Assistance | 0 (0.0%) | 6 (100.0%) |
| Arts, Entertainment & Recreation | 0 (0.0%) | 0 (0.0%) |
| Accommodation & Food Services | 0 (0.0%) | 0 (0.0%) |
| Public Administration | 13 (86.7%) | 2 (13.3%) |
| Total | 46 (55.4%) | 37 (44.6%) |
Education in Vernon
School Enrollment in Vernon
The most common levels of schooling among the 65 students in Vernon are high school (23 | 35.4%), elementary school (16 | 24.6%), and middle school (10 | 15.4%).
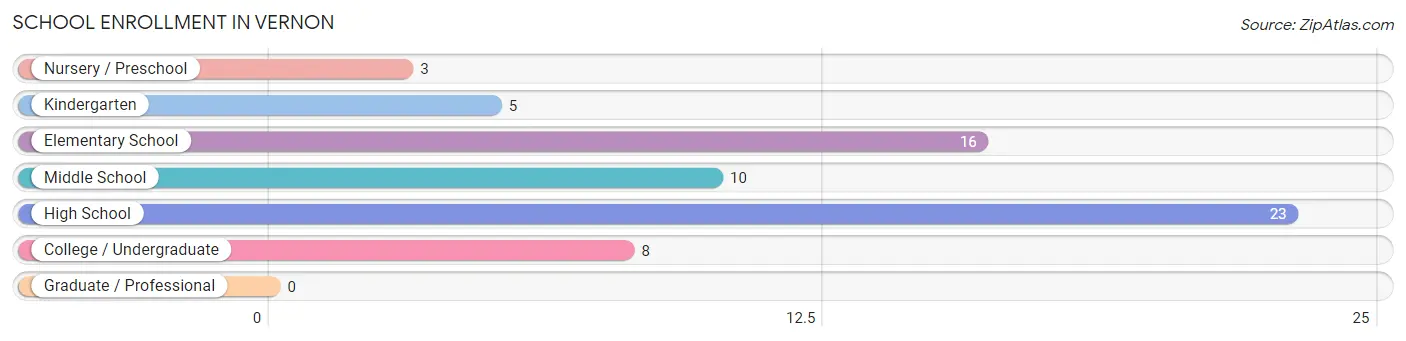
| School Level | # Students | % Students |
| Nursery / Preschool | 3 | 4.6% |
| Kindergarten | 5 | 7.7% |
| Elementary School | 16 | 24.6% |
| Middle School | 10 | 15.4% |
| High School | 23 | 35.4% |
| College / Undergraduate | 8 | 12.3% |
| Graduate / Professional | 0 | 0.0% |
| Total | 65 | 100.0% |
School Enrollment by Age by Funding Source in Vernon
Out of a total of 65 students who are enrolled in schools in Vernon, 16 (24.6%) attend a private institution, while the remaining 49 (75.4%) are enrolled in public schools. The age group of 18 to 19 year olds has the highest likelihood of being enrolled in private schools, with 3 (60.0% in the age bracket) enrolled. Conversely, the age group of 3 to 4 year olds has the lowest likelihood of being enrolled in a private school, with 3 (100.0% in the age bracket) attending a public institution.
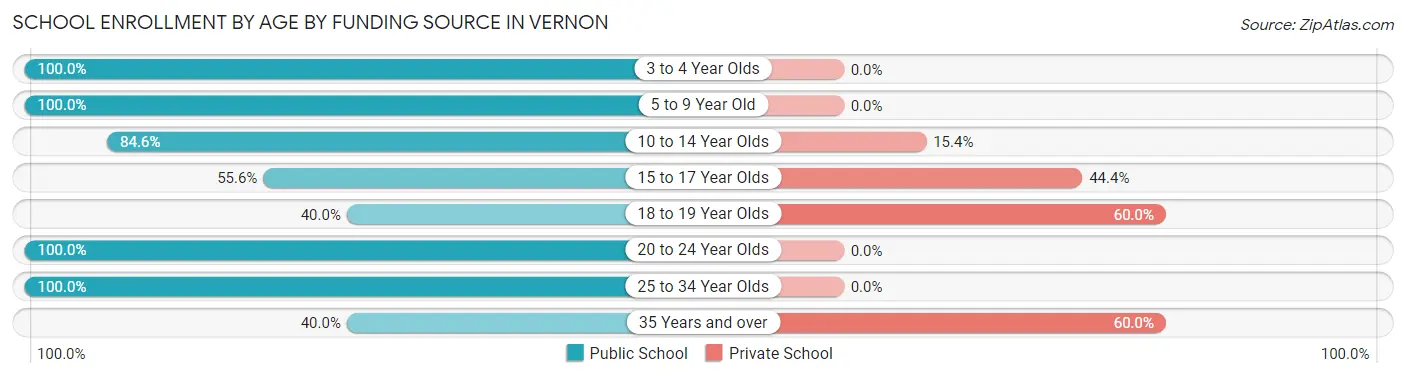
| Age Bracket | Public School | Private School |
| 3 to 4 Year Olds | 3 (100.0%) | 0 (0.0%) |
| 5 to 9 Year Old | 18 (100.0%) | 0 (0.0%) |
| 10 to 14 Year Olds | 11 (84.6%) | 2 (15.4%) |
| 15 to 17 Year Olds | 10 (55.6%) | 8 (44.4%) |
| 18 to 19 Year Olds | 2 (40.0%) | 3 (60.0%) |
| 20 to 24 Year Olds | 1 (100.0%) | 0 (0.0%) |
| 25 to 34 Year Olds | 2 (100.0%) | 0 (0.0%) |
| 35 Years and over | 2 (40.0%) | 3 (60.0%) |
| Total | 49 (75.4%) | 16 (24.6%) |
Educational Attainment by Field of Study in Vernon
Education (8 | 42.1%), arts & humanities (4 | 21.0%), science & technology (3 | 15.8%), computers & mathematics (2 | 10.5%), and bio, nature & agricultural (1 | 5.3%) are the most common fields of study among 19 individuals in Vernon who have obtained a bachelor's degree or higher.
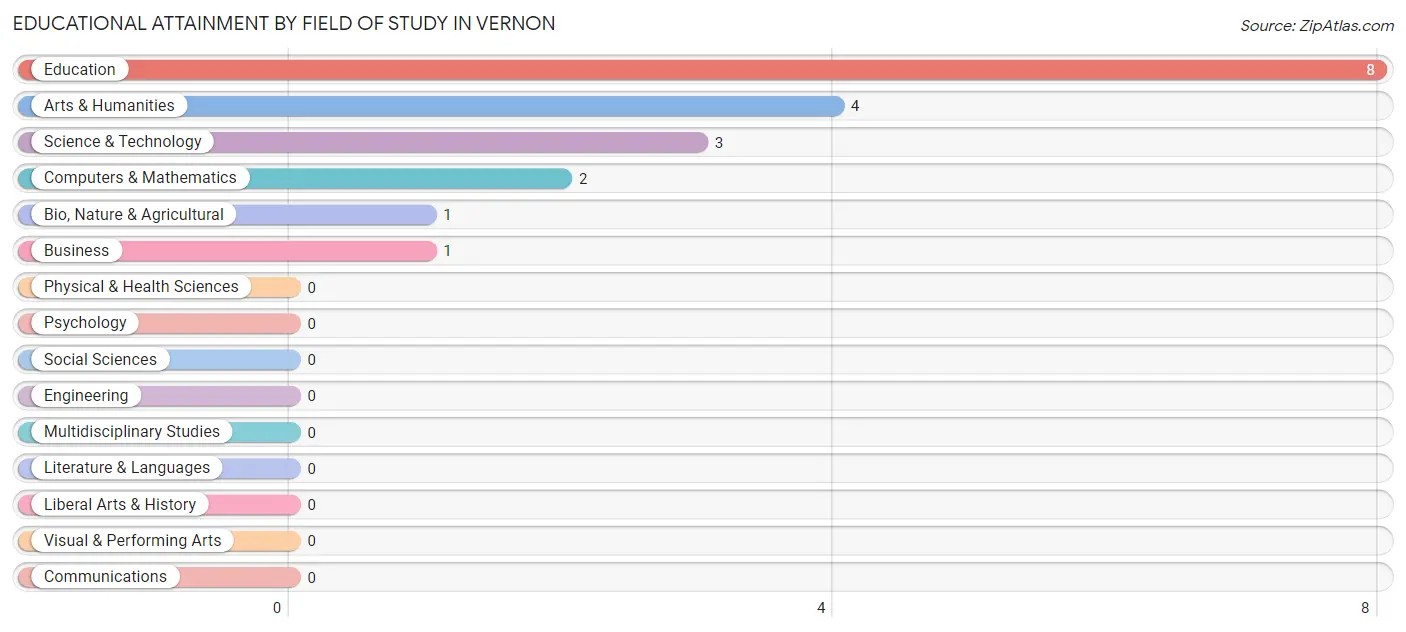
| Field of Study | # Graduates | % Graduates |
| Computers & Mathematics | 2 | 10.5% |
| Bio, Nature & Agricultural | 1 | 5.3% |
| Physical & Health Sciences | 0 | 0.0% |
| Psychology | 0 | 0.0% |
| Social Sciences | 0 | 0.0% |
| Engineering | 0 | 0.0% |
| Multidisciplinary Studies | 0 | 0.0% |
| Science & Technology | 3 | 15.8% |
| Business | 1 | 5.3% |
| Education | 8 | 42.1% |
| Literature & Languages | 0 | 0.0% |
| Liberal Arts & History | 0 | 0.0% |
| Visual & Performing Arts | 0 | 0.0% |
| Communications | 0 | 0.0% |
| Arts & Humanities | 4 | 21.0% |
| Total | 19 | 100.0% |
Transportation & Commute in Vernon
Vehicle Availability by Sex in Vernon
The most prevalent vehicle ownership categories in Vernon are males with 2 vehicles (21, accounting for 45.7%) and females with 2 vehicles (15, making up 56.8%).
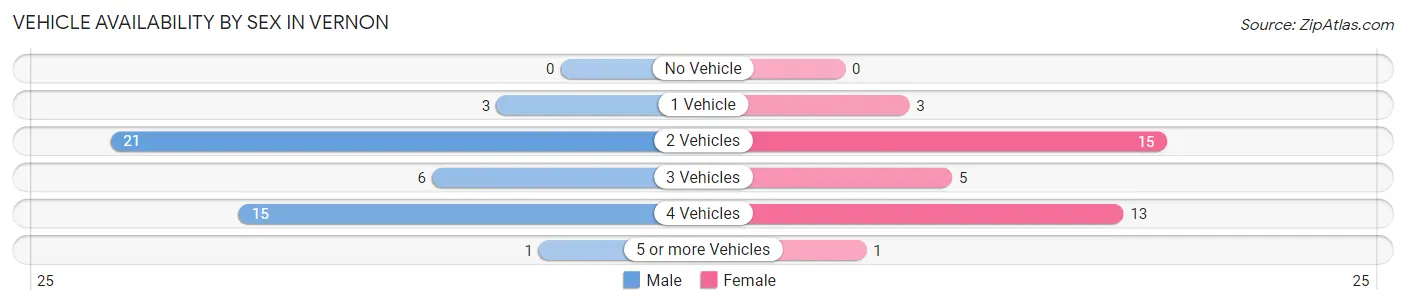
| Vehicles Available | Male | Female |
| No Vehicle | 0 (0.0%) | 0 (0.0%) |
| 1 Vehicle | 3 (6.5%) | 3 (8.1%) |
| 2 Vehicles | 21 (45.7%) | 15 (40.5%) |
| 3 Vehicles | 6 (13.0%) | 5 (13.5%) |
| 4 Vehicles | 15 (32.6%) | 13 (35.1%) |
| 5 or more Vehicles | 1 (2.2%) | 1 (2.7%) |
| Total | 46 (100.0%) | 37 (100.0%) |
Commute Time in Vernon
The most frequently occuring commute durations in Vernon are 45 to 59 minutes (22 commuters, 29.7%), 60 to 89 minutes (11 commuters, 14.9%), and 10 to 14 minutes (8 commuters, 10.8%).
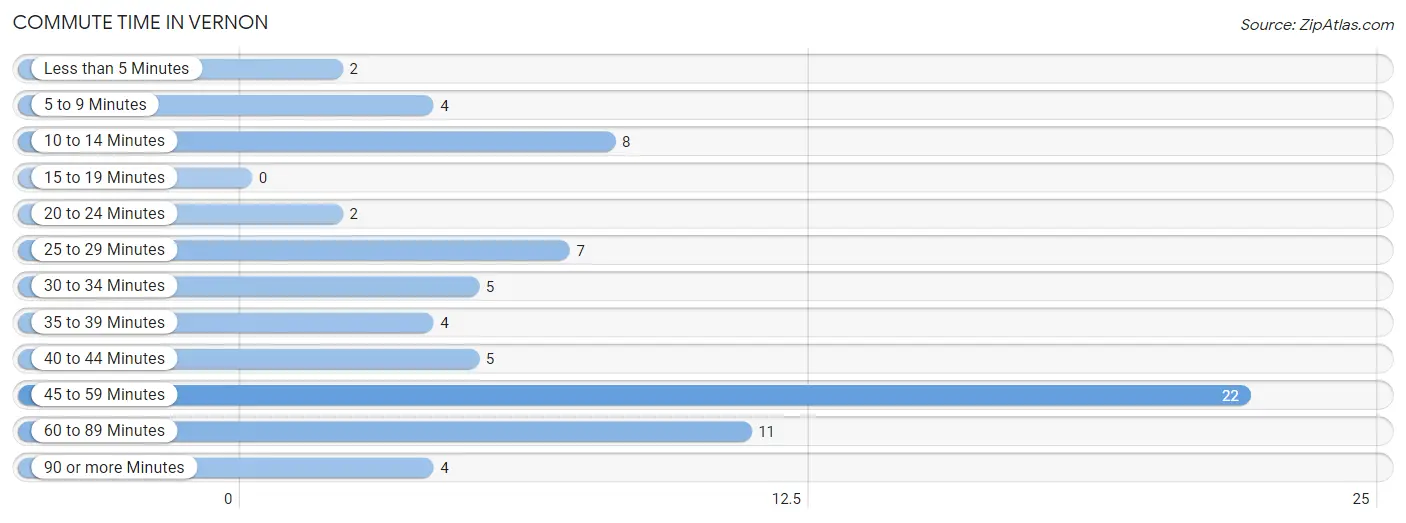
| Commute Time | # Commuters | % Commuters |
| Less than 5 Minutes | 2 | 2.7% |
| 5 to 9 Minutes | 4 | 5.4% |
| 10 to 14 Minutes | 8 | 10.8% |
| 15 to 19 Minutes | 0 | 0.0% |
| 20 to 24 Minutes | 2 | 2.7% |
| 25 to 29 Minutes | 7 | 9.5% |
| 30 to 34 Minutes | 5 | 6.8% |
| 35 to 39 Minutes | 4 | 5.4% |
| 40 to 44 Minutes | 5 | 6.8% |
| 45 to 59 Minutes | 22 | 29.7% |
| 60 to 89 Minutes | 11 | 14.9% |
| 90 or more Minutes | 4 | 5.4% |
Commute Time by Sex in Vernon
The most common commute times in Vernon are 45 to 59 minutes (15 commuters, 36.6%) for males and 10 to 14 minutes (8 commuters, 24.2%) for females.
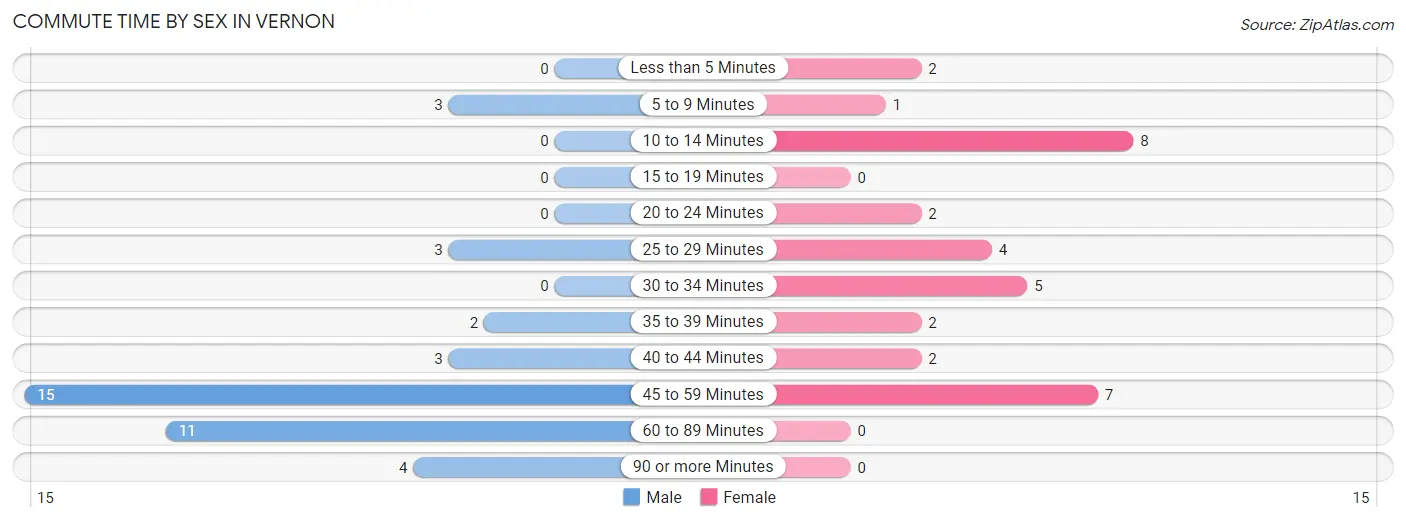
| Commute Time | Male | Female |
| Less than 5 Minutes | 0 (0.0%) | 2 (6.1%) |
| 5 to 9 Minutes | 3 (7.3%) | 1 (3.0%) |
| 10 to 14 Minutes | 0 (0.0%) | 8 (24.2%) |
| 15 to 19 Minutes | 0 (0.0%) | 0 (0.0%) |
| 20 to 24 Minutes | 0 (0.0%) | 2 (6.1%) |
| 25 to 29 Minutes | 3 (7.3%) | 4 (12.1%) |
| 30 to 34 Minutes | 0 (0.0%) | 5 (15.1%) |
| 35 to 39 Minutes | 2 (4.9%) | 2 (6.1%) |
| 40 to 44 Minutes | 3 (7.3%) | 2 (6.1%) |
| 45 to 59 Minutes | 15 (36.6%) | 7 (21.2%) |
| 60 to 89 Minutes | 11 (26.8%) | 0 (0.0%) |
| 90 or more Minutes | 4 (9.8%) | 0 (0.0%) |
Time of Departure to Work by Sex in Vernon
The most frequent times of departure to work in Vernon are 5:30 AM to 5:59 AM (11, 26.8%) for males and 7:00 AM to 7:29 AM (8, 24.2%) for females.
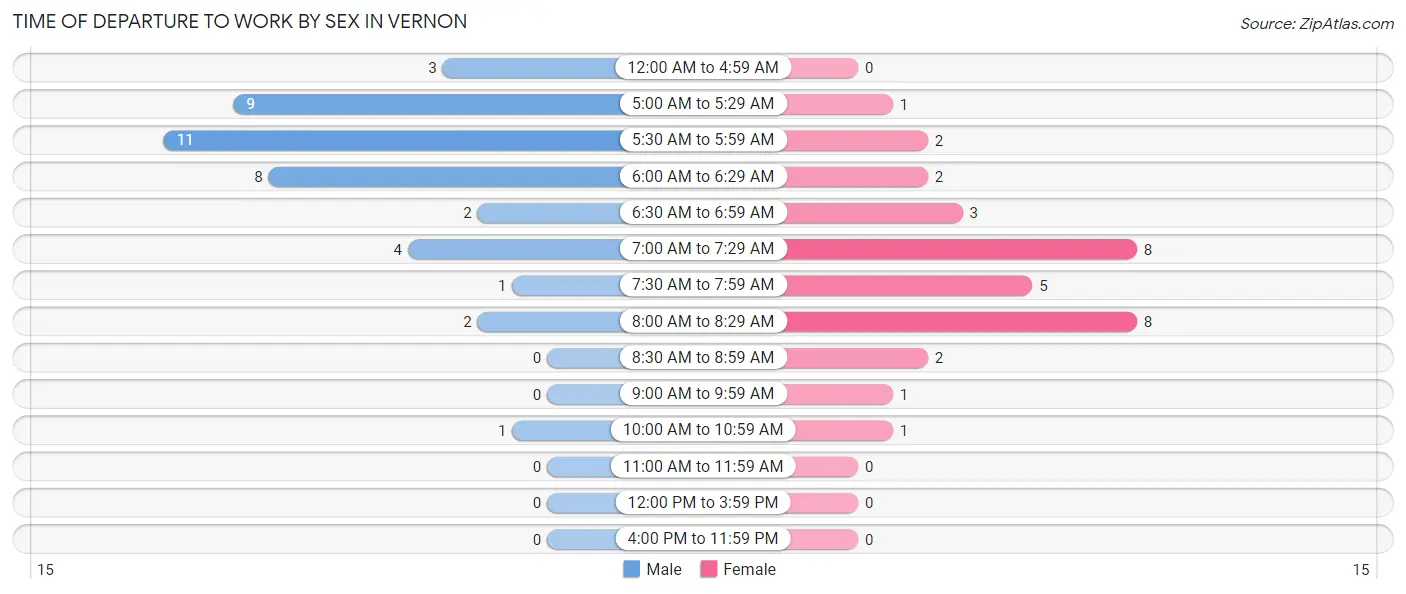
| Time of Departure | Male | Female |
| 12:00 AM to 4:59 AM | 3 (7.3%) | 0 (0.0%) |
| 5:00 AM to 5:29 AM | 9 (22.0%) | 1 (3.0%) |
| 5:30 AM to 5:59 AM | 11 (26.8%) | 2 (6.1%) |
| 6:00 AM to 6:29 AM | 8 (19.5%) | 2 (6.1%) |
| 6:30 AM to 6:59 AM | 2 (4.9%) | 3 (9.1%) |
| 7:00 AM to 7:29 AM | 4 (9.8%) | 8 (24.2%) |
| 7:30 AM to 7:59 AM | 1 (2.4%) | 5 (15.1%) |
| 8:00 AM to 8:29 AM | 2 (4.9%) | 8 (24.2%) |
| 8:30 AM to 8:59 AM | 0 (0.0%) | 2 (6.1%) |
| 9:00 AM to 9:59 AM | 0 (0.0%) | 1 (3.0%) |
| 10:00 AM to 10:59 AM | 1 (2.4%) | 1 (3.0%) |
| 11:00 AM to 11:59 AM | 0 (0.0%) | 0 (0.0%) |
| 12:00 PM to 3:59 PM | 0 (0.0%) | 0 (0.0%) |
| 4:00 PM to 11:59 PM | 0 (0.0%) | 0 (0.0%) |
| Total | 41 (100.0%) | 33 (100.0%) |
Housing Occupancy in Vernon
Occupancy by Ownership in Vernon
Of the total 87 dwellings in Vernon, owner-occupied units account for 74 (85.1%), while renter-occupied units make up 13 (14.9%).
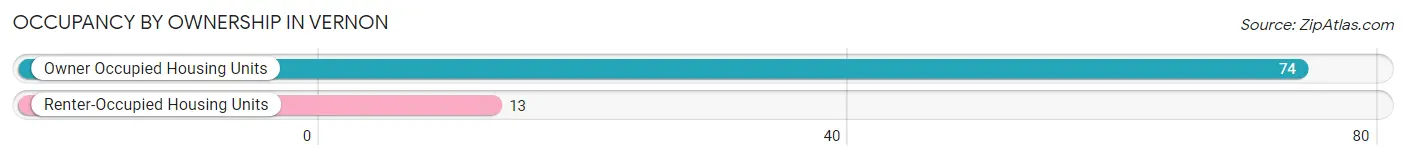
| Occupancy | # Housing Units | % Housing Units |
| Owner Occupied Housing Units | 74 | 85.1% |
| Renter-Occupied Housing Units | 13 | 14.9% |
| Total Occupied Housing Units | 87 | 100.0% |
Occupancy by Household Size in Vernon
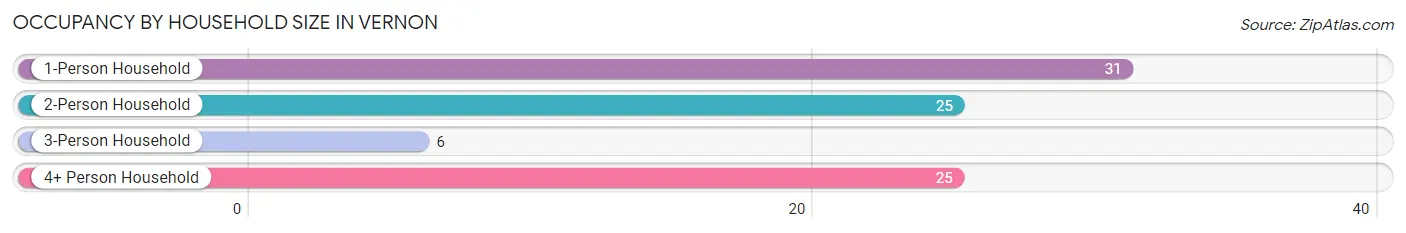
| Household Size | # Housing Units | % Housing Units |
| 1-Person Household | 31 | 35.6% |
| 2-Person Household | 25 | 28.7% |
| 3-Person Household | 6 | 6.9% |
| 4+ Person Household | 25 | 28.7% |
| Total Housing Units | 87 | 100.0% |
Occupancy by Ownership by Household Size in Vernon
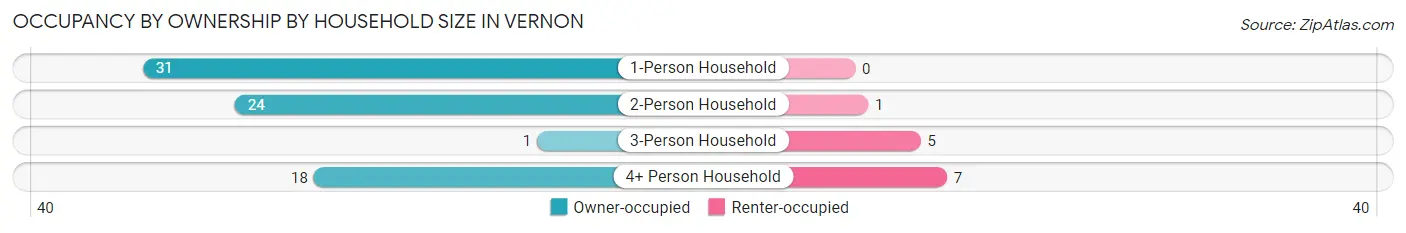
| Household Size | Owner-occupied | Renter-occupied |
| 1-Person Household | 31 (100.0%) | 0 (0.0%) |
| 2-Person Household | 24 (96.0%) | 1 (4.0%) |
| 3-Person Household | 1 (16.7%) | 5 (83.3%) |
| 4+ Person Household | 18 (72.0%) | 7 (28.0%) |
| Total Housing Units | 74 (85.1%) | 13 (14.9%) |
Occupancy by Educational Attainment in Vernon
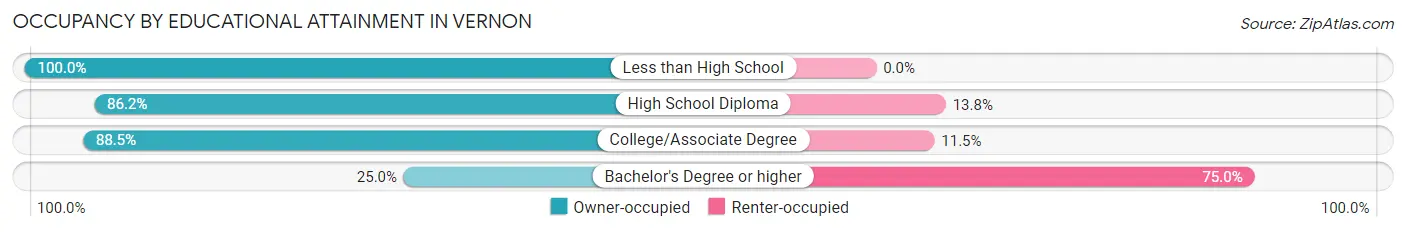
| Household Size | Owner-occupied | Renter-occupied |
| Less than High School | 2 (100.0%) | 0 (0.0%) |
| High School Diploma | 25 (86.2%) | 4 (13.8%) |
| College/Associate Degree | 46 (88.5%) | 6 (11.5%) |
| Bachelor's Degree or higher | 1 (25.0%) | 3 (75.0%) |
Occupancy by Age of Householder in Vernon
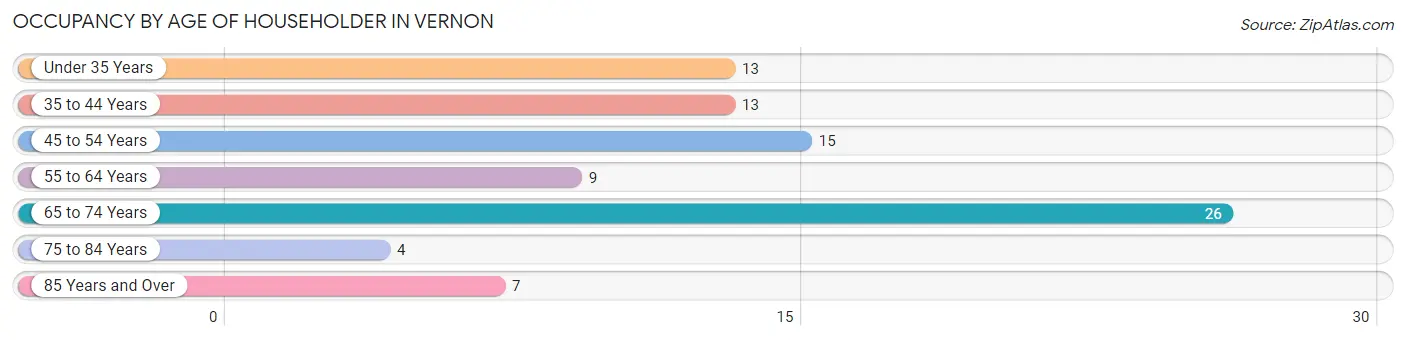
| Age Bracket | # Households | % Households |
| Under 35 Years | 13 | 14.9% |
| 35 to 44 Years | 13 | 14.9% |
| 45 to 54 Years | 15 | 17.2% |
| 55 to 64 Years | 9 | 10.3% |
| 65 to 74 Years | 26 | 29.9% |
| 75 to 84 Years | 4 | 4.6% |
| 85 Years and Over | 7 | 8.1% |
| Total | 87 | 100.0% |
Housing Finances in Vernon
Median Income by Occupancy in Vernon
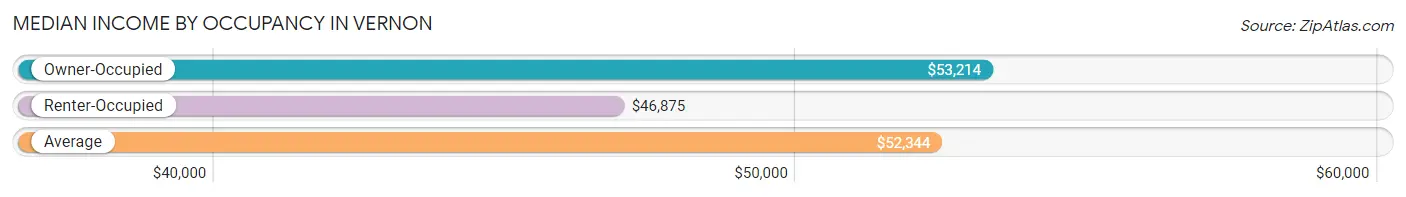
| Occupancy Type | # Households | Median Income |
| Owner-Occupied | 74 (85.1%) | $53,214 |
| Renter-Occupied | 13 (14.9%) | $46,875 |
| Average | 87 (100.0%) | $52,344 |
Occupancy by Householder Income Bracket in Vernon
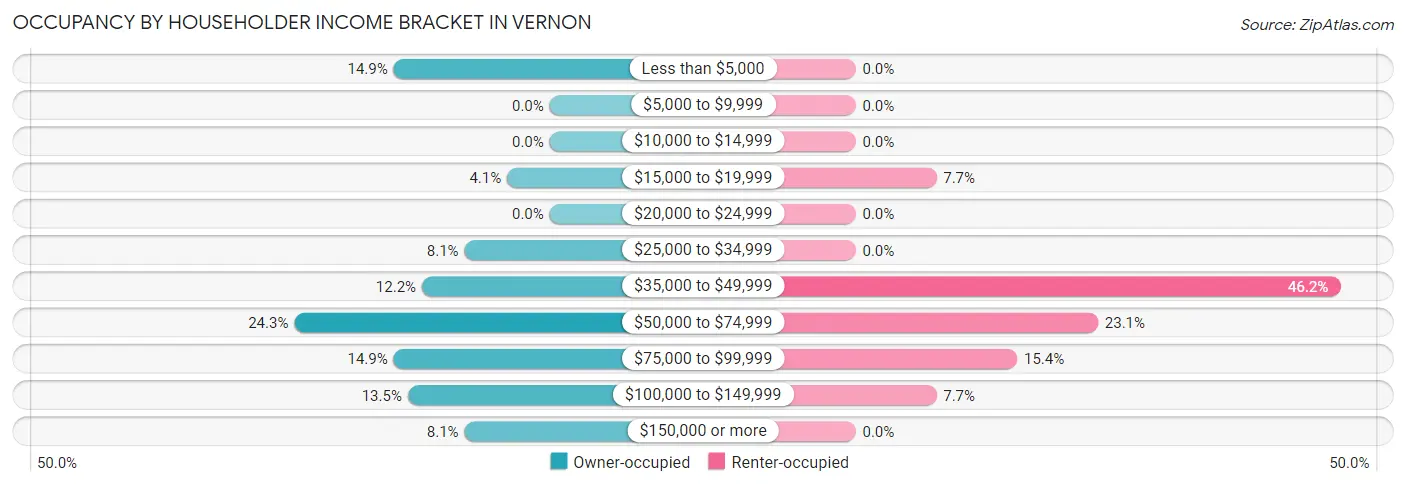
| Income Bracket | Owner-occupied | Renter-occupied |
| Less than $5,000 | 11 (14.9%) | 0 (0.0%) |
| $5,000 to $9,999 | 0 (0.0%) | 0 (0.0%) |
| $10,000 to $14,999 | 0 (0.0%) | 0 (0.0%) |
| $15,000 to $19,999 | 3 (4.1%) | 1 (7.7%) |
| $20,000 to $24,999 | 0 (0.0%) | 0 (0.0%) |
| $25,000 to $34,999 | 6 (8.1%) | 0 (0.0%) |
| $35,000 to $49,999 | 9 (12.2%) | 6 (46.2%) |
| $50,000 to $74,999 | 18 (24.3%) | 3 (23.1%) |
| $75,000 to $99,999 | 11 (14.9%) | 2 (15.4%) |
| $100,000 to $149,999 | 10 (13.5%) | 1 (7.7%) |
| $150,000 or more | 6 (8.1%) | 0 (0.0%) |
| Total | 74 (100.0%) | 13 (100.0%) |
Monthly Housing Cost Tiers in Vernon
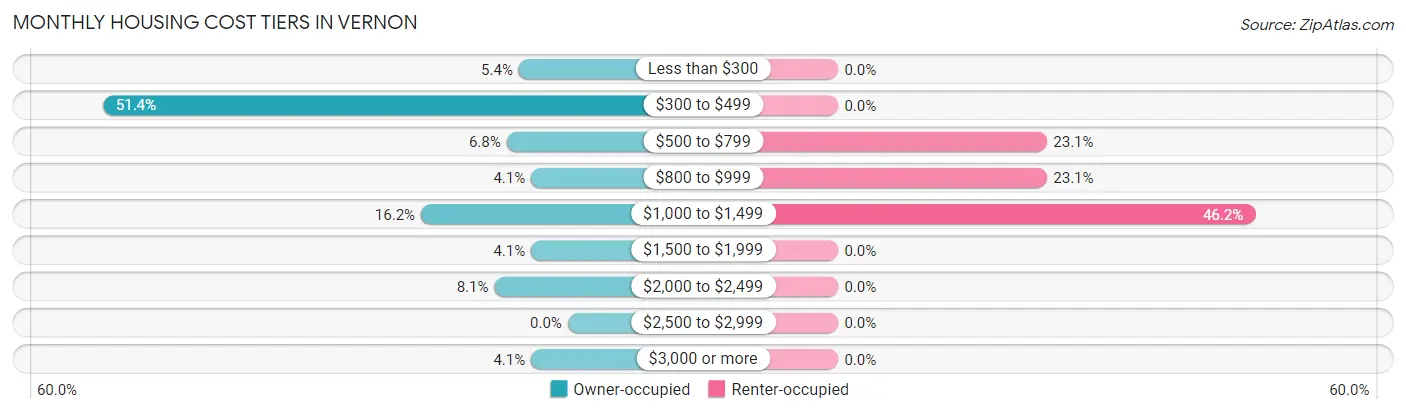
| Monthly Cost | Owner-occupied | Renter-occupied |
| Less than $300 | 4 (5.4%) | 0 (0.0%) |
| $300 to $499 | 38 (51.3%) | 0 (0.0%) |
| $500 to $799 | 5 (6.8%) | 3 (23.1%) |
| $800 to $999 | 3 (4.1%) | 3 (23.1%) |
| $1,000 to $1,499 | 12 (16.2%) | 6 (46.2%) |
| $1,500 to $1,999 | 3 (4.1%) | 0 (0.0%) |
| $2,000 to $2,499 | 6 (8.1%) | 0 (0.0%) |
| $2,500 to $2,999 | 0 (0.0%) | 0 (0.0%) |
| $3,000 or more | 3 (4.1%) | 0 (0.0%) |
| Total | 74 (100.0%) | 13 (100.0%) |
Physical Housing Characteristics in Vernon
Housing Structures in Vernon
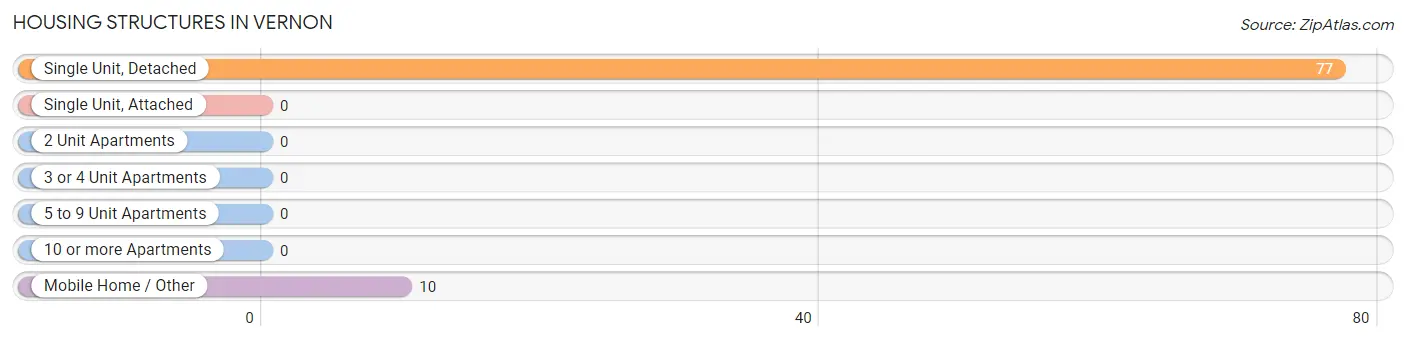
| Structure Type | # Housing Units | % Housing Units |
| Single Unit, Detached | 77 | 88.5% |
| Single Unit, Attached | 0 | 0.0% |
| 2 Unit Apartments | 0 | 0.0% |
| 3 or 4 Unit Apartments | 0 | 0.0% |
| 5 to 9 Unit Apartments | 0 | 0.0% |
| 10 or more Apartments | 0 | 0.0% |
| Mobile Home / Other | 10 | 11.5% |
| Total | 87 | 100.0% |
Housing Structures by Occupancy in Vernon
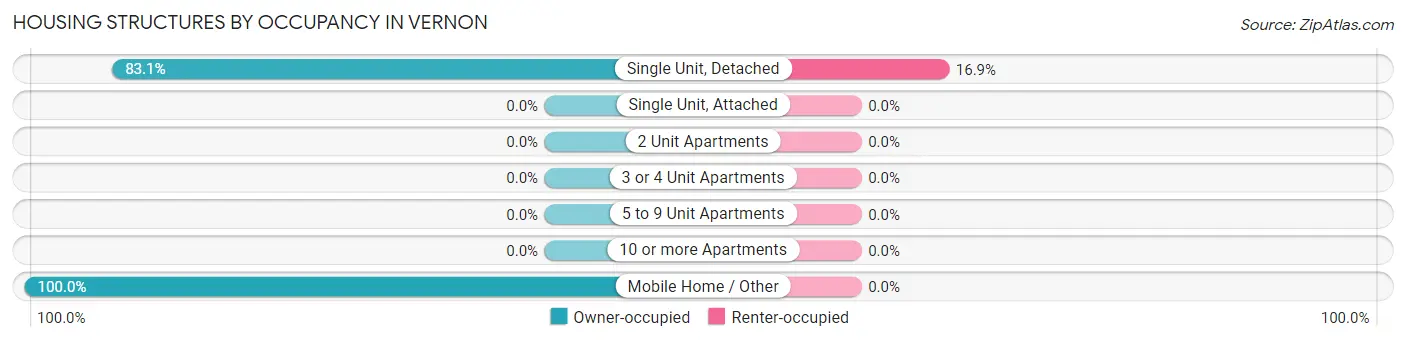
| Structure Type | Owner-occupied | Renter-occupied |
| Single Unit, Detached | 64 (83.1%) | 13 (16.9%) |
| Single Unit, Attached | 0 (0.0%) | 0 (0.0%) |
| 2 Unit Apartments | 0 (0.0%) | 0 (0.0%) |
| 3 or 4 Unit Apartments | 0 (0.0%) | 0 (0.0%) |
| 5 to 9 Unit Apartments | 0 (0.0%) | 0 (0.0%) |
| 10 or more Apartments | 0 (0.0%) | 0 (0.0%) |
| Mobile Home / Other | 10 (100.0%) | 0 (0.0%) |
| Total | 74 (85.1%) | 13 (14.9%) |
Housing Structures by Number of Rooms in Vernon
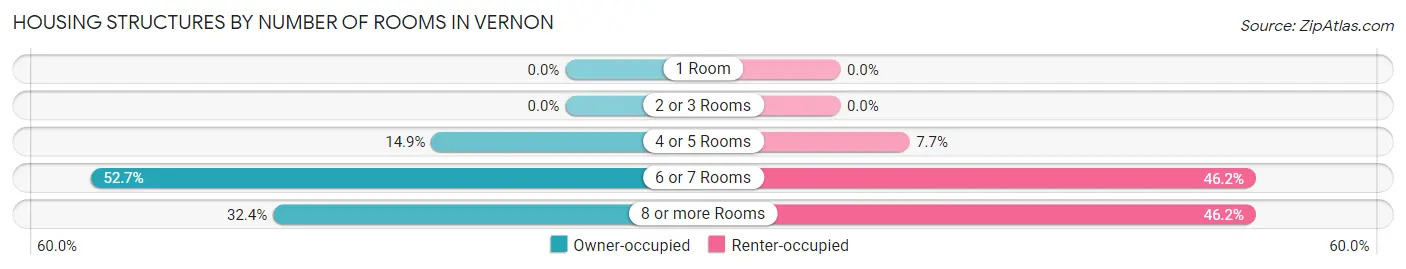
| Number of Rooms | Owner-occupied | Renter-occupied |
| 1 Room | 0 (0.0%) | 0 (0.0%) |
| 2 or 3 Rooms | 0 (0.0%) | 0 (0.0%) |
| 4 or 5 Rooms | 11 (14.9%) | 1 (7.7%) |
| 6 or 7 Rooms | 39 (52.7%) | 6 (46.2%) |
| 8 or more Rooms | 24 (32.4%) | 6 (46.2%) |
| Total | 74 (100.0%) | 13 (100.0%) |
Housing Structure by Heating Type in Vernon
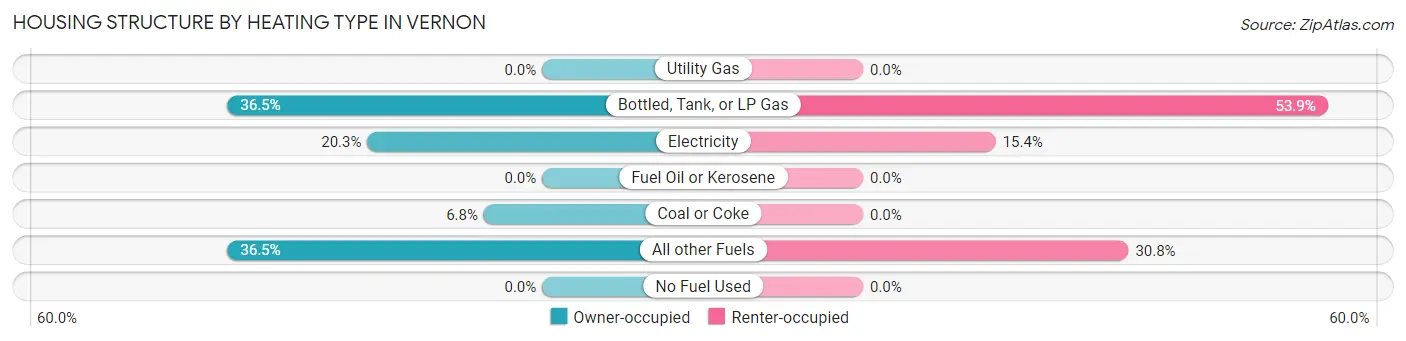
| Heating Type | Owner-occupied | Renter-occupied |
| Utility Gas | 0 (0.0%) | 0 (0.0%) |
| Bottled, Tank, or LP Gas | 27 (36.5%) | 7 (53.8%) |
| Electricity | 15 (20.3%) | 2 (15.4%) |
| Fuel Oil or Kerosene | 0 (0.0%) | 0 (0.0%) |
| Coal or Coke | 5 (6.8%) | 0 (0.0%) |
| All other Fuels | 27 (36.5%) | 4 (30.8%) |
| No Fuel Used | 0 (0.0%) | 0 (0.0%) |
| Total | 74 (100.0%) | 13 (100.0%) |
Household Vehicle Usage in Vernon
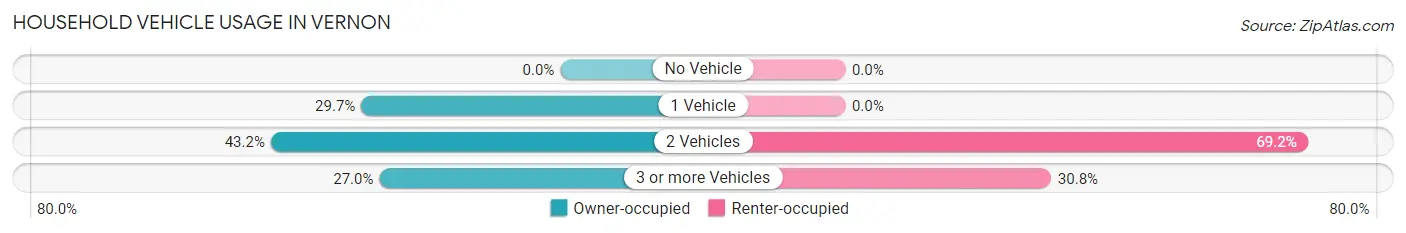
| Vehicles per Household | Owner-occupied | Renter-occupied |
| No Vehicle | 0 (0.0%) | 0 (0.0%) |
| 1 Vehicle | 22 (29.7%) | 0 (0.0%) |
| 2 Vehicles | 32 (43.2%) | 9 (69.2%) |
| 3 or more Vehicles | 20 (27.0%) | 4 (30.8%) |
| Total | 74 (100.0%) | 13 (100.0%) |
Real Estate & Mortgages in Vernon
Real Estate and Mortgage Overview in Vernon
| Characteristic | Without Mortgage | With Mortgage |
| Housing Units | 48 | 26 |
| Median Property Value | $187,500 | $300,000 |
| Median Household Income | $50,417 | $3 |
| Monthly Housing Costs | $379 | $3 |
| Real Estate Taxes | $933 | $3 |
Property Value by Mortgage Status in Vernon
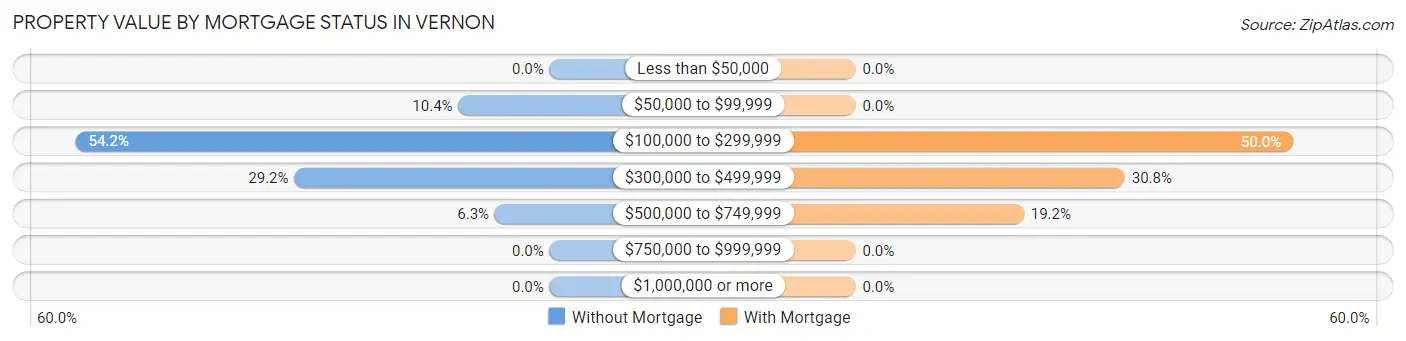
| Property Value | Without Mortgage | With Mortgage |
| Less than $50,000 | 0 (0.0%) | 0 (0.0%) |
| $50,000 to $99,999 | 5 (10.4%) | 0 (0.0%) |
| $100,000 to $299,999 | 26 (54.2%) | 13 (50.0%) |
| $300,000 to $499,999 | 14 (29.2%) | 8 (30.8%) |
| $500,000 to $749,999 | 3 (6.2%) | 5 (19.2%) |
| $750,000 to $999,999 | 0 (0.0%) | 0 (0.0%) |
| $1,000,000 or more | 0 (0.0%) | 0 (0.0%) |
| Total | 48 (100.0%) | 26 (100.0%) |
Household Income by Mortgage Status in Vernon
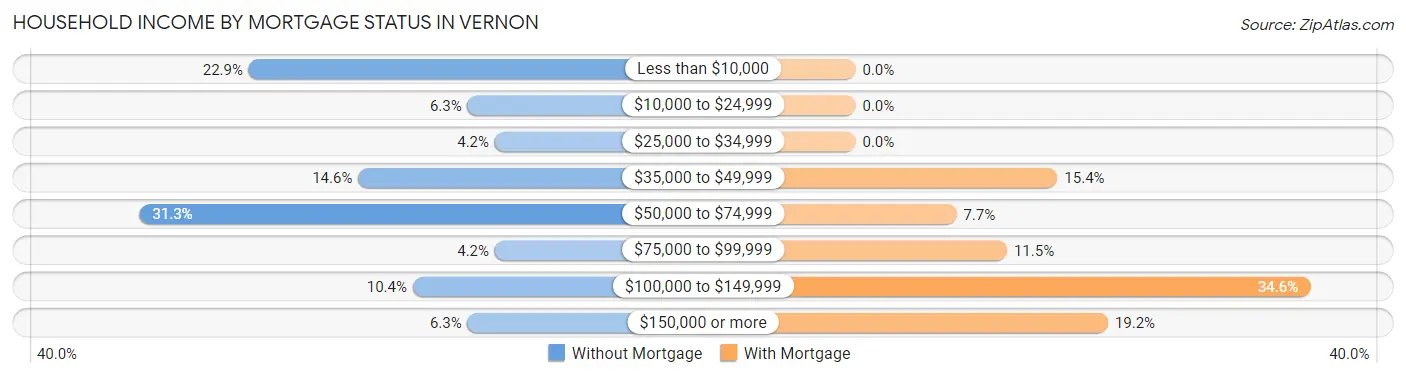
| Household Income | Without Mortgage | With Mortgage |
| Less than $10,000 | 11 (22.9%) | 0 (0.0%) |
| $10,000 to $24,999 | 3 (6.2%) | 0 (0.0%) |
| $25,000 to $34,999 | 2 (4.2%) | 0 (0.0%) |
| $35,000 to $49,999 | 7 (14.6%) | 4 (15.4%) |
| $50,000 to $74,999 | 15 (31.2%) | 2 (7.7%) |
| $75,000 to $99,999 | 2 (4.2%) | 3 (11.5%) |
| $100,000 to $149,999 | 5 (10.4%) | 9 (34.6%) |
| $150,000 or more | 3 (6.2%) | 5 (19.2%) |
| Total | 48 (100.0%) | 26 (100.0%) |
Property Value to Household Income Ratio in Vernon
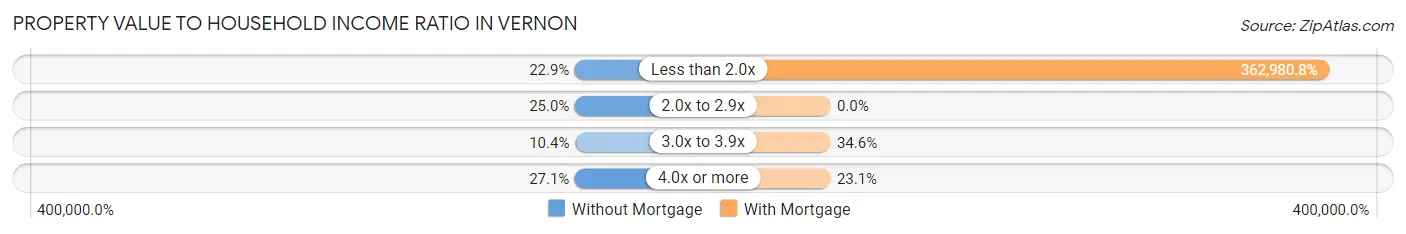
| Value-to-Income Ratio | Without Mortgage | With Mortgage |
| Less than 2.0x | 11 (22.9%) | 94,375 (362,980.8%) |
| 2.0x to 2.9x | 12 (25.0%) | 0 (0.0%) |
| 3.0x to 3.9x | 5 (10.4%) | 9 (34.6%) |
| 4.0x or more | 13 (27.1%) | 6 (23.1%) |
| Total | 48 (100.0%) | 26 (100.0%) |
Real Estate Taxes by Mortgage Status in Vernon
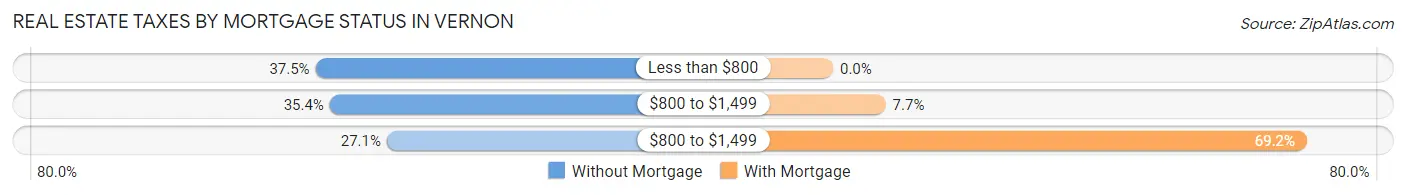
| Property Taxes | Without Mortgage | With Mortgage |
| Less than $800 | 18 (37.5%) | 0 (0.0%) |
| $800 to $1,499 | 17 (35.4%) | 2 (7.7%) |
| $800 to $1,499 | 13 (27.1%) | 18 (69.2%) |
| Total | 48 (100.0%) | 26 (100.0%) |
Health & Disability in Vernon
Health Insurance Coverage by Age in Vernon
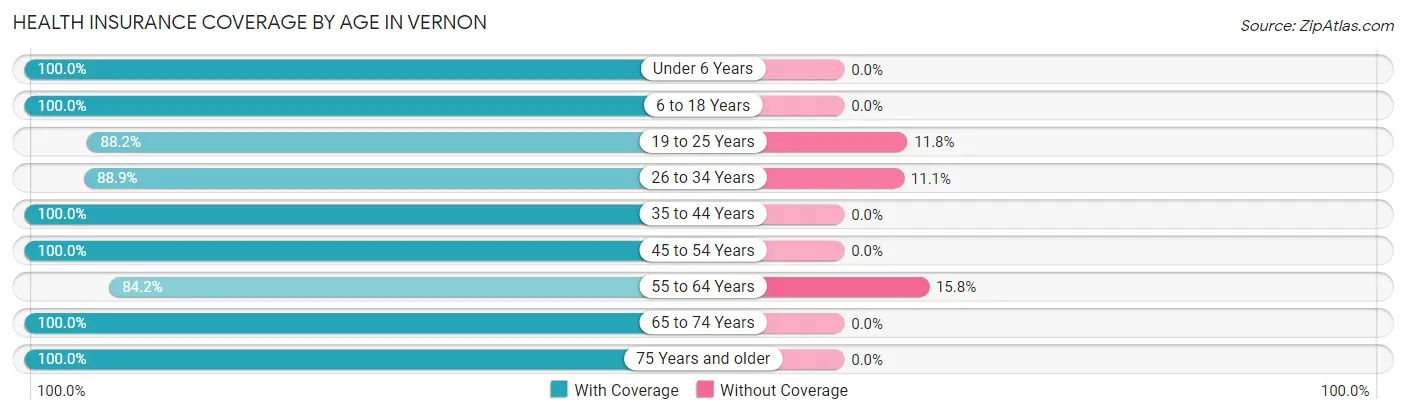
| Age Bracket | With Coverage | Without Coverage |
| Under 6 Years | 14 (100.0%) | 0 (0.0%) |
| 6 to 18 Years | 53 (100.0%) | 0 (0.0%) |
| 19 to 25 Years | 15 (88.2%) | 2 (11.8%) |
| 26 to 34 Years | 16 (88.9%) | 2 (11.1%) |
| 35 to 44 Years | 25 (100.0%) | 0 (0.0%) |
| 45 to 54 Years | 23 (100.0%) | 0 (0.0%) |
| 55 to 64 Years | 16 (84.2%) | 3 (15.8%) |
| 65 to 74 Years | 38 (100.0%) | 0 (0.0%) |
| 75 Years and older | 21 (100.0%) | 0 (0.0%) |
| Total | 221 (96.9%) | 7 (3.1%) |
Health Insurance Coverage by Citizenship Status in Vernon
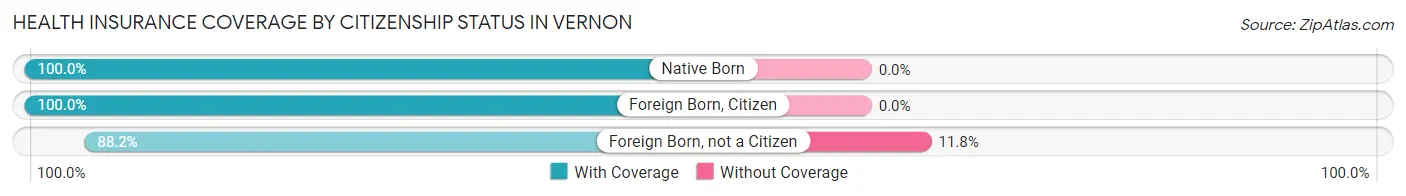
| Citizenship Status | With Coverage | Without Coverage |
| Native Born | 14 (100.0%) | 0 (0.0%) |
| Foreign Born, Citizen | 53 (100.0%) | 0 (0.0%) |
| Foreign Born, not a Citizen | 15 (88.2%) | 2 (11.8%) |
Health Insurance Coverage by Household Income in Vernon
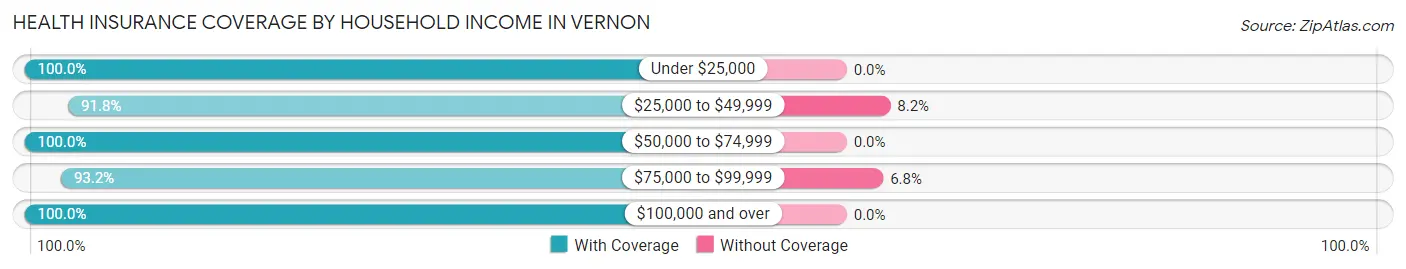
| Household Income | With Coverage | Without Coverage |
| Under $25,000 | 17 (100.0%) | 0 (0.0%) |
| $25,000 to $49,999 | 45 (91.8%) | 4 (8.2%) |
| $50,000 to $74,999 | 50 (100.0%) | 0 (0.0%) |
| $75,000 to $99,999 | 41 (93.2%) | 3 (6.8%) |
| $100,000 and over | 68 (100.0%) | 0 (0.0%) |
Public vs Private Health Insurance Coverage by Age in Vernon
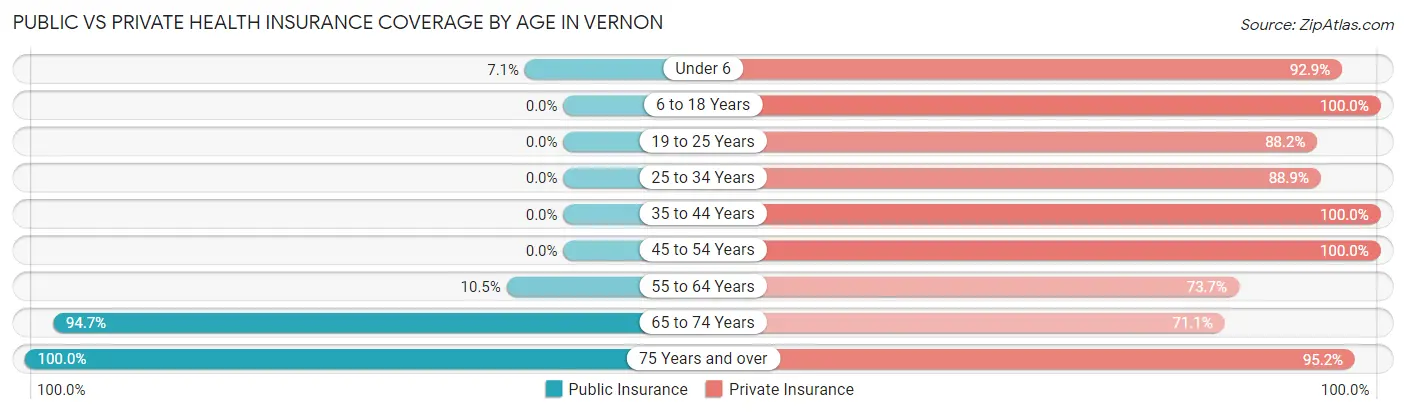
| Age Bracket | Public Insurance | Private Insurance |
| Under 6 | 1 (7.1%) | 13 (92.9%) |
| 6 to 18 Years | 0 (0.0%) | 53 (100.0%) |
| 19 to 25 Years | 0 (0.0%) | 15 (88.2%) |
| 25 to 34 Years | 0 (0.0%) | 16 (88.9%) |
| 35 to 44 Years | 0 (0.0%) | 25 (100.0%) |
| 45 to 54 Years | 0 (0.0%) | 23 (100.0%) |
| 55 to 64 Years | 2 (10.5%) | 14 (73.7%) |
| 65 to 74 Years | 36 (94.7%) | 27 (71.1%) |
| 75 Years and over | 21 (100.0%) | 20 (95.2%) |
| Total | 60 (26.3%) | 206 (90.3%) |
Disability Status by Sex by Age in Vernon
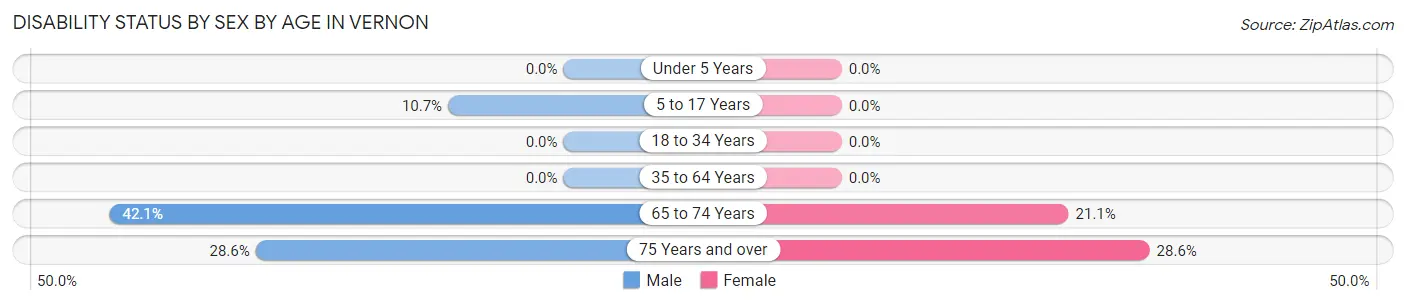
| Age Bracket | Male | Female |
| Under 5 Years | 0 (0.0%) | 0 (0.0%) |
| 5 to 17 Years | 3 (10.7%) | 0 (0.0%) |
| 18 to 34 Years | 0 (0.0%) | 0 (0.0%) |
| 35 to 64 Years | 0 (0.0%) | 0 (0.0%) |
| 65 to 74 Years | 8 (42.1%) | 4 (21.0%) |
| 75 Years and over | 2 (28.6%) | 4 (28.6%) |
Disability Class by Sex by Age in Vernon
Disability Class: Hearing Difficulty
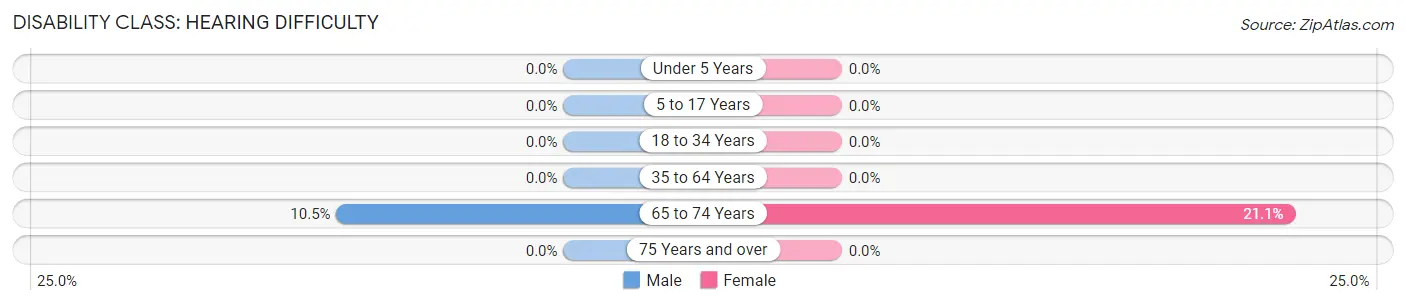
| Age Bracket | Male | Female |
| Under 5 Years | 0 (0.0%) | 0 (0.0%) |
| 5 to 17 Years | 0 (0.0%) | 0 (0.0%) |
| 18 to 34 Years | 0 (0.0%) | 0 (0.0%) |
| 35 to 64 Years | 0 (0.0%) | 0 (0.0%) |
| 65 to 74 Years | 2 (10.5%) | 4 (21.0%) |
| 75 Years and over | 0 (0.0%) | 0 (0.0%) |
Disability Class: Vision Difficulty
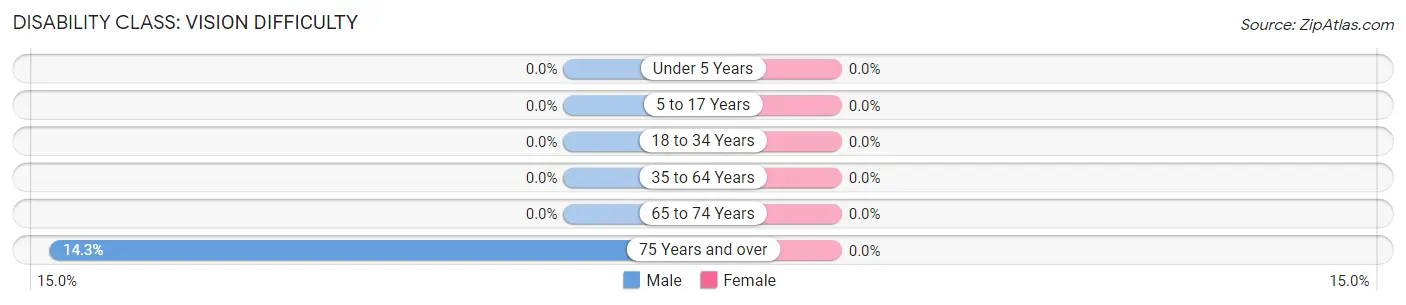
| Age Bracket | Male | Female |
| Under 5 Years | 0 (0.0%) | 0 (0.0%) |
| 5 to 17 Years | 0 (0.0%) | 0 (0.0%) |
| 18 to 34 Years | 0 (0.0%) | 0 (0.0%) |
| 35 to 64 Years | 0 (0.0%) | 0 (0.0%) |
| 65 to 74 Years | 0 (0.0%) | 0 (0.0%) |
| 75 Years and over | 1 (14.3%) | 0 (0.0%) |
Disability Class: Cognitive Difficulty
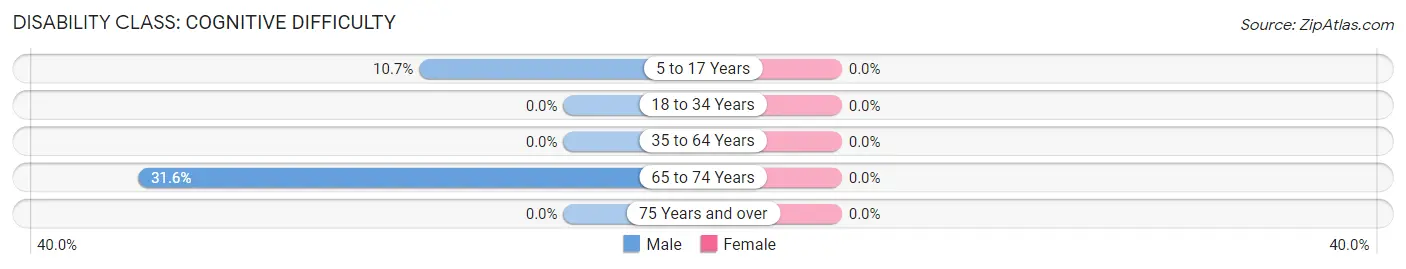
| Age Bracket | Male | Female |
| 5 to 17 Years | 3 (10.7%) | 0 (0.0%) |
| 18 to 34 Years | 0 (0.0%) | 0 (0.0%) |
| 35 to 64 Years | 0 (0.0%) | 0 (0.0%) |
| 65 to 74 Years | 6 (31.6%) | 0 (0.0%) |
| 75 Years and over | 0 (0.0%) | 0 (0.0%) |
Disability Class: Ambulatory Difficulty
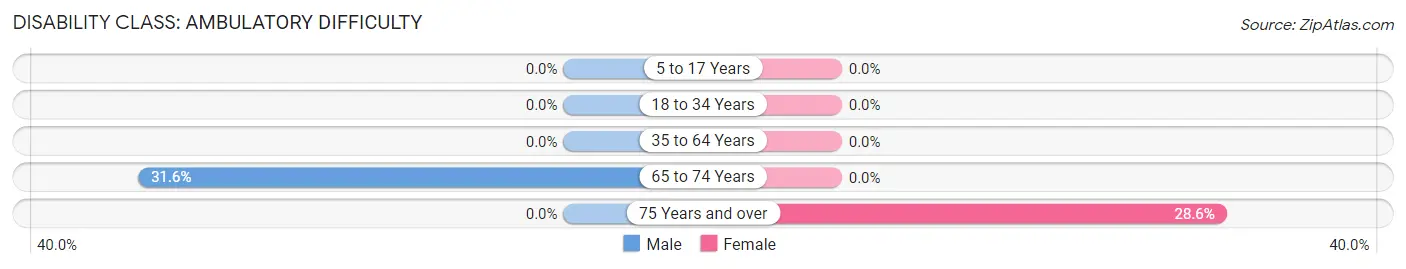
| Age Bracket | Male | Female |
| 5 to 17 Years | 0 (0.0%) | 0 (0.0%) |
| 18 to 34 Years | 0 (0.0%) | 0 (0.0%) |
| 35 to 64 Years | 0 (0.0%) | 0 (0.0%) |
| 65 to 74 Years | 6 (31.6%) | 0 (0.0%) |
| 75 Years and over | 0 (0.0%) | 4 (28.6%) |
Disability Class: Self-Care Difficulty
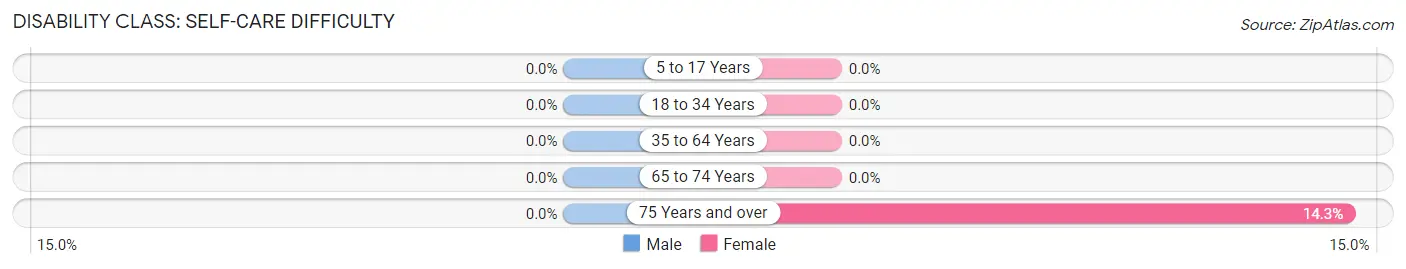
| Age Bracket | Male | Female |
| 5 to 17 Years | 0 (0.0%) | 0 (0.0%) |
| 18 to 34 Years | 0 (0.0%) | 0 (0.0%) |
| 35 to 64 Years | 0 (0.0%) | 0 (0.0%) |
| 65 to 74 Years | 0 (0.0%) | 0 (0.0%) |
| 75 Years and over | 0 (0.0%) | 2 (14.3%) |
Technology Access in Vernon
Computing Device Access in Vernon
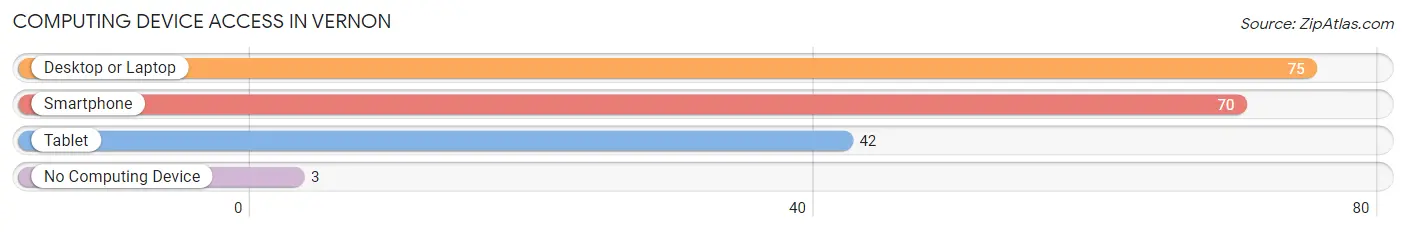
| Device Type | # Households | % Households |
| Desktop or Laptop | 75 | 86.2% |
| Smartphone | 70 | 80.5% |
| Tablet | 42 | 48.3% |
| No Computing Device | 3 | 3.5% |
| Total | 87 | 100.0% |
Internet Access in Vernon
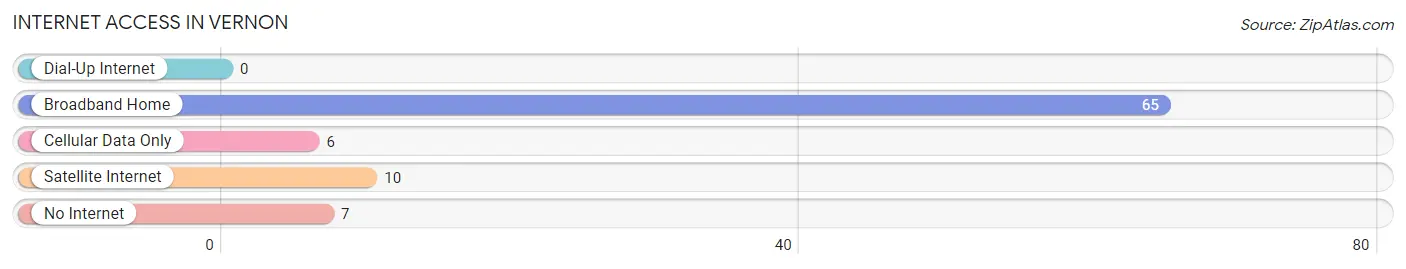
| Internet Type | # Households | % Households |
| Dial-Up Internet | 0 | 0.0% |
| Broadband Home | 65 | 74.7% |
| Cellular Data Only | 6 | 6.9% |
| Satellite Internet | 10 | 11.5% |
| No Internet | 7 | 8.1% |
| Total | 87 | 100.0% |
Vernon Summary
Vernon is a small town located in Tooele County, Utah, United States. It is situated in the western part of the state, approximately 40 miles southwest of Salt Lake City. The town was founded in 1883 and has a population of approximately 1,000 people.
History
Vernon was founded in 1883 by a group of Mormon settlers led by John R. Vernon. The town was named after the first settler's father, who was a prominent figure in the early days of the Church of Jesus Christ of Latter-day Saints. The settlers were looking for a place to settle and farm, and they chose the area because of its fertile soil and abundant water supply.
The town quickly grew and by the turn of the century, it had become a thriving agricultural community. The town was home to several businesses, including a general store, a blacksmith shop, a hotel, and a post office. The town also had a school, a church, and a cemetery.
In the early 1900s, the town began to decline as the railroad bypassed it and the population began to move away. By the 1950s, the population had dropped to just over 500 people. In the late 1970s, the town began to experience a resurgence as people began to move back to the area.
Geography
Vernon is located in the western part of Tooele County, Utah. It is situated in the Great Basin Desert, at an elevation of 4,400 feet. The town is surrounded by mountains, including the Oquirrh Mountains to the east and the Stansbury Mountains to the west.
The climate in Vernon is semi-arid, with hot summers and cold winters. The average annual temperature is around 50 degrees Fahrenheit, with an average high of around 80 degrees in the summer and an average low of around 20 degrees in the winter.
Economy
Vernon's economy is largely based on agriculture. The town is home to several farms, which produce a variety of crops, including hay, alfalfa, wheat, and corn. The town also has a few small businesses, including a gas station, a grocery store, and a few restaurants.
Demographics
As of the 2010 census, the population of Vernon was 1,000 people. The racial makeup of the town was 95.2% White, 0.7% African American, 0.7% Native American, 0.7% Asian, 0.3% Pacific Islander, and 2.1% from other races. The median household income was $41,250, and the median family income was $45,000. The per capita income was $17,000.
Conclusion
Vernon is a small town located in Tooele County, Utah. It was founded in 1883 by a group of Mormon settlers and has a population of approximately 1,000 people. The town's economy is largely based on agriculture, and it has a few small businesses. The population is mostly White, with a small percentage of other races. The median household income is $41,250, and the per capita income is $17,000.
Common Questions
What is Per Capita Income in Vernon?
Per Capita income in Vernon is $26,037.
What is the Median Family Income in Vernon?
Median Family Income in Vernon is $75,000.
What is the Median Household income in Vernon?
Median Household Income in Vernon is $52,344.
What is Income or Wage Gap in Vernon?
Income or Wage Gap in Vernon is 70.5%.
Women in Vernon earn 29.5 cents for every dollar earned by a man.
What is Inequality or Gini Index in Vernon?
Inequality or Gini Index in Vernon is 0.40.
What is the Total Population of Vernon?
Total Population of Vernon is 228.
What is the Total Male Population of Vernon?
Total Male Population of Vernon is 123.
What is the Total Female Population of Vernon?
Total Female Population of Vernon is 105.
What is the Ratio of Males per 100 Females in Vernon?
There are 117.14 Males per 100 Females in Vernon.
What is the Ratio of Females per 100 Males in Vernon?
There are 85.37 Females per 100 Males in Vernon.
What is the Median Population Age in Vernon?
Median Population Age in Vernon is 42.3 Years.
What is the Average Family Size in Vernon
Average Family Size in Vernon is 3.5 People.
What is the Average Household Size in Vernon
Average Household Size in Vernon is 2.6 People.
How Large is the Labor Force in Vernon?
There are 84 People in the Labor Forcein in Vernon.
What is the Percentage of People in the Labor Force in Vernon?
48.6% of People are in the Labor Force in Vernon.
What is the Unemployment Rate in Vernon?
Unemployment Rate in Vernon is 1.2%.