Stockton, UT Map & Demographics
Stockton Map
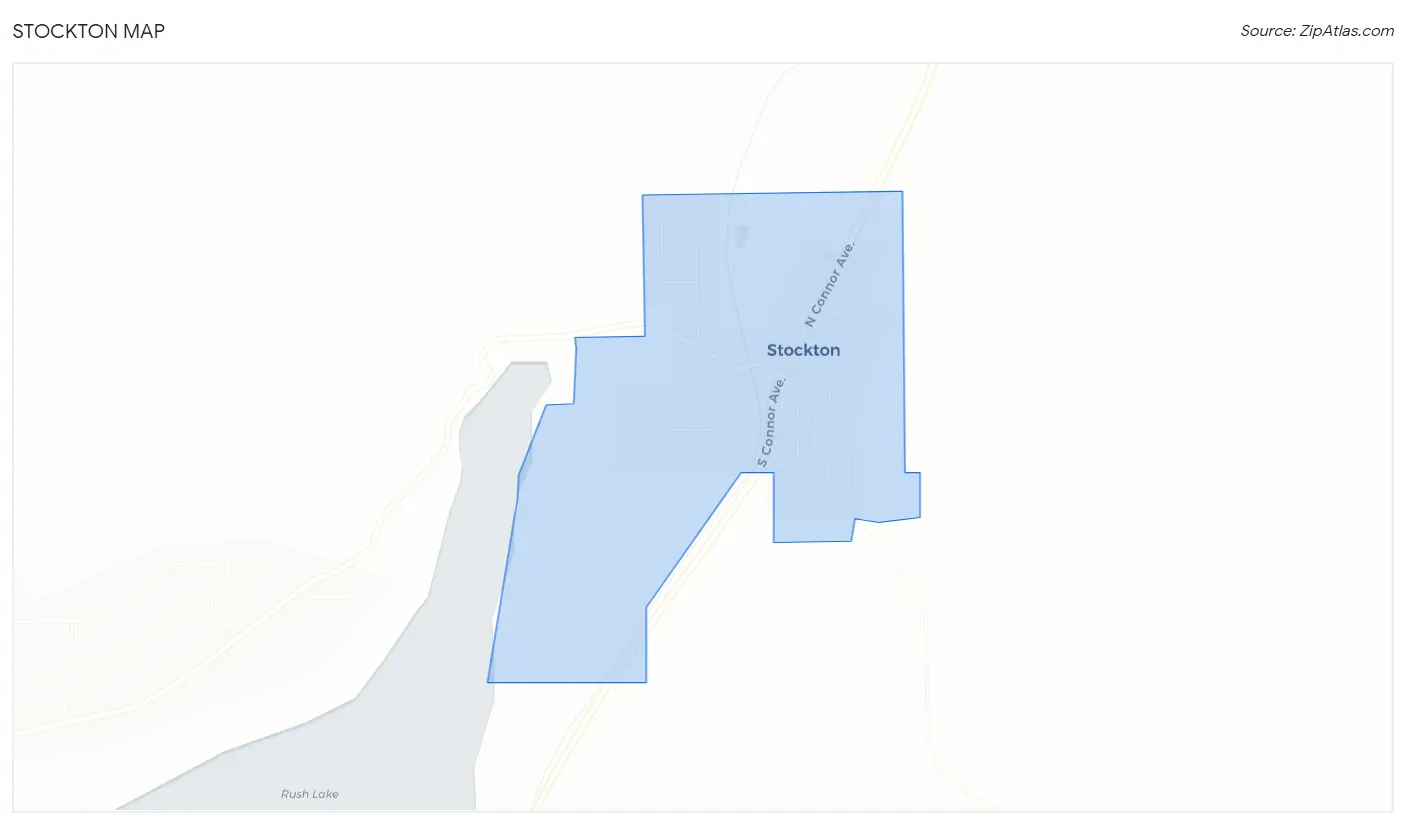
Stockton Overview
$33,177
PER CAPITA INCOME
$135,060
AVG FAMILY INCOME
$78,594
AVG HOUSEHOLD INCOME
20.1%
WAGE / INCOME GAP [ % ]
79.9¢/ $1
WAGE / INCOME GAP [ $ ]
0.36
INEQUALITY / GINI INDEX
915
TOTAL POPULATION
397
MALE POPULATION
518
FEMALE POPULATION
76.64
MALES / 100 FEMALES
130.48
FEMALES / 100 MALES
41.1
MEDIAN AGE
4.0
AVG FAMILY SIZE
3.2
AVG HOUSEHOLD SIZE
492
LABOR FORCE [ PEOPLE ]
69.7%
PERCENT IN LABOR FORCE
5.7%
UNEMPLOYMENT RATE
Stockton Zip Codes
Stockton Area Codes
Income in Stockton
Income Overview in Stockton
Per Capita Income in Stockton is $33,177, while median incomes of families and households are $135,060 and $78,594 respectively.
| Characteristic | Number | Measure |
| Per Capita Income | 915 | $33,177 |
| Median Family Income | 186 | $135,060 |
| Mean Family Income | 186 | $114,853 |
| Median Household Income | 287 | $78,594 |
| Mean Household Income | 287 | $91,531 |
| Income Deficit | 186 | $0 |
| Wage / Income Gap (%) | 915 | 20.15% |
| Wage / Income Gap ($) | 915 | 79.85¢ per $1 |
| Gini / Inequality Index | 915 | 0.36 |
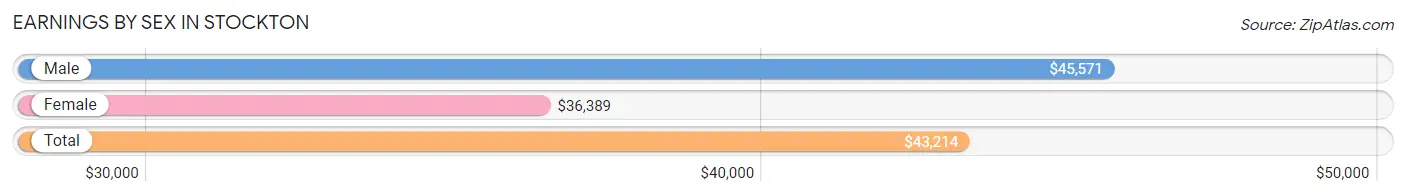
Earnings by Sex in Stockton
Average Earnings in Stockton are $43,214, $45,571 for men and $36,389 for women, a difference of 20.2%.
| Sex | Number | Average Earnings |
| Male | 278 (54.3%) | $45,571 |
| Female | 234 (45.7%) | $36,389 |
| Total | 512 (100.0%) | $43,214 |
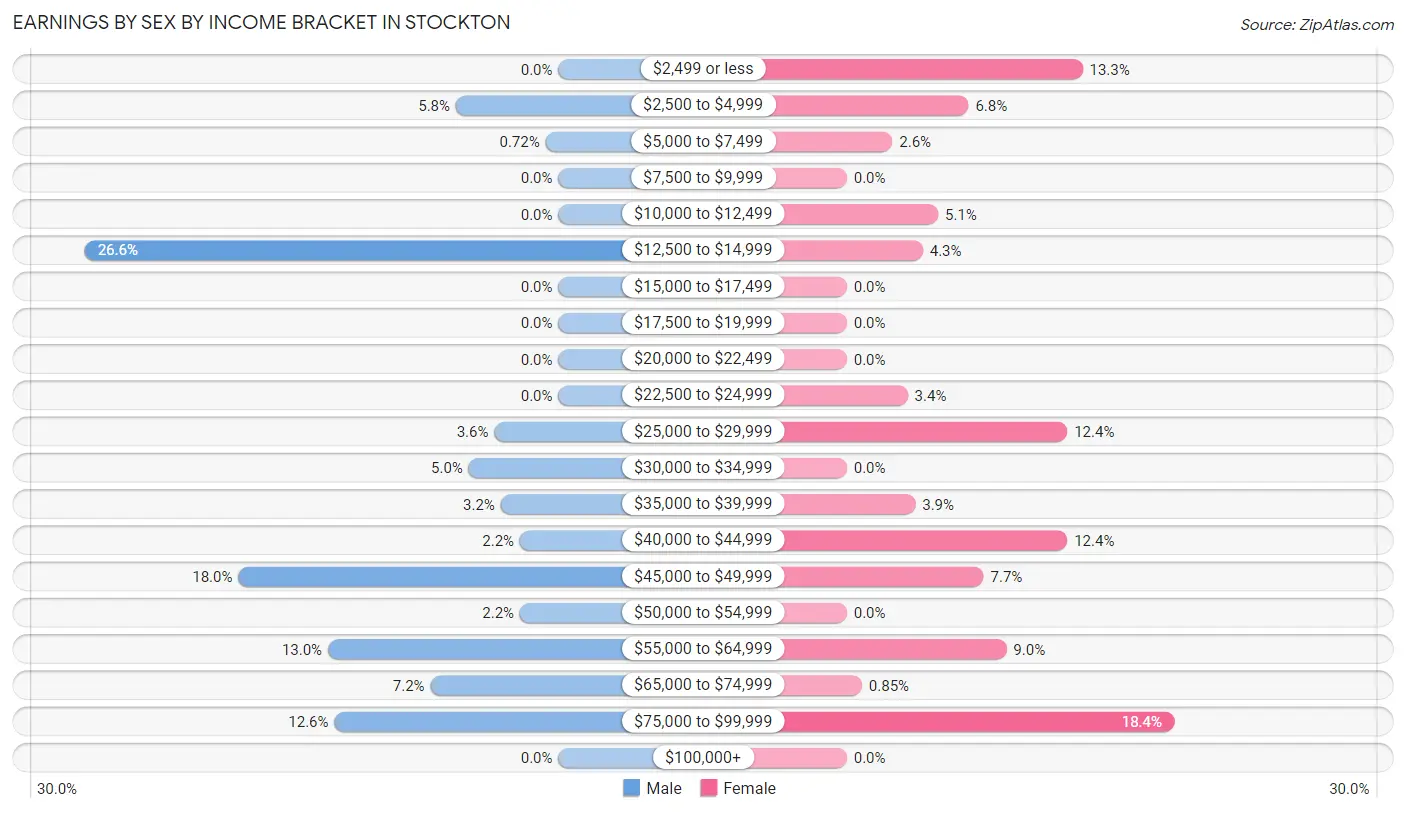
Earnings by Sex by Income Bracket in Stockton
The most common earnings brackets in Stockton are $12,500 to $14,999 for men (74 | 26.6%) and $75,000 to $99,999 for women (43 | 18.4%).
| Income | Male | Female |
| $2,499 or less | 0 (0.0%) | 31 (13.3%) |
| $2,500 to $4,999 | 16 (5.8%) | 16 (6.8%) |
| $5,000 to $7,499 | 2 (0.7%) | 6 (2.6%) |
| $7,500 to $9,999 | 0 (0.0%) | 0 (0.0%) |
| $10,000 to $12,499 | 0 (0.0%) | 12 (5.1%) |
| $12,500 to $14,999 | 74 (26.6%) | 10 (4.3%) |
| $15,000 to $17,499 | 0 (0.0%) | 0 (0.0%) |
| $17,500 to $19,999 | 0 (0.0%) | 0 (0.0%) |
| $20,000 to $22,499 | 0 (0.0%) | 0 (0.0%) |
| $22,500 to $24,999 | 0 (0.0%) | 8 (3.4%) |
| $25,000 to $29,999 | 10 (3.6%) | 29 (12.4%) |
| $30,000 to $34,999 | 14 (5.0%) | 0 (0.0%) |
| $35,000 to $39,999 | 9 (3.2%) | 9 (3.8%) |
| $40,000 to $44,999 | 6 (2.2%) | 29 (12.4%) |
| $45,000 to $49,999 | 50 (18.0%) | 18 (7.7%) |
| $50,000 to $54,999 | 6 (2.2%) | 0 (0.0%) |
| $55,000 to $64,999 | 36 (13.0%) | 21 (9.0%) |
| $65,000 to $74,999 | 20 (7.2%) | 2 (0.9%) |
| $75,000 to $99,999 | 35 (12.6%) | 43 (18.4%) |
| $100,000+ | 0 (0.0%) | 0 (0.0%) |
| Total | 278 (100.0%) | 234 (100.0%) |
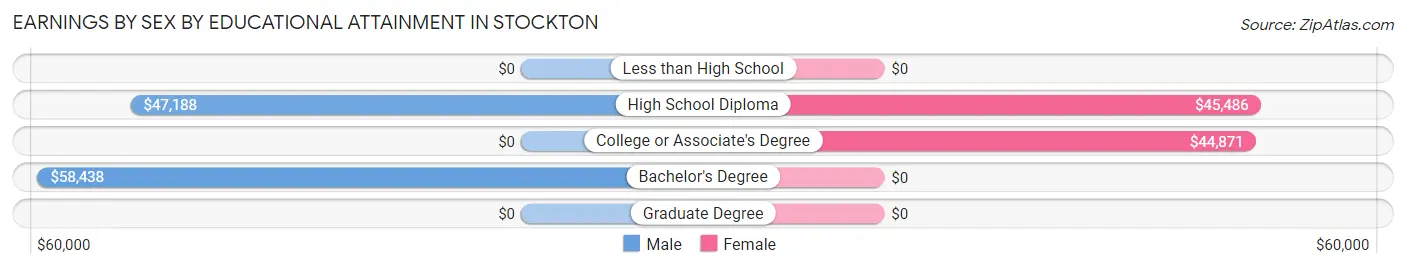
Earnings by Sex by Educational Attainment in Stockton
Average earnings in Stockton are $46,435 for men and $45,139 for women, a difference of 2.8%. Men with an educational attainment of bachelor's degree enjoy the highest average annual earnings of $58,438, while those with high school diploma education earn the least with $47,188. Women with an educational attainment of high school diploma earn the most with the average annual earnings of $45,486, while those with college or associate's degree education have the smallest earnings of $44,871.
| Educational Attainment | Male Income | Female Income |
| Less than High School | - | - |
| High School Diploma | $47,188 | $45,486 |
| College or Associate's Degree | - | - |
| Bachelor's Degree | $58,438 | $0 |
| Graduate Degree | - | - |
| Total | $46,435 | $45,139 |
Family Income in Stockton
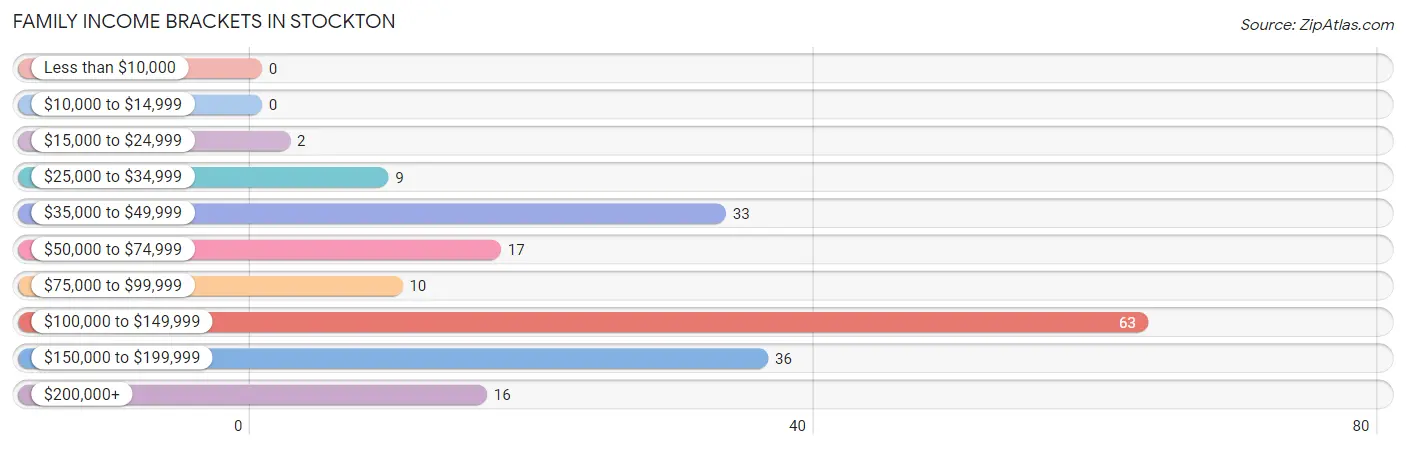
Family Income Brackets in Stockton
According to the Stockton family income data, there are 63 families falling into the $100,000 to $149,999 income range, which is the most common income bracket and makes up 33.9% of all families.
| Income Bracket | # Families | % Families |
| Less than $10,000 | 0 | 0.0% |
| $10,000 to $14,999 | 0 | 0.0% |
| $15,000 to $24,999 | 2 | 1.1% |
| $25,000 to $34,999 | 9 | 4.8% |
| $35,000 to $49,999 | 33 | 17.7% |
| $50,000 to $74,999 | 17 | 9.1% |
| $75,000 to $99,999 | 10 | 5.4% |
| $100,000 to $149,999 | 63 | 33.9% |
| $150,000 to $199,999 | 36 | 19.4% |
| $200,000+ | 16 | 8.6% |
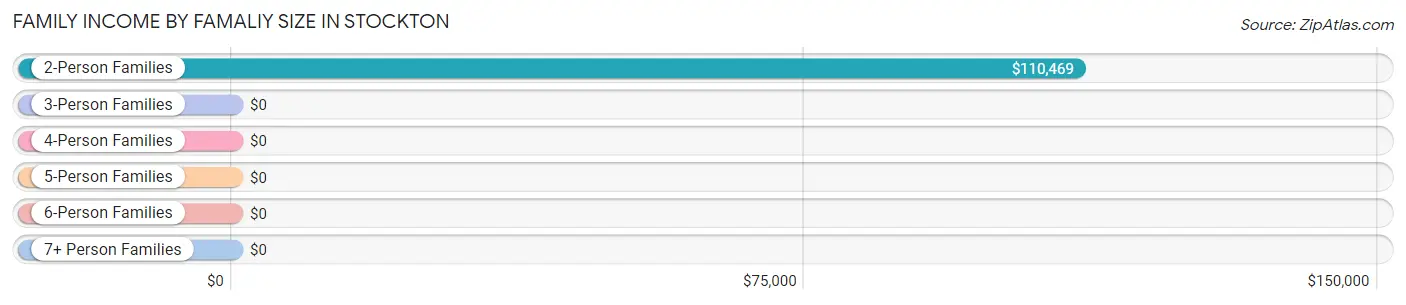
Family Income by Famaliy Size in Stockton
2-person families (97 | 52.1%) account for the highest median family income in Stockton with $110,469 per family, while 2-person families (97 | 52.1%) have the highest median income of $55,234 per family member.
| Income Bracket | # Families | Median Income |
| 2-Person Families | 97 (52.1%) | $110,469 |
| 3-Person Families | 26 (14.0%) | $0 |
| 4-Person Families | 17 (9.1%) | $0 |
| 5-Person Families | 13 (7.0%) | $0 |
| 6-Person Families | 16 (8.6%) | $0 |
| 7+ Person Families | 17 (9.1%) | $0 |
| Total | 186 (100.0%) | $135,060 |
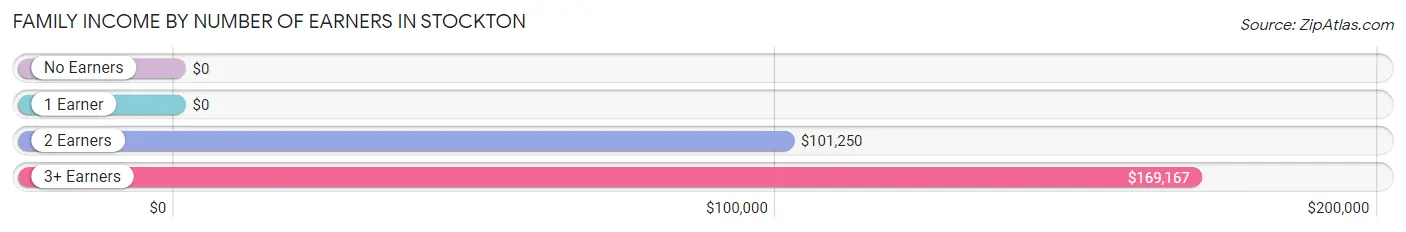
Family Income by Number of Earners in Stockton
| Number of Earners | # Families | Median Income |
| No Earners | 0 (0.0%) | $0 |
| 1 Earner | 112 (60.2%) | $0 |
| 2 Earners | 24 (12.9%) | $101,250 |
| 3+ Earners | 50 (26.9%) | $169,167 |
| Total | 186 (100.0%) | $135,060 |
Household Income in Stockton
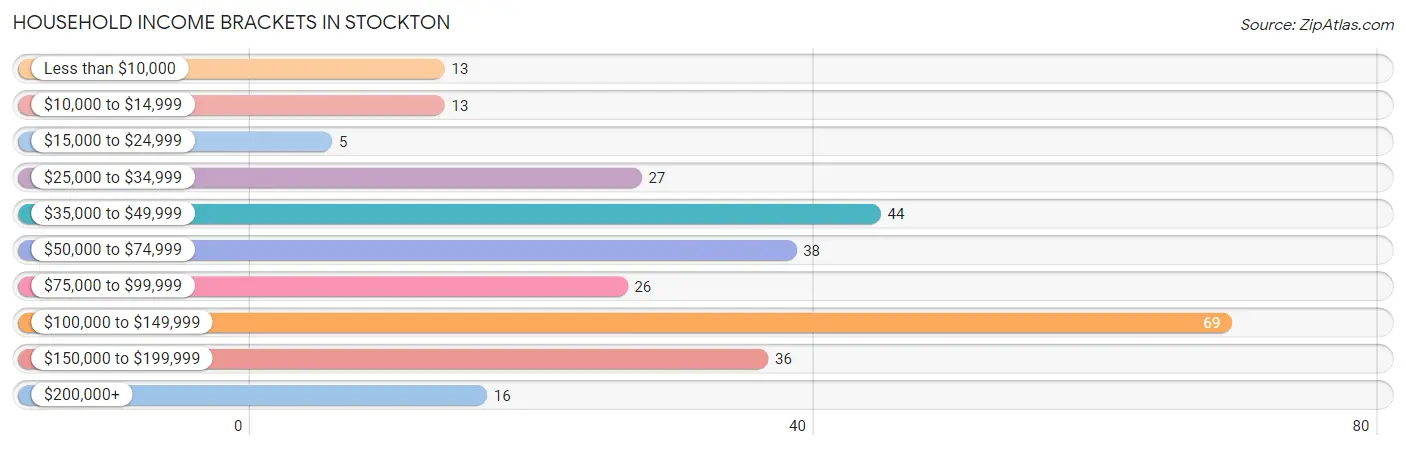
Household Income Brackets in Stockton
With 69 households falling in the category, the $100,000 to $149,999 income range is the most frequent in Stockton, accounting for 24.0% of all households. In contrast, only 5 households (1.7%) fall into the $15,000 to $24,999 income bracket, making it the least populous group.
| Income Bracket | # Households | % Households |
| Less than $10,000 | 13 | 4.5% |
| $10,000 to $14,999 | 13 | 4.5% |
| $15,000 to $24,999 | 5 | 1.7% |
| $25,000 to $34,999 | 27 | 9.4% |
| $35,000 to $49,999 | 44 | 15.3% |
| $50,000 to $74,999 | 38 | 13.2% |
| $75,000 to $99,999 | 26 | 9.1% |
| $100,000 to $149,999 | 69 | 24.0% |
| $150,000 to $199,999 | 36 | 12.5% |
| $200,000+ | 16 | 5.6% |
Household Income by Householder Age in Stockton
The median household income in Stockton is $78,594, with the highest median household income of $64,940 found in the 25 to 44 years age bracket for the primary householder. A total of 83 households (28.9%) fall into this category. Meanwhile, the 15 to 24 years age bracket for the primary householder has the lowest median household income of $0, with 10 households (3.5%) in this group.
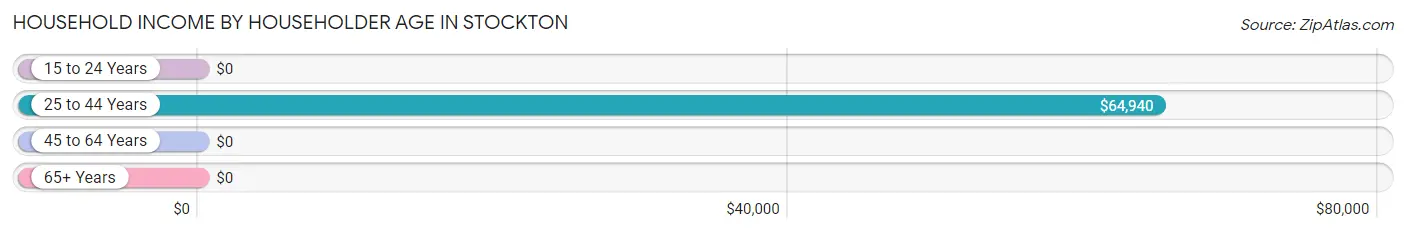
| Income Bracket | # Households | Median Income |
| 15 to 24 Years | 10 (3.5%) | $0 |
| 25 to 44 Years | 83 (28.9%) | $64,940 |
| 45 to 64 Years | 93 (32.4%) | $0 |
| 65+ Years | 101 (35.2%) | $0 |
| Total | 287 (100.0%) | $78,594 |
Poverty in Stockton
Income Below Poverty by Sex and Age in Stockton
With 4.5% poverty level for males and 9.7% for females among the residents of Stockton, 18 to 24 year old males and 15 year old females are the most vulnerable to poverty, with 9 males (18.4%) and 11 females (100.0%) in their respective age groups living below the poverty level.
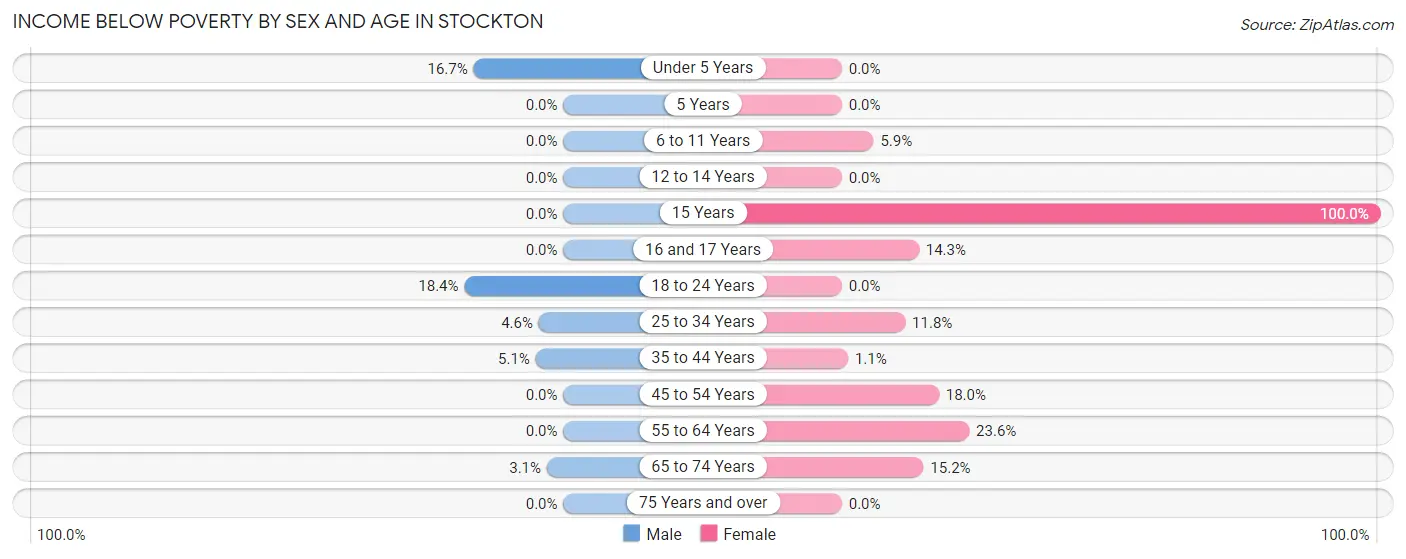
| Age Bracket | Male | Female |
| Under 5 Years | 2 (16.7%) | 0 (0.0%) |
| 5 Years | 0 (0.0%) | 0 (0.0%) |
| 6 to 11 Years | 0 (0.0%) | 3 (5.9%) |
| 12 to 14 Years | 0 (0.0%) | 0 (0.0%) |
| 15 Years | 0 (0.0%) | 11 (100.0%) |
| 16 and 17 Years | 0 (0.0%) | 1 (14.3%) |
| 18 to 24 Years | 9 (18.4%) | 0 (0.0%) |
| 25 to 34 Years | 2 (4.5%) | 2 (11.8%) |
| 35 to 44 Years | 2 (5.1%) | 1 (1.1%) |
| 45 to 54 Years | 0 (0.0%) | 9 (18.0%) |
| 55 to 64 Years | 0 (0.0%) | 13 (23.6%) |
| 65 to 74 Years | 3 (3.1%) | 10 (15.1%) |
| 75 Years and over | 0 (0.0%) | 0 (0.0%) |
| Total | 18 (4.5%) | 50 (9.7%) |
Income Above Poverty by Sex and Age in Stockton
According to the poverty statistics in Stockton, males aged 6 to 11 years and females aged under 5 years are the age groups that are most secure financially, with 100.0% of males and 100.0% of females in these age groups living above the poverty line.
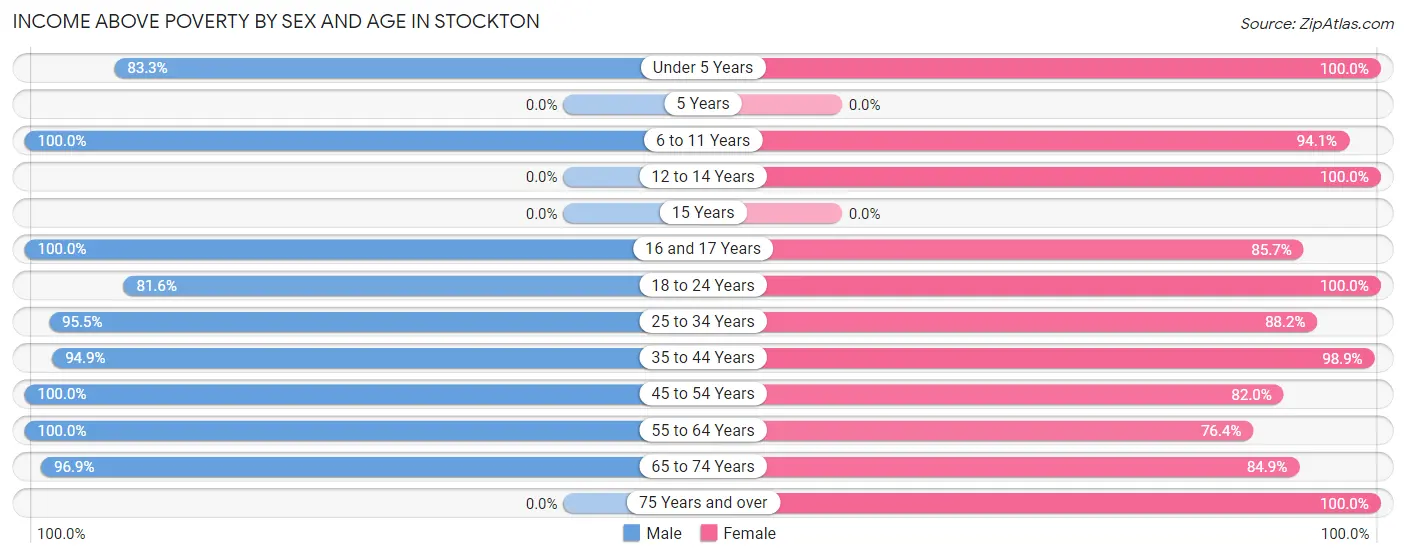
| Age Bracket | Male | Female |
| Under 5 Years | 10 (83.3%) | 15 (100.0%) |
| 5 Years | 0 (0.0%) | 0 (0.0%) |
| 6 to 11 Years | 44 (100.0%) | 48 (94.1%) |
| 12 to 14 Years | 0 (0.0%) | 76 (100.0%) |
| 15 Years | 0 (0.0%) | 0 (0.0%) |
| 16 and 17 Years | 17 (100.0%) | 6 (85.7%) |
| 18 to 24 Years | 40 (81.6%) | 71 (100.0%) |
| 25 to 34 Years | 42 (95.5%) | 15 (88.2%) |
| 35 to 44 Years | 37 (94.9%) | 87 (98.9%) |
| 45 to 54 Years | 45 (100.0%) | 41 (82.0%) |
| 55 to 64 Years | 49 (100.0%) | 42 (76.4%) |
| 65 to 74 Years | 95 (96.9%) | 56 (84.9%) |
| 75 Years and over | 0 (0.0%) | 11 (100.0%) |
| Total | 379 (95.5%) | 468 (90.3%) |
Income Below Poverty Among Married-Couple Families in Stockton
The poverty statistics for married-couple families in Stockton show that 1.1% or 2 of the total 175 families live below the poverty line. Families with 1 or 2 children have the highest poverty rate of 5.9%, comprising of 2 families. On the other hand, families with no children have the lowest poverty rate of 0.0%, which includes 0 families.
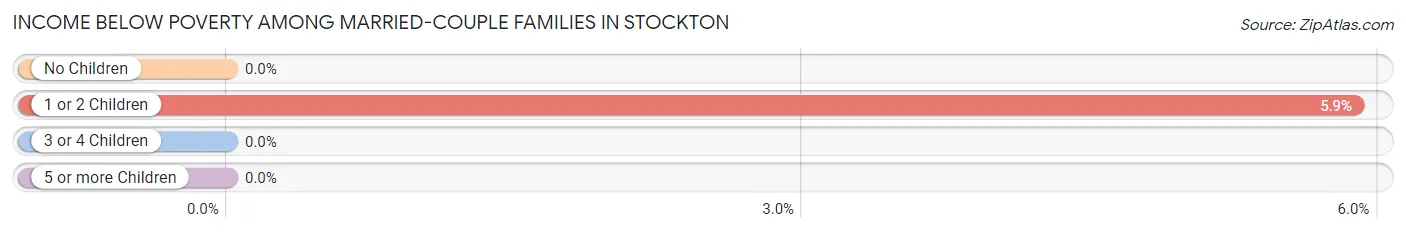
| Children | Above Poverty | Below Poverty |
| No Children | 108 (100.0%) | 0 (0.0%) |
| 1 or 2 Children | 32 (94.1%) | 2 (5.9%) |
| 3 or 4 Children | 19 (100.0%) | 0 (0.0%) |
| 5 or more Children | 14 (100.0%) | 0 (0.0%) |
| Total | 173 (98.9%) | 2 (1.1%) |
Income Below Poverty Among Single-Parent Households in Stockton
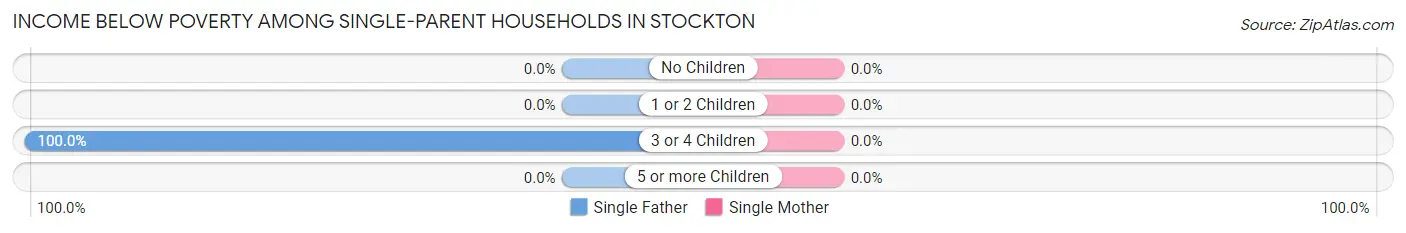
| Children | Single Father | Single Mother |
| No Children | 0 (0.0%) | 0 (0.0%) |
| 1 or 2 Children | 0 (0.0%) | 0 (0.0%) |
| 3 or 4 Children | 2 (100.0%) | 0 (0.0%) |
| 5 or more Children | 0 (0.0%) | 0 (0.0%) |
| Total | 2 (100.0%) | 0 (0.0%) |
Income Below Poverty Among Married-Couple vs Single-Parent Households in Stockton
The poverty data for Stockton shows that 2 of the married-couple family households (1.1%) and 2 of the single-parent households (18.2%) are living below the poverty level. Within the married-couple family households, those with 1 or 2 children have the highest poverty rate, with 2 households (5.9%) falling below the poverty line. Among the single-parent households, those with 3 or 4 children have the highest poverty rate, with 2 household (100.0%) living below poverty.
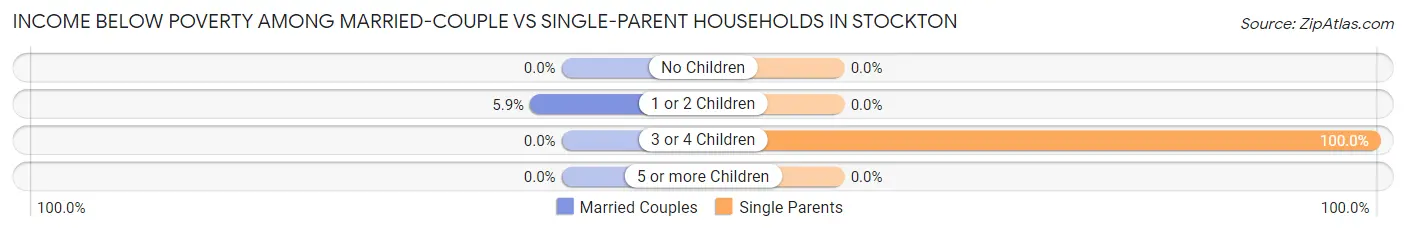
| Children | Married-Couple Families | Single-Parent Households |
| No Children | 0 (0.0%) | 0 (0.0%) |
| 1 or 2 Children | 2 (5.9%) | 0 (0.0%) |
| 3 or 4 Children | 0 (0.0%) | 2 (100.0%) |
| 5 or more Children | 0 (0.0%) | 0 (0.0%) |
| Total | 2 (1.1%) | 2 (18.2%) |
Race in Stockton
The most populous races in Stockton are White / Caucasian (893 | 97.6%), Hispanic or Latino (19 | 2.1%), and Two or more Races (14 | 1.5%).
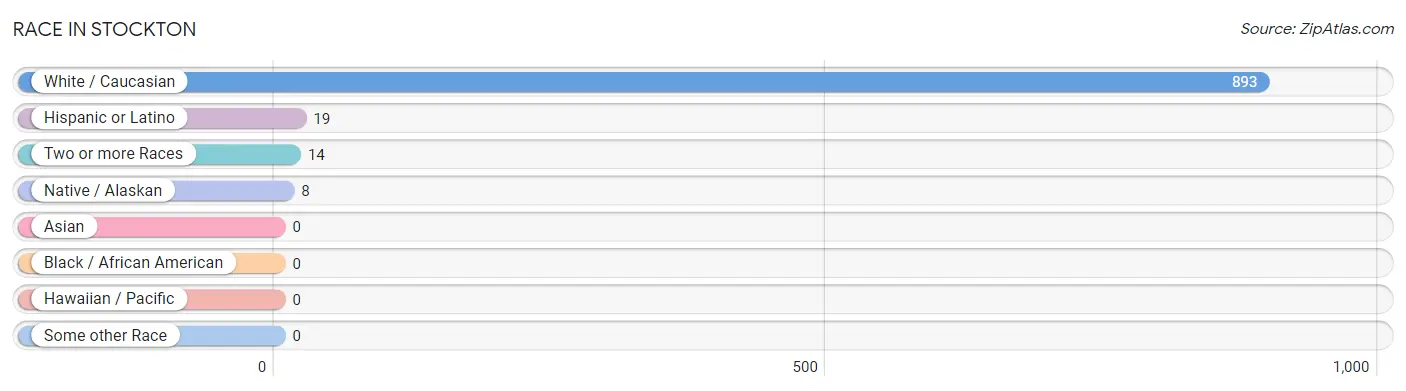
| Race | # Population | % Population |
| Asian | 0 | 0.0% |
| Black / African American | 0 | 0.0% |
| Hawaiian / Pacific | 0 | 0.0% |
| Hispanic or Latino | 19 | 2.1% |
| Native / Alaskan | 8 | 0.9% |
| White / Caucasian | 893 | 97.6% |
| Two or more Races | 14 | 1.5% |
| Some other Race | 0 | 0.0% |
| Total | 915 | 100.0% |
Ancestry in Stockton
The most populous ancestries reported in Stockton are English (339 | 37.0%), Irish (123 | 13.4%), German (63 | 6.9%), Danish (19 | 2.1%), and French (19 | 2.1%), together accounting for 61.5% of all Stockton residents.
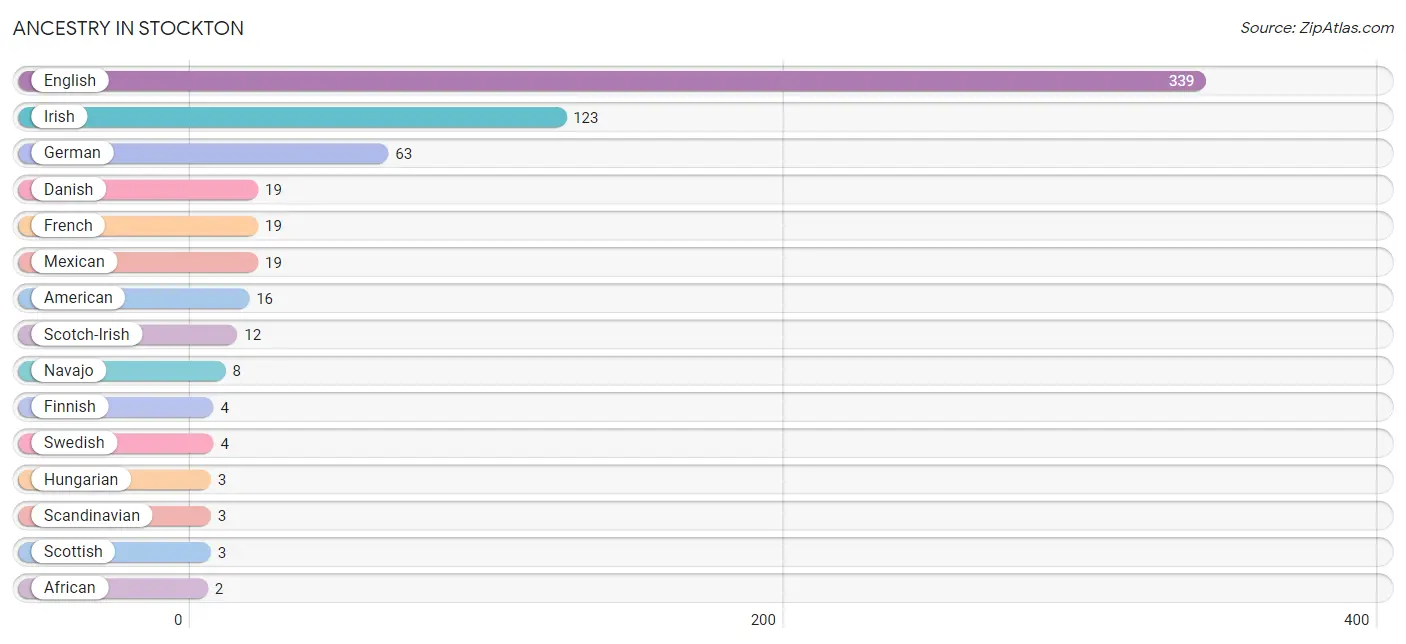
| Ancestry | # Population | % Population |
| African | 2 | 0.2% |
| American | 16 | 1.8% |
| Danish | 19 | 2.1% |
| English | 339 | 37.0% |
| European | 2 | 0.2% |
| Finnish | 4 | 0.4% |
| French | 19 | 2.1% |
| German | 63 | 6.9% |
| Hungarian | 3 | 0.3% |
| Irish | 123 | 13.4% |
| Mexican | 19 | 2.1% |
| Navajo | 8 | 0.9% |
| Scandinavian | 3 | 0.3% |
| Scotch-Irish | 12 | 1.3% |
| Scottish | 3 | 0.3% |
| Subsaharan African | 2 | 0.2% |
| Swedish | 4 | 0.4% | View All 17 Rows |
Immigrants in Stockton

| Immigration Origin | # Population | % Population | View All 0 Rows |
Sex and Age in Stockton
Sex and Age in Stockton
The most populous age groups in Stockton are 70 to 74 Years (69 | 17.4%) for men and 10 to 14 Years (108 | 20.8%) for women.
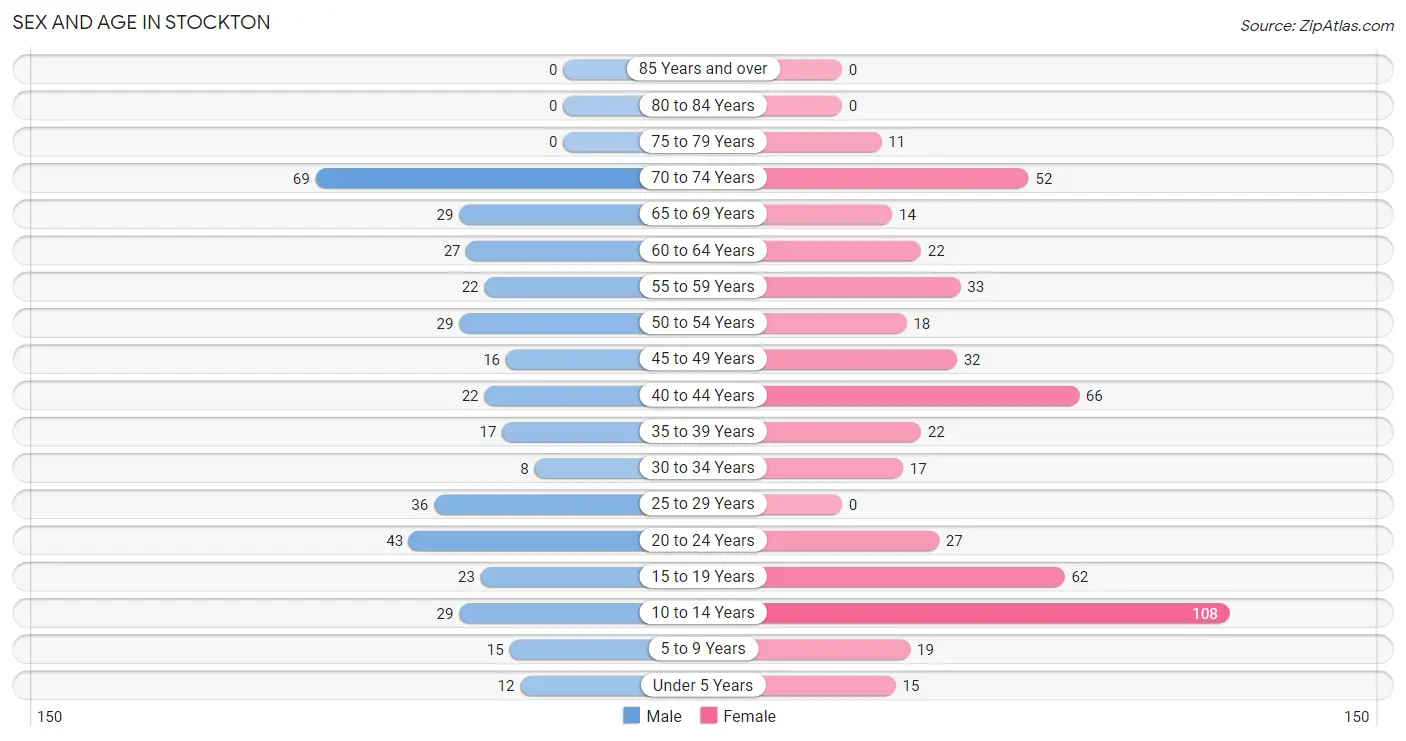
| Age Bracket | Male | Female |
| Under 5 Years | 12 (3.0%) | 15 (2.9%) |
| 5 to 9 Years | 15 (3.8%) | 19 (3.7%) |
| 10 to 14 Years | 29 (7.3%) | 108 (20.8%) |
| 15 to 19 Years | 23 (5.8%) | 62 (12.0%) |
| 20 to 24 Years | 43 (10.8%) | 27 (5.2%) |
| 25 to 29 Years | 36 (9.1%) | 0 (0.0%) |
| 30 to 34 Years | 8 (2.0%) | 17 (3.3%) |
| 35 to 39 Years | 17 (4.3%) | 22 (4.3%) |
| 40 to 44 Years | 22 (5.5%) | 66 (12.7%) |
| 45 to 49 Years | 16 (4.0%) | 32 (6.2%) |
| 50 to 54 Years | 29 (7.3%) | 18 (3.5%) |
| 55 to 59 Years | 22 (5.5%) | 33 (6.4%) |
| 60 to 64 Years | 27 (6.8%) | 22 (4.3%) |
| 65 to 69 Years | 29 (7.3%) | 14 (2.7%) |
| 70 to 74 Years | 69 (17.4%) | 52 (10.0%) |
| 75 to 79 Years | 0 (0.0%) | 11 (2.1%) |
| 80 to 84 Years | 0 (0.0%) | 0 (0.0%) |
| 85 Years and over | 0 (0.0%) | 0 (0.0%) |
| Total | 397 (100.0%) | 518 (100.0%) |
Families and Households in Stockton
Median Family Size in Stockton
The median family size in Stockton is 3.99 persons per family, with married-couple families (175 | 94.1%) accounting for the largest median family size of 4.1 persons per family. On the other hand, single female/mother families (9 | 4.8%) represent the smallest median family size with 2.00 persons per family.
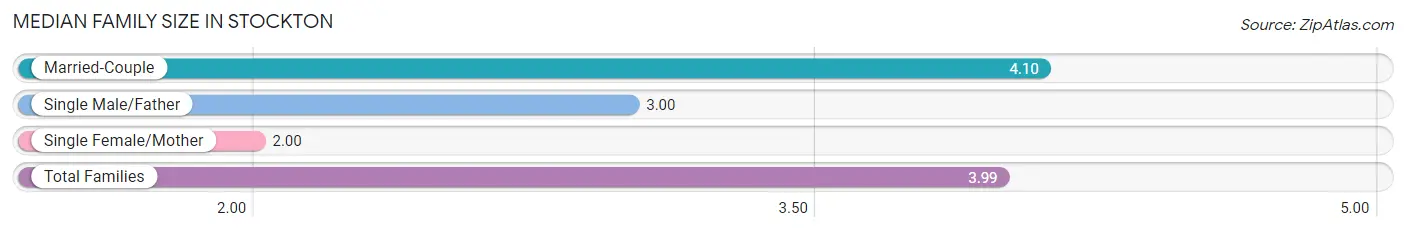
| Family Type | # Families | Family Size |
| Married-Couple | 175 (94.1%) | 4.10 |
| Single Male/Father | 2 (1.1%) | 3.00 |
| Single Female/Mother | 9 (4.8%) | 2.00 |
| Total Families | 186 (100.0%) | 3.99 |
Median Household Size in Stockton
The median household size in Stockton is 3.19 persons per household, with married-couple households (175 | 61.0%) accounting for the largest median household size of 4.15 persons per household. non-family households (101 | 35.2%) represent the smallest median household size with 1.61 persons per household.
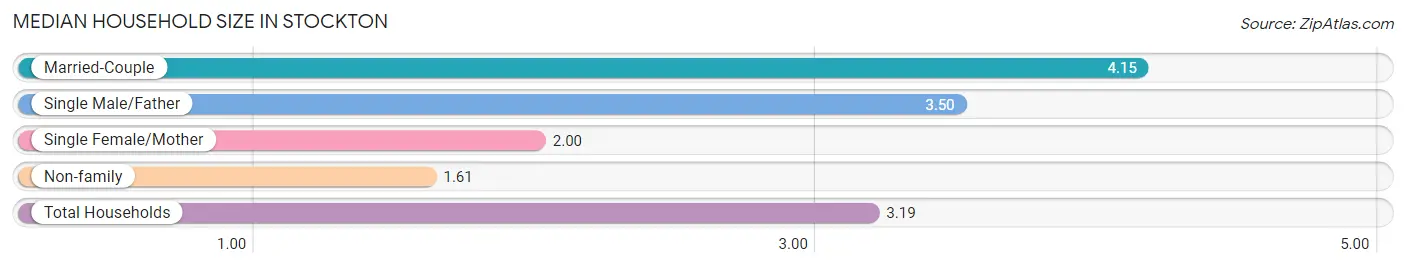
| Household Type | # Households | Household Size |
| Married-Couple | 175 (61.0%) | 4.15 |
| Single Male/Father | 2 (0.7%) | 3.50 |
| Single Female/Mother | 9 (3.1%) | 2.00 |
| Non-family | 101 (35.2%) | 1.61 |
| Total Households | 287 (100.0%) | 3.19 |
Household Size by Marriage Status in Stockton
Out of a total of 287 households in Stockton, 186 (64.8%) are family households, while 101 (35.2%) are nonfamily households. The most numerous type of family households are 2-person households, comprising 97, and the most common type of nonfamily households are 1-person households, comprising 87.
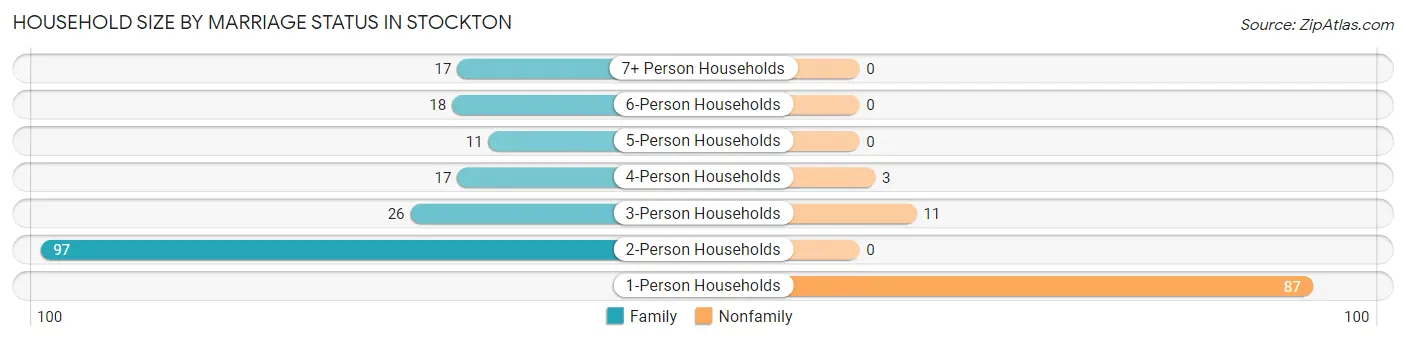
| Household Size | Family Households | Nonfamily Households |
| 1-Person Households | - | 87 (30.3%) |
| 2-Person Households | 97 (33.8%) | 0 (0.0%) |
| 3-Person Households | 26 (9.1%) | 11 (3.8%) |
| 4-Person Households | 17 (5.9%) | 3 (1.1%) |
| 5-Person Households | 11 (3.8%) | 0 (0.0%) |
| 6-Person Households | 18 (6.3%) | 0 (0.0%) |
| 7+ Person Households | 17 (5.9%) | 0 (0.0%) |
| Total | 186 (64.8%) | 101 (35.2%) |
Female Fertility in Stockton
Fertility by Age in Stockton
| Age Bracket | Women with Births | Births / 1,000 Women |
| 15 to 19 years | 0 (0.0%) | 0.0 |
| 20 to 34 years | 0 (0.0%) | 0.0 |
| 35 to 50 years | 0 (0.0%) | 0.0 |
| Total | 0 (0.0%) | 0.0 |
Fertility by Age by Marriage Status in Stockton
| Age Bracket | Married | Unmarried |
| 15 to 19 years | 0 (0.0%) | 0 (0.0%) |
| 20 to 34 years | 0 (0.0%) | 0 (0.0%) |
| 35 to 50 years | 0 (0.0%) | 0 (0.0%) |
| Total | 0 (0.0%) | 0 (0.0%) |
Fertility by Education in Stockton
| Educational Attainment | Women with Births | Births / 1,000 Women |
| Less than High School | 0 (0.0%) | 0.0 |
| High School Diploma | 0 (0.0%) | 0.0 |
| College or Associate's Degree | 0 (0.0%) | 0.0 |
| Bachelor's Degree | 0 (0.0%) | 0.0 |
| Graduate Degree | 0 (0.0%) | 0.0 |
| Total | 0 (0.0%) | 0.0 |
Fertility by Education by Marriage Status in Stockton
| Educational Attainment | Married | Unmarried |
| Less than High School | 0 (0.0%) | 0 (0.0%) |
| High School Diploma | 0 (0.0%) | 0 (0.0%) |
| College or Associate's Degree | 0 (0.0%) | 0 (0.0%) |
| Bachelor's Degree | 0 (0.0%) | 0 (0.0%) |
| Graduate Degree | 0 (0.0%) | 0 (0.0%) |
| Total | 0 (0.0%) | 0 (0.0%) |
Employment Characteristics in Stockton
Employment by Class of Employer in Stockton
Among the 405 employed individuals in Stockton, private company employees (308 | 76.0%), federal government employees (58 | 14.3%), and local government employees (14 | 3.5%) make up the most common classes of employment.
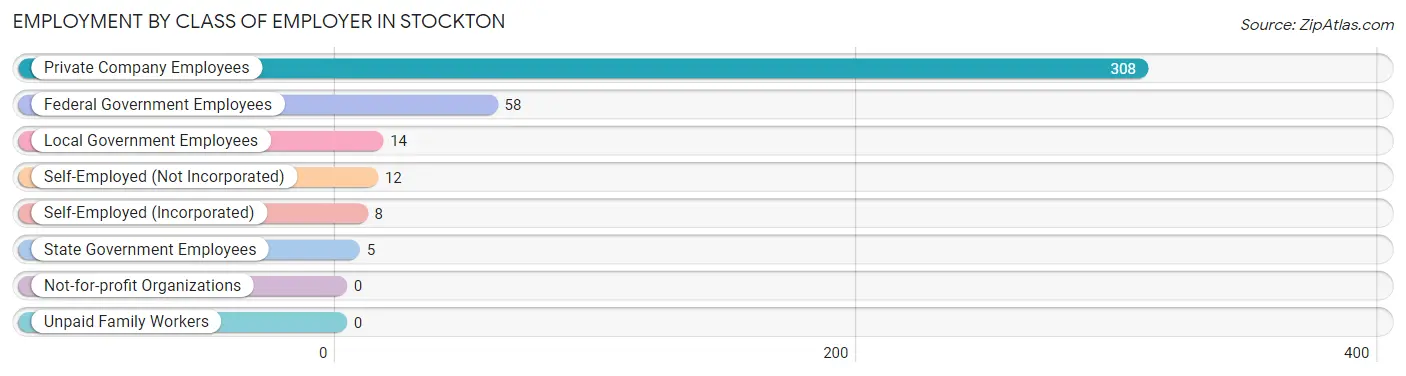
| Employer Class | # Employees | % Employees |
| Private Company Employees | 308 | 76.0% |
| Self-Employed (Incorporated) | 8 | 2.0% |
| Self-Employed (Not Incorporated) | 12 | 3.0% |
| Not-for-profit Organizations | 0 | 0.0% |
| Local Government Employees | 14 | 3.5% |
| State Government Employees | 5 | 1.2% |
| Federal Government Employees | 58 | 14.3% |
| Unpaid Family Workers | 0 | 0.0% |
| Total | 405 | 100.0% |
Employment Status by Age in Stockton
According to the labor force statistics for Stockton, out of the total population over 16 years of age (706), 69.7% or 492 individuals are in the labor force, with 5.7% or 28 of them unemployed. The age group with the highest labor force participation rate is 25 to 29 years, with 100.0% or 36 individuals in the labor force. Within the labor force, the 16 to 19 years age range has the highest percentage of unemployed individuals, with 38.0% or 19 of them being unemployed.
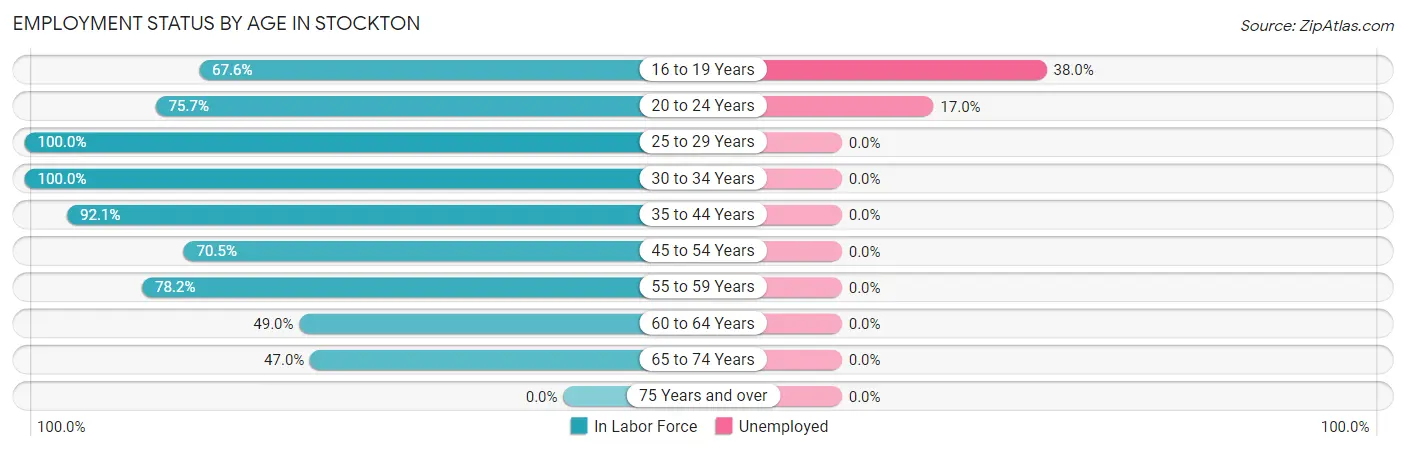
| Age Bracket | In Labor Force | Unemployed |
| 16 to 19 Years | 50 (67.6%) | 19 (38.0%) |
| 20 to 24 Years | 53 (75.7%) | 9 (17.0%) |
| 25 to 29 Years | 36 (100.0%) | 0 (0.0%) |
| 30 to 34 Years | 25 (100.0%) | 0 (0.0%) |
| 35 to 44 Years | 117 (92.1%) | 0 (0.0%) |
| 45 to 54 Years | 67 (70.5%) | 0 (0.0%) |
| 55 to 59 Years | 43 (78.2%) | 0 (0.0%) |
| 60 to 64 Years | 24 (49.0%) | 0 (0.0%) |
| 65 to 74 Years | 77 (47.0%) | 0 (0.0%) |
| 75 Years and over | 0 (0.0%) | 0 (0.0%) |
| Total | 492 (69.7%) | 28 (5.7%) |
Employment Status by Educational Attainment in Stockton
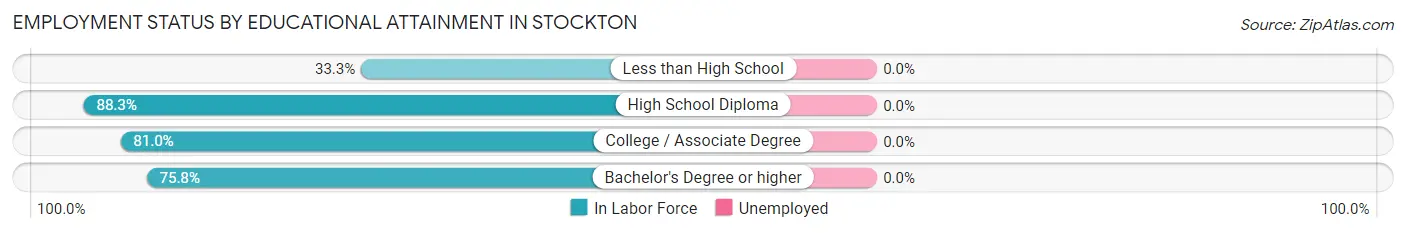
| Educational Attainment | In Labor Force | Unemployed |
| Less than High School | 6 (33.3%) | 0 (0.0%) |
| High School Diploma | 106 (88.3%) | 0 (0.0%) |
| College / Associate Degree | 175 (81.0%) | 0 (0.0%) |
| Bachelor's Degree or higher | 25 (75.8%) | 0 (0.0%) |
| Total | 312 (80.6%) | 0 (0.0%) |
Employment Occupations by Sex in Stockton
Management, Business, Science and Arts Occupations
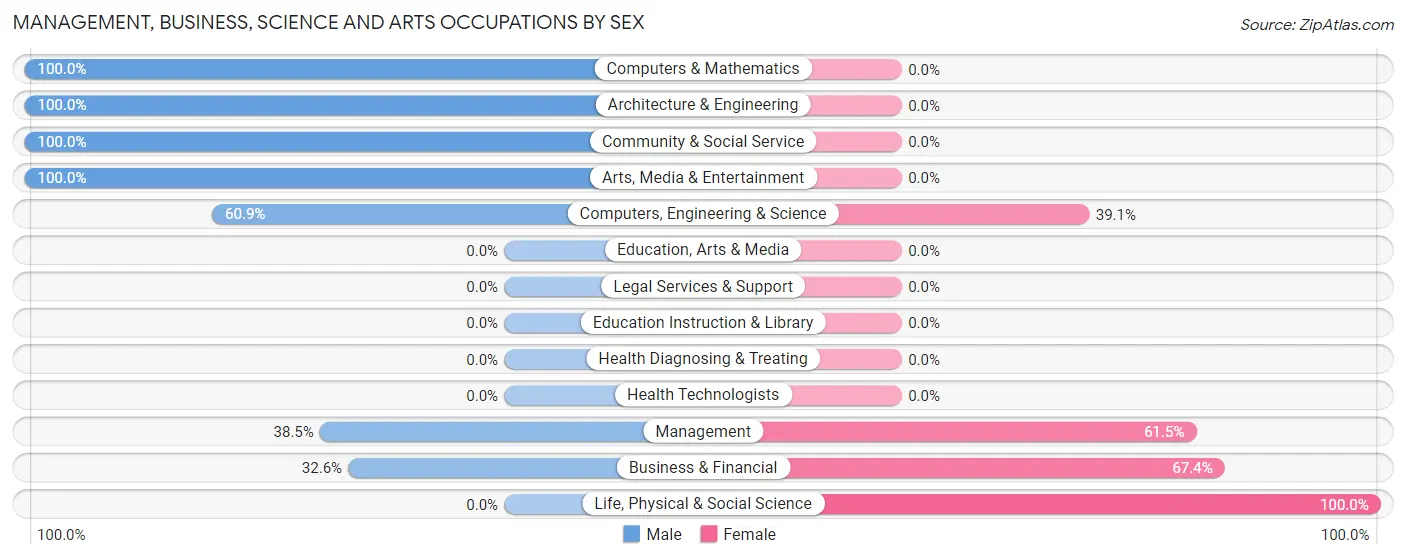
The most common Management, Business, Science and Arts occupations in Stockton are Business & Financial (43 | 9.3%), Management (26 | 5.6%), Computers, Engineering & Science (23 | 5.0%), Life, Physical & Social Science (9 | 1.9%), and Architecture & Engineering (8 | 1.7%).
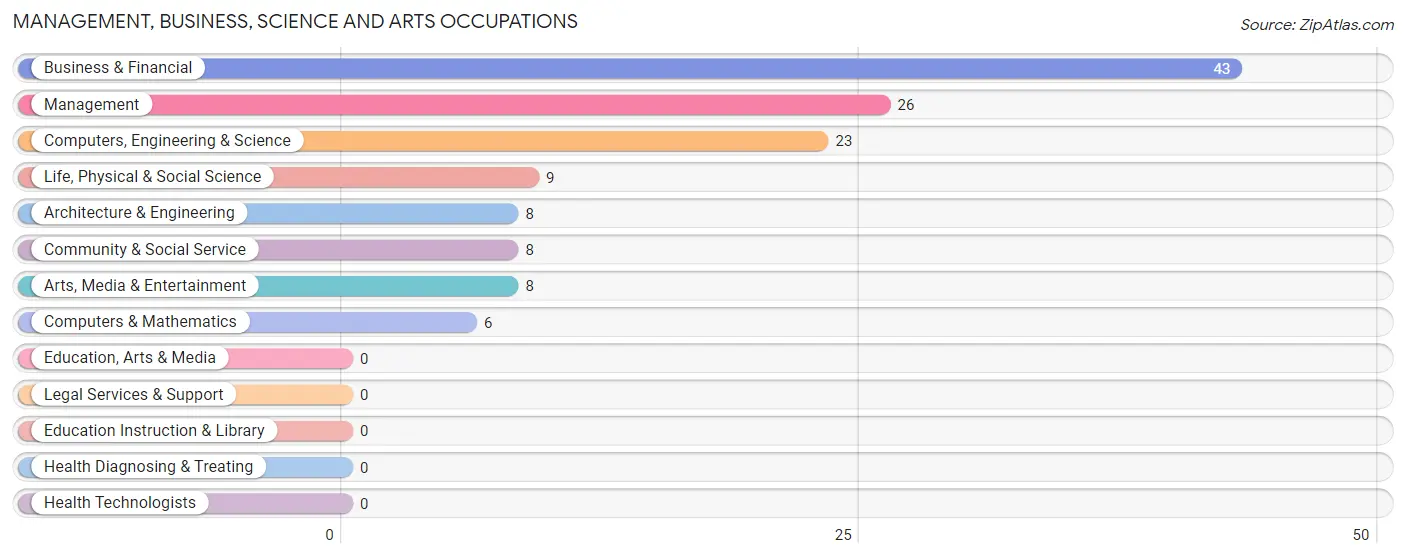
Management, Business, Science and Arts Occupations by Sex
Within the Management, Business, Science and Arts occupations in Stockton, the most male-oriented occupations are Computers & Mathematics (100.0%), Architecture & Engineering (100.0%), and Community & Social Service (100.0%), while the most female-oriented occupations are Life, Physical & Social Science (100.0%), Business & Financial (67.4%), and Management (61.5%).
| Occupation | Male | Female |
| Management | 10 (38.5%) | 16 (61.5%) |
| Business & Financial | 14 (32.6%) | 29 (67.4%) |
| Computers, Engineering & Science | 14 (60.9%) | 9 (39.1%) |
| Computers & Mathematics | 6 (100.0%) | 0 (0.0%) |
| Architecture & Engineering | 8 (100.0%) | 0 (0.0%) |
| Life, Physical & Social Science | 0 (0.0%) | 9 (100.0%) |
| Community & Social Service | 8 (100.0%) | 0 (0.0%) |
| Education, Arts & Media | 0 (0.0%) | 0 (0.0%) |
| Legal Services & Support | 0 (0.0%) | 0 (0.0%) |
| Education Instruction & Library | 0 (0.0%) | 0 (0.0%) |
| Arts, Media & Entertainment | 8 (100.0%) | 0 (0.0%) |
| Health Diagnosing & Treating | 0 (0.0%) | 0 (0.0%) |
| Health Technologists | 0 (0.0%) | 0 (0.0%) |
| Total (Category) | 46 (46.0%) | 54 (54.0%) |
| Total (Overall) | 262 (56.5%) | 202 (43.5%) |
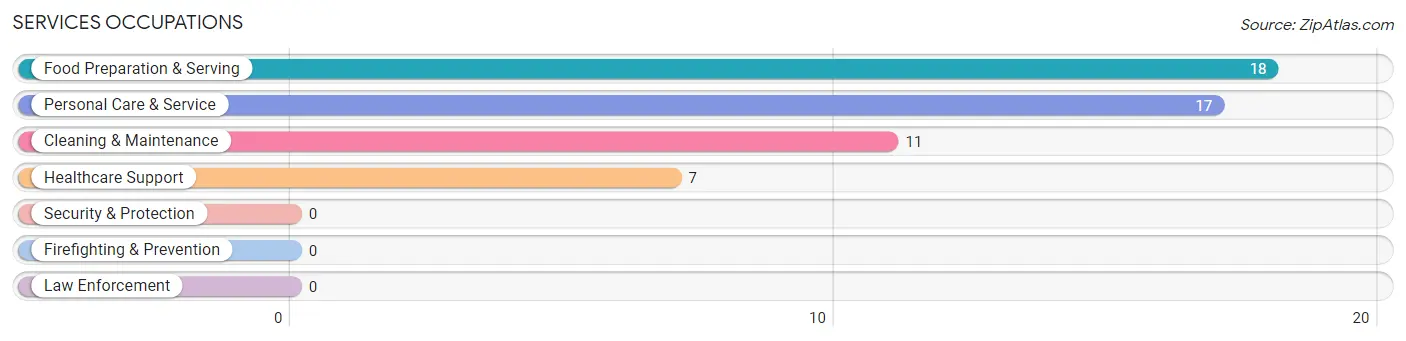
Services Occupations
The most common Services occupations in Stockton are Food Preparation & Serving (18 | 3.9%), Personal Care & Service (17 | 3.7%), Cleaning & Maintenance (11 | 2.4%), and Healthcare Support (7 | 1.5%).
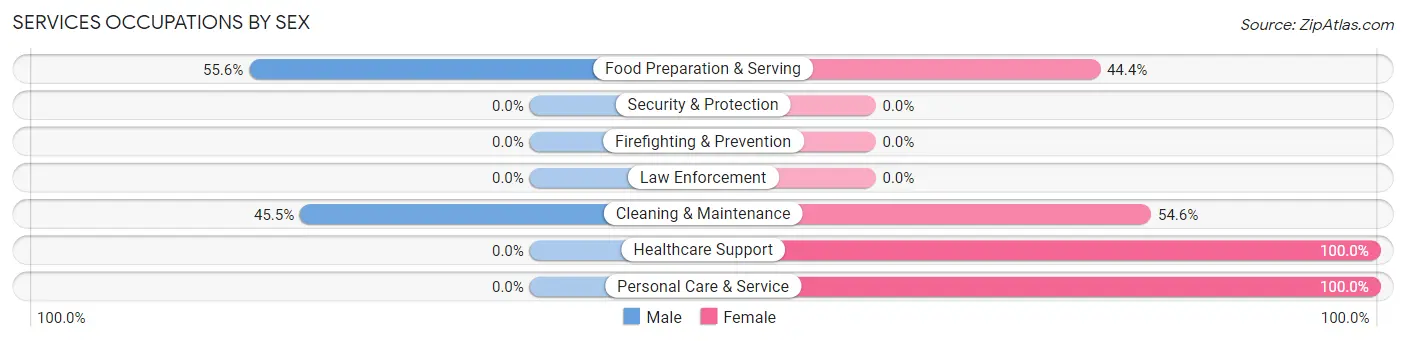
Services Occupations by Sex
Within the Services occupations in Stockton, the most male-oriented occupations are Food Preparation & Serving (55.6%), and Cleaning & Maintenance (45.5%), while the most female-oriented occupations are Healthcare Support (100.0%), Personal Care & Service (100.0%), and Cleaning & Maintenance (54.5%).
| Occupation | Male | Female |
| Healthcare Support | 0 (0.0%) | 7 (100.0%) |
| Security & Protection | 0 (0.0%) | 0 (0.0%) |
| Firefighting & Prevention | 0 (0.0%) | 0 (0.0%) |
| Law Enforcement | 0 (0.0%) | 0 (0.0%) |
| Food Preparation & Serving | 10 (55.6%) | 8 (44.4%) |
| Cleaning & Maintenance | 5 (45.5%) | 6 (54.5%) |
| Personal Care & Service | 0 (0.0%) | 17 (100.0%) |
| Total (Category) | 15 (28.3%) | 38 (71.7%) |
| Total (Overall) | 262 (56.5%) | 202 (43.5%) |
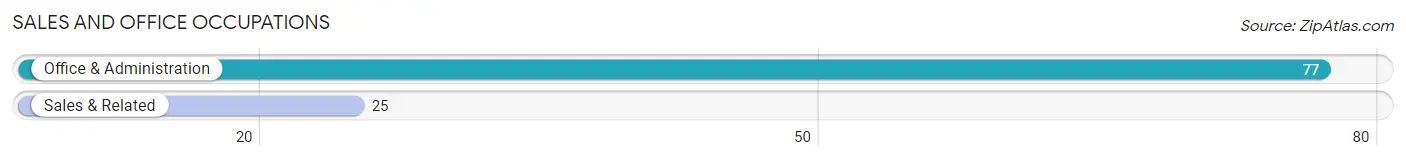
Sales and Office Occupations
The most common Sales and Office occupations in Stockton are Office & Administration (77 | 16.6%), and Sales & Related (25 | 5.4%).
Sales and Office Occupations by Sex
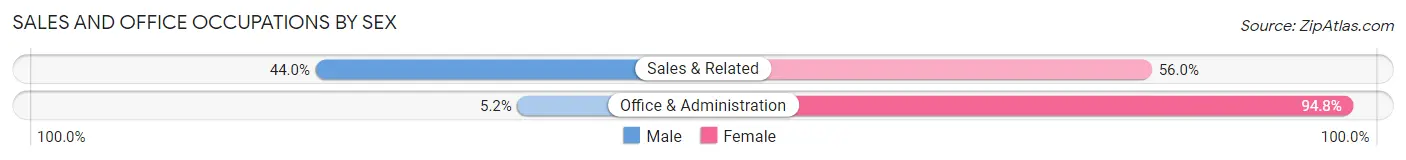
| Occupation | Male | Female |
| Sales & Related | 11 (44.0%) | 14 (56.0%) |
| Office & Administration | 4 (5.2%) | 73 (94.8%) |
| Total (Category) | 15 (14.7%) | 87 (85.3%) |
| Total (Overall) | 262 (56.5%) | 202 (43.5%) |
Natural Resources, Construction and Maintenance Occupations
The most common Natural Resources, Construction and Maintenance occupations in Stockton are Construction & Extraction (37 | 8.0%), and Installation, Maintenance & Repair (8 | 1.7%).
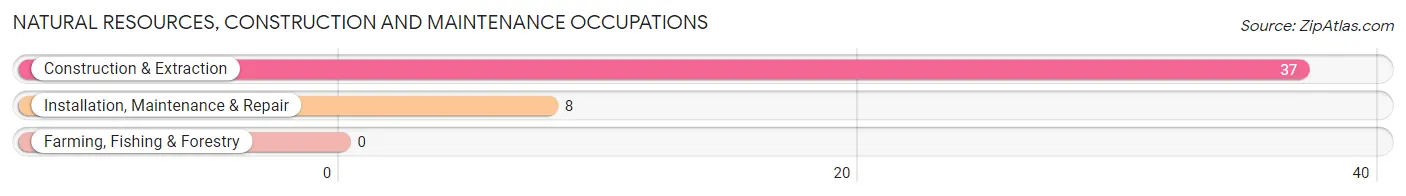
Natural Resources, Construction and Maintenance Occupations by Sex
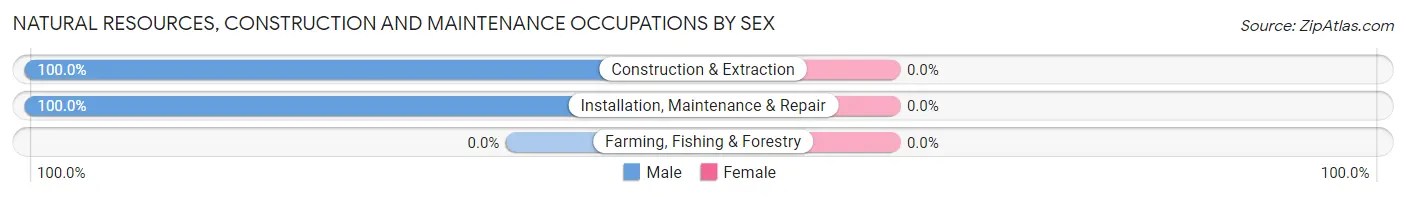
| Occupation | Male | Female |
| Farming, Fishing & Forestry | 0 (0.0%) | 0 (0.0%) |
| Construction & Extraction | 37 (100.0%) | 0 (0.0%) |
| Installation, Maintenance & Repair | 8 (100.0%) | 0 (0.0%) |
| Total (Category) | 45 (100.0%) | 0 (0.0%) |
| Total (Overall) | 262 (56.5%) | 202 (43.5%) |
Production, Transportation and Moving Occupations
The most common Production, Transportation and Moving occupations in Stockton are Transportation (94 | 20.3%), Production (58 | 12.5%), and Material Moving (12 | 2.6%).
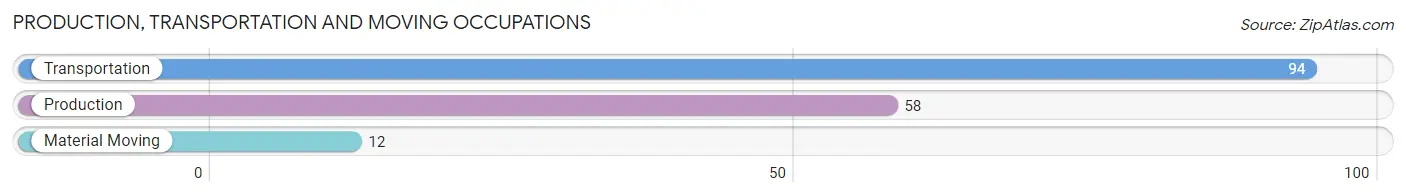
Production, Transportation and Moving Occupations by Sex
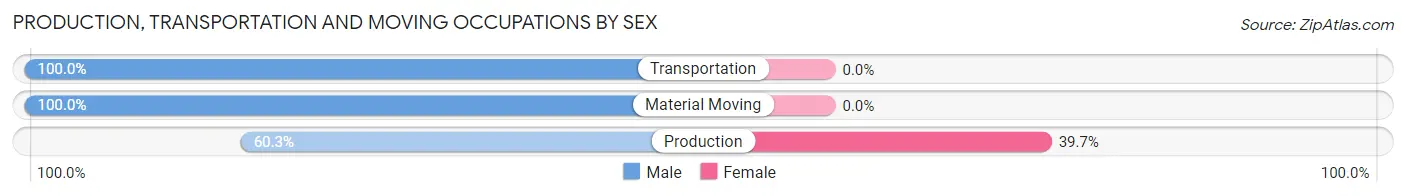
| Occupation | Male | Female |
| Production | 35 (60.3%) | 23 (39.7%) |
| Transportation | 94 (100.0%) | 0 (0.0%) |
| Material Moving | 12 (100.0%) | 0 (0.0%) |
| Total (Category) | 141 (86.0%) | 23 (14.0%) |
| Total (Overall) | 262 (56.5%) | 202 (43.5%) |
Employment Industries by Sex in Stockton
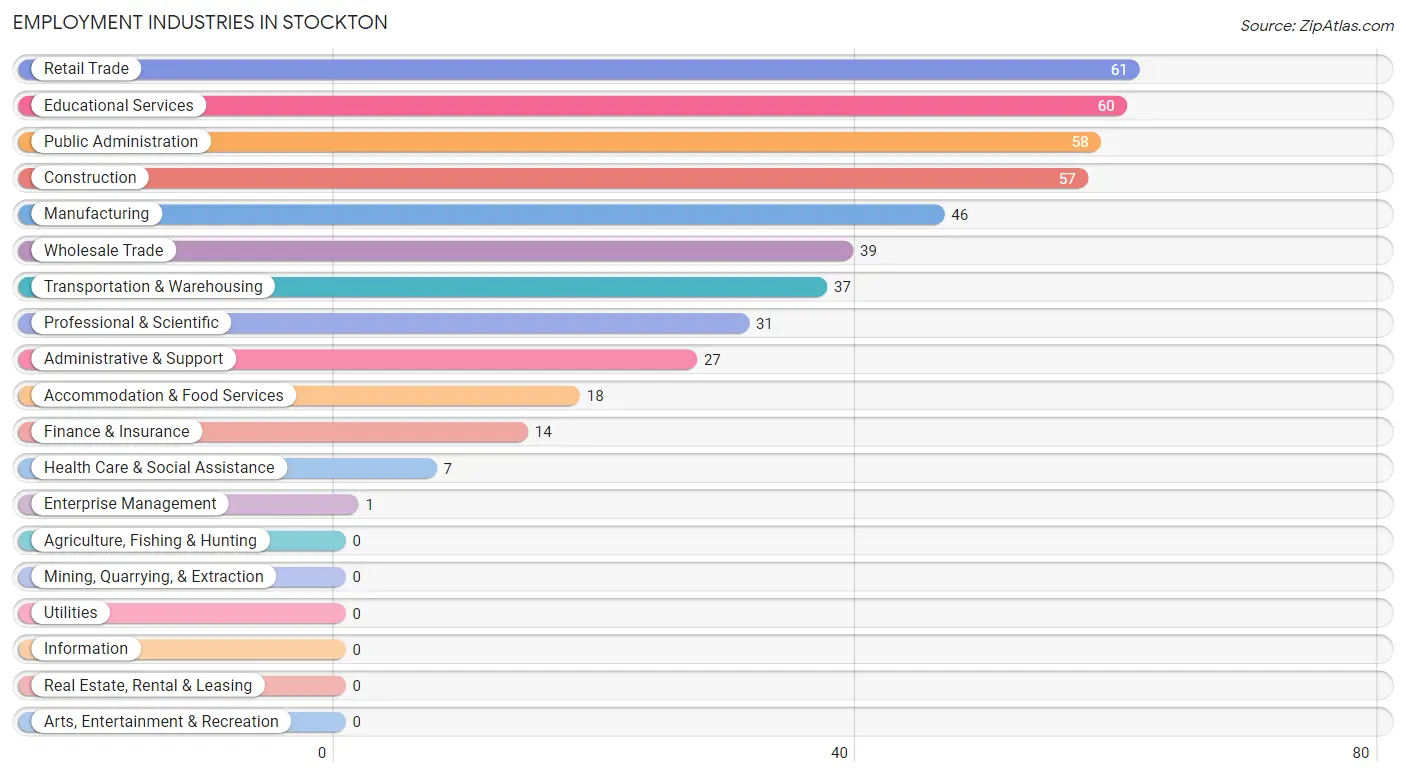
Employment Industries in Stockton
The major employment industries in Stockton include Retail Trade (61 | 13.2%), Educational Services (60 | 12.9%), Public Administration (58 | 12.5%), Construction (57 | 12.3%), and Manufacturing (46 | 9.9%).
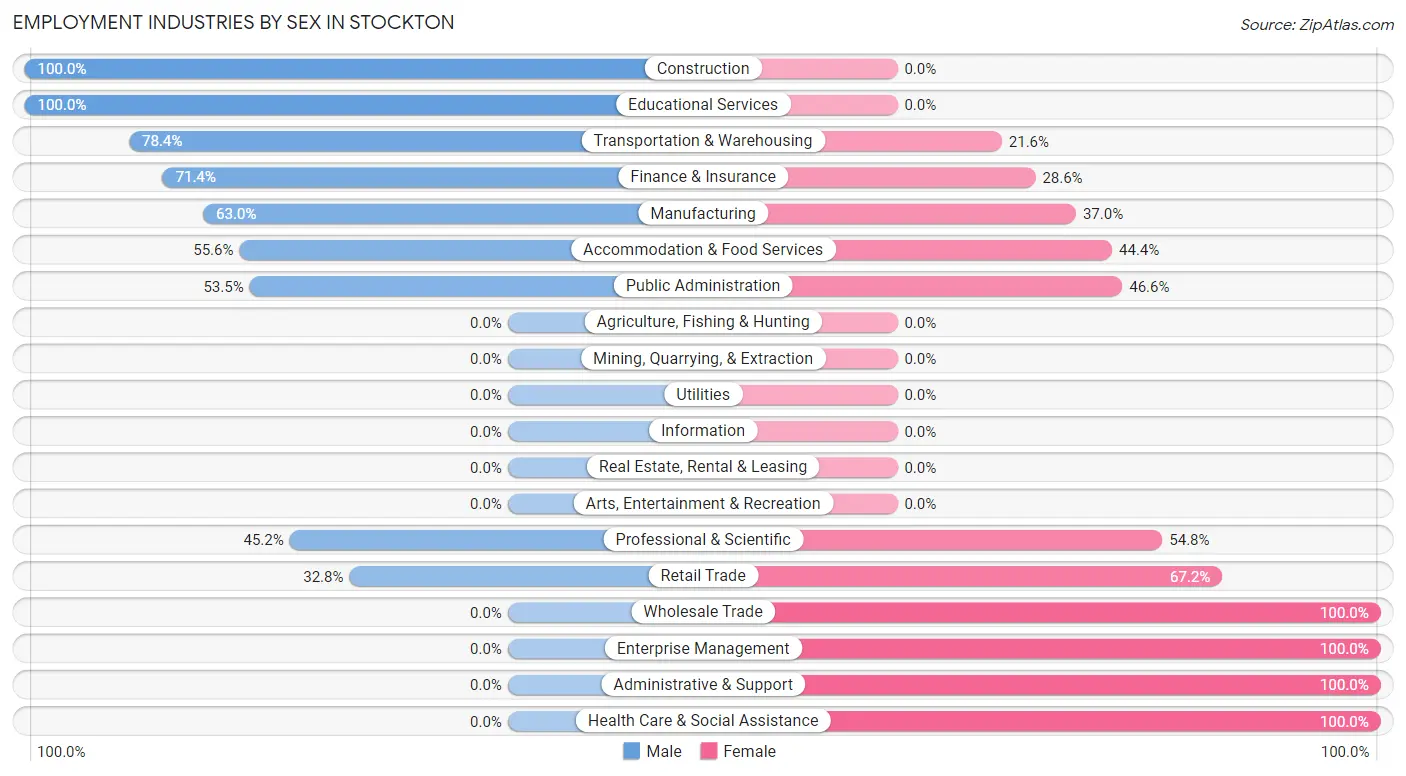
Employment Industries by Sex in Stockton
The Stockton industries that see more men than women are Construction (100.0%), Educational Services (100.0%), and Transportation & Warehousing (78.4%), whereas the industries that tend to have a higher number of women are Wholesale Trade (100.0%), Enterprise Management (100.0%), and Administrative & Support (100.0%).
| Industry | Male | Female |
| Agriculture, Fishing & Hunting | 0 (0.0%) | 0 (0.0%) |
| Mining, Quarrying, & Extraction | 0 (0.0%) | 0 (0.0%) |
| Construction | 57 (100.0%) | 0 (0.0%) |
| Manufacturing | 29 (63.0%) | 17 (37.0%) |
| Wholesale Trade | 0 (0.0%) | 39 (100.0%) |
| Retail Trade | 20 (32.8%) | 41 (67.2%) |
| Transportation & Warehousing | 29 (78.4%) | 8 (21.6%) |
| Utilities | 0 (0.0%) | 0 (0.0%) |
| Information | 0 (0.0%) | 0 (0.0%) |
| Finance & Insurance | 10 (71.4%) | 4 (28.6%) |
| Real Estate, Rental & Leasing | 0 (0.0%) | 0 (0.0%) |
| Professional & Scientific | 14 (45.2%) | 17 (54.8%) |
| Enterprise Management | 0 (0.0%) | 1 (100.0%) |
| Administrative & Support | 0 (0.0%) | 27 (100.0%) |
| Educational Services | 60 (100.0%) | 0 (0.0%) |
| Health Care & Social Assistance | 0 (0.0%) | 7 (100.0%) |
| Arts, Entertainment & Recreation | 0 (0.0%) | 0 (0.0%) |
| Accommodation & Food Services | 10 (55.6%) | 8 (44.4%) |
| Public Administration | 31 (53.4%) | 27 (46.6%) |
| Total | 262 (56.5%) | 202 (43.5%) |
Education in Stockton
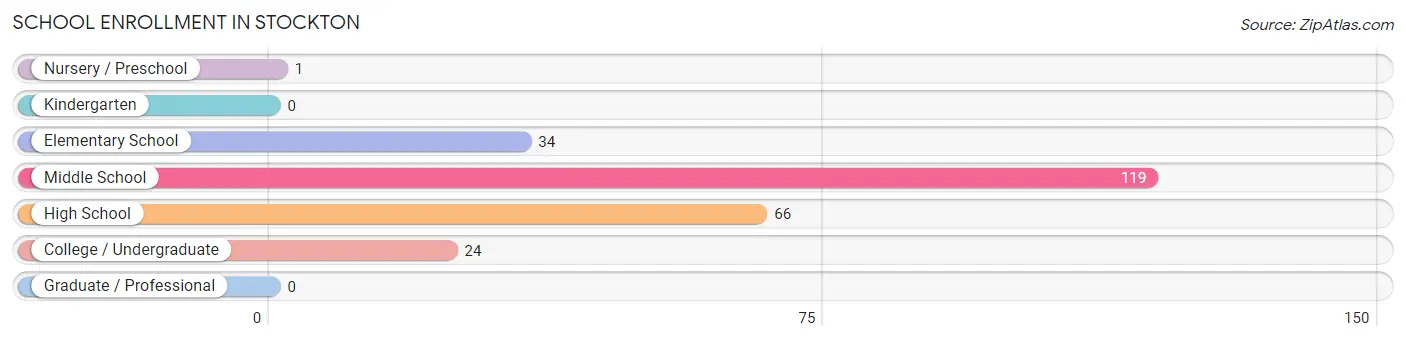
School Enrollment in Stockton
The most common levels of schooling among the 244 students in Stockton are middle school (119 | 48.8%), high school (66 | 27.1%), and elementary school (34 | 13.9%).
| School Level | # Students | % Students |
| Nursery / Preschool | 1 | 0.4% |
| Kindergarten | 0 | 0.0% |
| Elementary School | 34 | 13.9% |
| Middle School | 119 | 48.8% |
| High School | 66 | 27.1% |
| College / Undergraduate | 24 | 9.8% |
| Graduate / Professional | 0 | 0.0% |
| Total | 244 | 100.0% |
School Enrollment by Age by Funding Source in Stockton
Out of a total of 244 students who are enrolled in schools in Stockton, 15 (6.1%) attend a private institution, while the remaining 229 (93.9%) are enrolled in public schools. The age group of 25 to 34 year olds has the highest likelihood of being enrolled in private schools, with 6 (100.0% in the age bracket) enrolled. Conversely, the age group of 3 to 4 year olds has the lowest likelihood of being enrolled in a private school, with 1 (100.0% in the age bracket) attending a public institution.
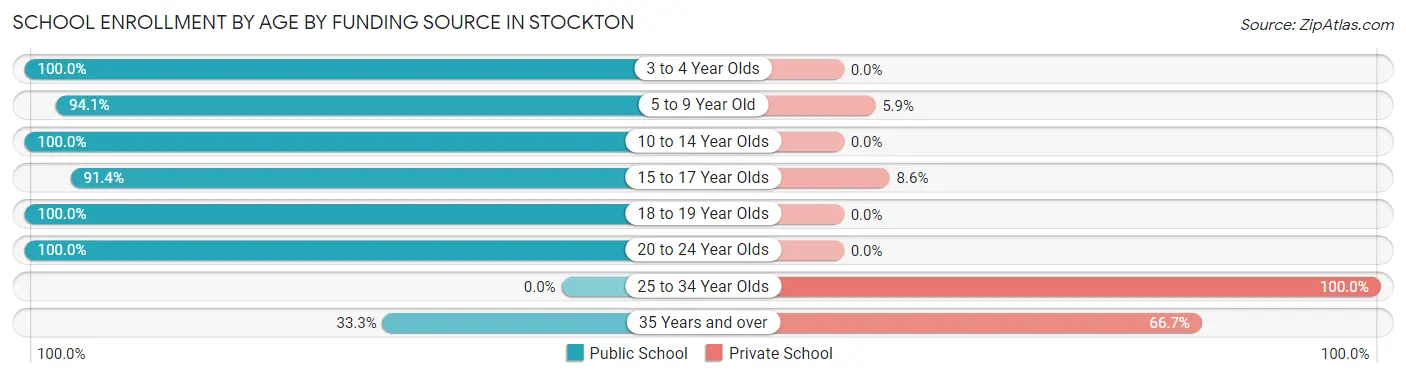
| Age Bracket | Public School | Private School |
| 3 to 4 Year Olds | 1 (100.0%) | 0 (0.0%) |
| 5 to 9 Year Old | 32 (94.1%) | 2 (5.9%) |
| 10 to 14 Year Olds | 137 (100.0%) | 0 (0.0%) |
| 15 to 17 Year Olds | 32 (91.4%) | 3 (8.6%) |
| 18 to 19 Year Olds | 6 (100.0%) | 0 (0.0%) |
| 20 to 24 Year Olds | 19 (100.0%) | 0 (0.0%) |
| 25 to 34 Year Olds | 0 (0.0%) | 6 (100.0%) |
| 35 Years and over | 2 (33.3%) | 4 (66.7%) |
| Total | 229 (93.9%) | 15 (6.1%) |
Educational Attainment by Field of Study in Stockton
Social sciences (14 | 37.8%), bio, nature & agricultural (8 | 21.6%), arts & humanities (8 | 21.6%), liberal arts & history (4 | 10.8%), and physical & health sciences (3 | 8.1%) are the most common fields of study among 37 individuals in Stockton who have obtained a bachelor's degree or higher.
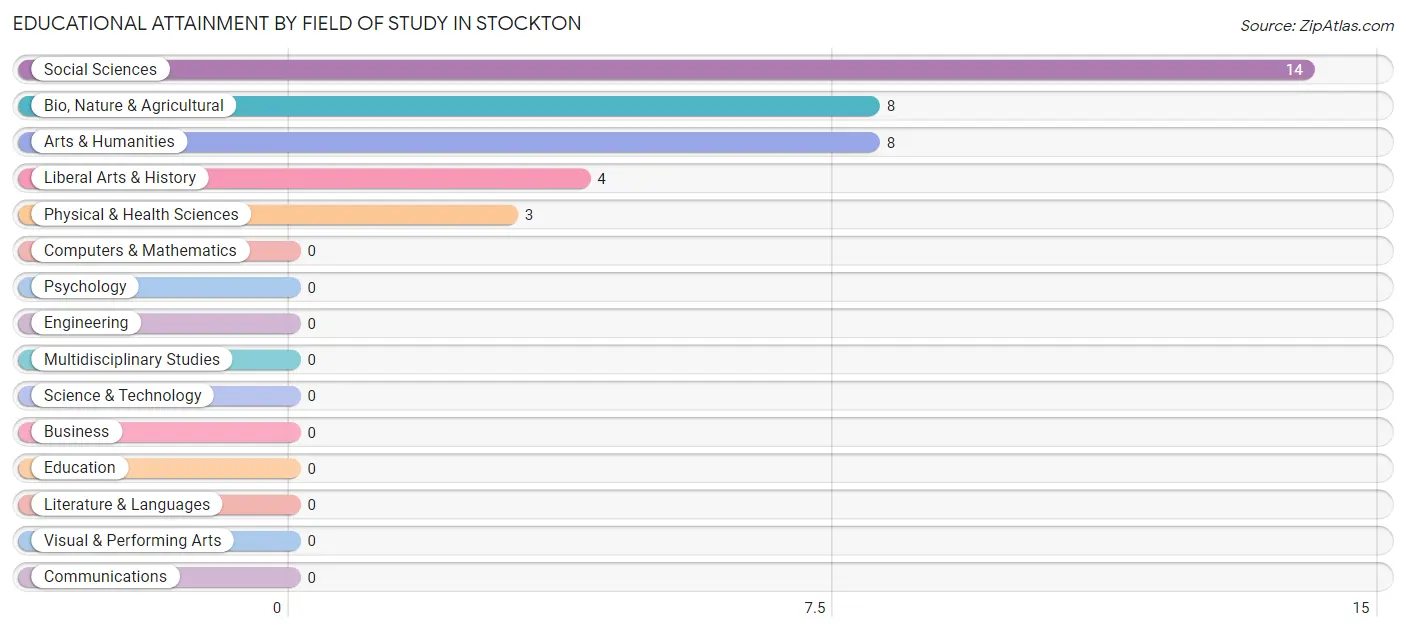
| Field of Study | # Graduates | % Graduates |
| Computers & Mathematics | 0 | 0.0% |
| Bio, Nature & Agricultural | 8 | 21.6% |
| Physical & Health Sciences | 3 | 8.1% |
| Psychology | 0 | 0.0% |
| Social Sciences | 14 | 37.8% |
| Engineering | 0 | 0.0% |
| Multidisciplinary Studies | 0 | 0.0% |
| Science & Technology | 0 | 0.0% |
| Business | 0 | 0.0% |
| Education | 0 | 0.0% |
| Literature & Languages | 0 | 0.0% |
| Liberal Arts & History | 4 | 10.8% |
| Visual & Performing Arts | 0 | 0.0% |
| Communications | 0 | 0.0% |
| Arts & Humanities | 8 | 21.6% |
| Total | 37 | 100.0% |
Transportation & Commute in Stockton
Vehicle Availability by Sex in Stockton
The most prevalent vehicle ownership categories in Stockton are males with 4 vehicles (66, accounting for 31.9%) and females with 4 vehicles (78, making up 33.3%).
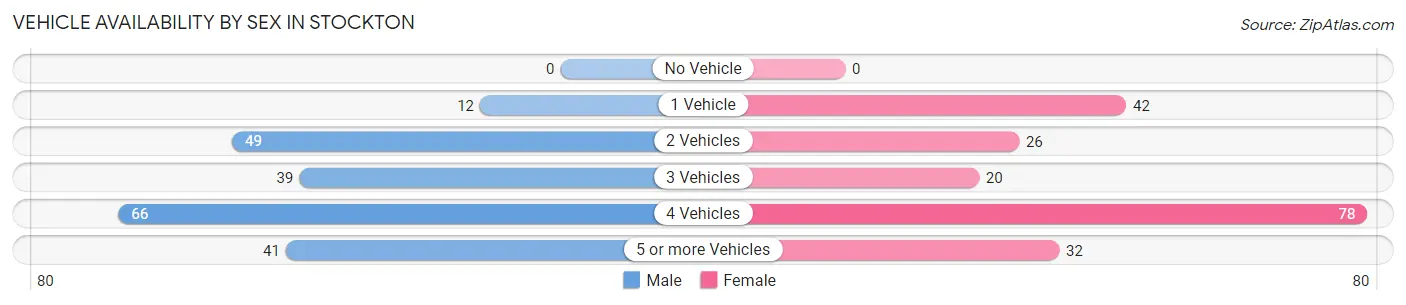
| Vehicles Available | Male | Female |
| No Vehicle | 0 (0.0%) | 0 (0.0%) |
| 1 Vehicle | 12 (5.8%) | 42 (21.2%) |
| 2 Vehicles | 49 (23.7%) | 26 (13.1%) |
| 3 Vehicles | 39 (18.8%) | 20 (10.1%) |
| 4 Vehicles | 66 (31.9%) | 78 (39.4%) |
| 5 or more Vehicles | 41 (19.8%) | 32 (16.2%) |
| Total | 207 (100.0%) | 198 (100.0%) |
Commute Time in Stockton
The most frequently occuring commute durations in Stockton are 15 to 19 minutes (84 commuters, 23.0%), 45 to 59 minutes (48 commuters, 13.1%), and 5 to 9 minutes (47 commuters, 12.8%).
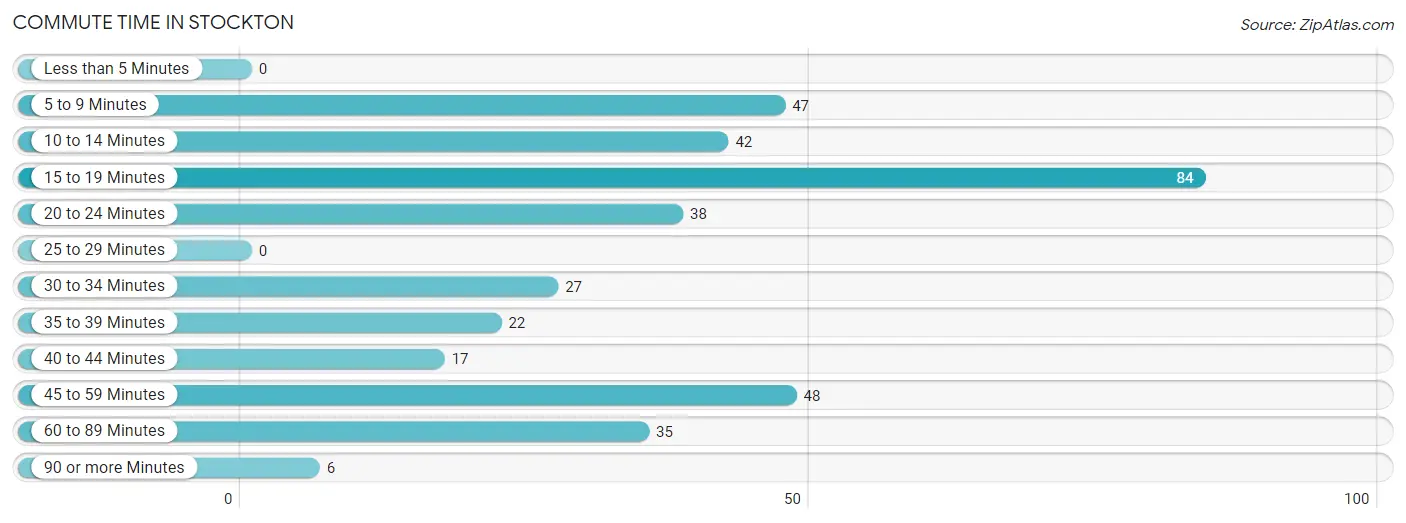
| Commute Time | # Commuters | % Commuters |
| Less than 5 Minutes | 0 | 0.0% |
| 5 to 9 Minutes | 47 | 12.8% |
| 10 to 14 Minutes | 42 | 11.5% |
| 15 to 19 Minutes | 84 | 23.0% |
| 20 to 24 Minutes | 38 | 10.4% |
| 25 to 29 Minutes | 0 | 0.0% |
| 30 to 34 Minutes | 27 | 7.4% |
| 35 to 39 Minutes | 22 | 6.0% |
| 40 to 44 Minutes | 17 | 4.6% |
| 45 to 59 Minutes | 48 | 13.1% |
| 60 to 89 Minutes | 35 | 9.6% |
| 90 or more Minutes | 6 | 1.6% |
Commute Time by Sex in Stockton
The most common commute times in Stockton are 20 to 24 minutes (38 commuters, 18.4%) for males and 15 to 19 minutes (68 commuters, 42.8%) for females.
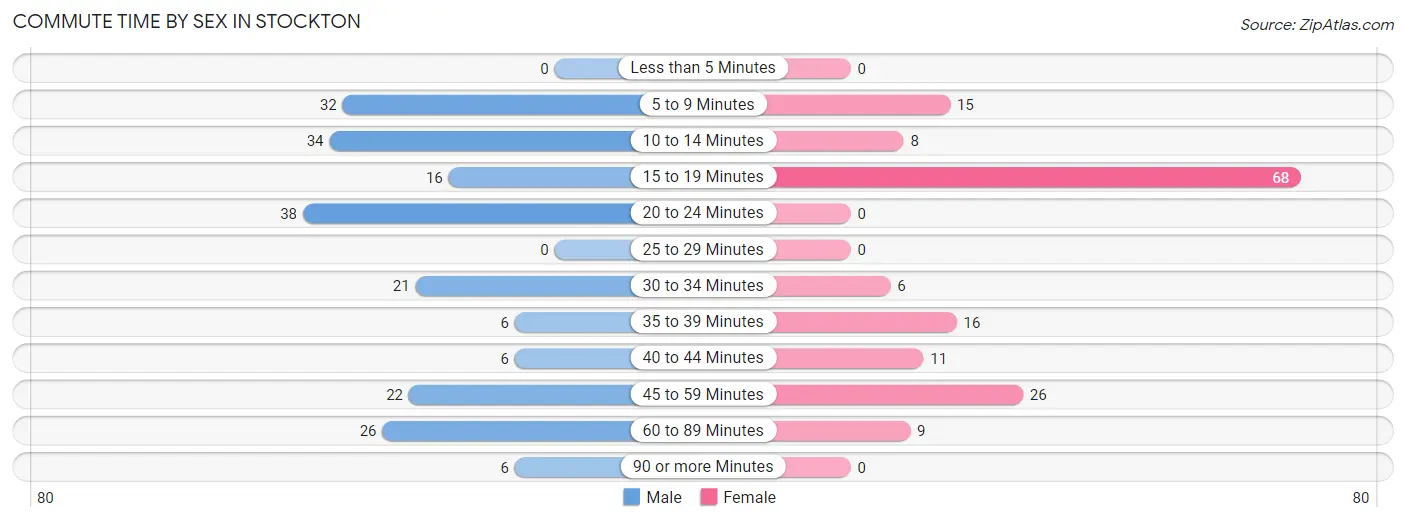
| Commute Time | Male | Female |
| Less than 5 Minutes | 0 (0.0%) | 0 (0.0%) |
| 5 to 9 Minutes | 32 (15.5%) | 15 (9.4%) |
| 10 to 14 Minutes | 34 (16.4%) | 8 (5.0%) |
| 15 to 19 Minutes | 16 (7.7%) | 68 (42.8%) |
| 20 to 24 Minutes | 38 (18.4%) | 0 (0.0%) |
| 25 to 29 Minutes | 0 (0.0%) | 0 (0.0%) |
| 30 to 34 Minutes | 21 (10.1%) | 6 (3.8%) |
| 35 to 39 Minutes | 6 (2.9%) | 16 (10.1%) |
| 40 to 44 Minutes | 6 (2.9%) | 11 (6.9%) |
| 45 to 59 Minutes | 22 (10.6%) | 26 (16.4%) |
| 60 to 89 Minutes | 26 (12.6%) | 9 (5.7%) |
| 90 or more Minutes | 6 (2.9%) | 0 (0.0%) |
Time of Departure to Work by Sex in Stockton
The most frequent times of departure to work in Stockton are 5:30 AM to 5:59 AM (46, 22.2%) for males and 6:00 AM to 6:29 AM (38, 23.9%) for females.
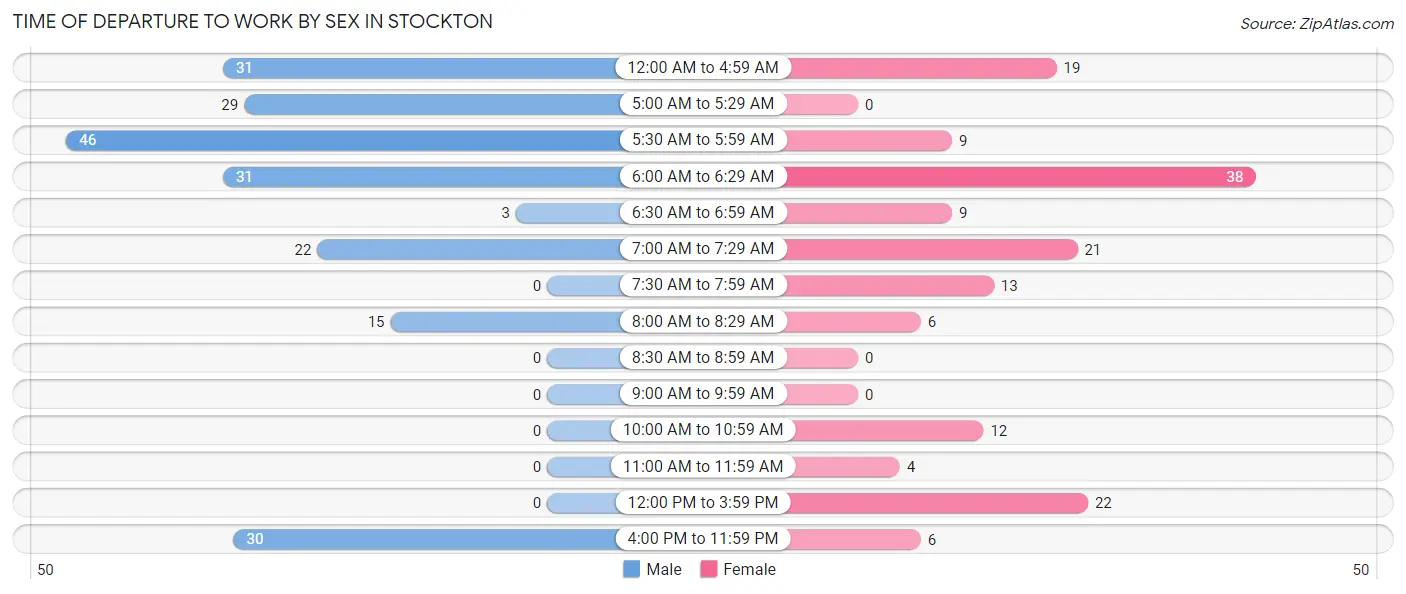
| Time of Departure | Male | Female |
| 12:00 AM to 4:59 AM | 31 (15.0%) | 19 (11.9%) |
| 5:00 AM to 5:29 AM | 29 (14.0%) | 0 (0.0%) |
| 5:30 AM to 5:59 AM | 46 (22.2%) | 9 (5.7%) |
| 6:00 AM to 6:29 AM | 31 (15.0%) | 38 (23.9%) |
| 6:30 AM to 6:59 AM | 3 (1.5%) | 9 (5.7%) |
| 7:00 AM to 7:29 AM | 22 (10.6%) | 21 (13.2%) |
| 7:30 AM to 7:59 AM | 0 (0.0%) | 13 (8.2%) |
| 8:00 AM to 8:29 AM | 15 (7.2%) | 6 (3.8%) |
| 8:30 AM to 8:59 AM | 0 (0.0%) | 0 (0.0%) |
| 9:00 AM to 9:59 AM | 0 (0.0%) | 0 (0.0%) |
| 10:00 AM to 10:59 AM | 0 (0.0%) | 12 (7.5%) |
| 11:00 AM to 11:59 AM | 0 (0.0%) | 4 (2.5%) |
| 12:00 PM to 3:59 PM | 0 (0.0%) | 22 (13.8%) |
| 4:00 PM to 11:59 PM | 30 (14.5%) | 6 (3.8%) |
| Total | 207 (100.0%) | 159 (100.0%) |
Housing Occupancy in Stockton
Occupancy by Ownership in Stockton
Of the total 287 dwellings in Stockton, owner-occupied units account for 272 (94.8%), while renter-occupied units make up 15 (5.2%).
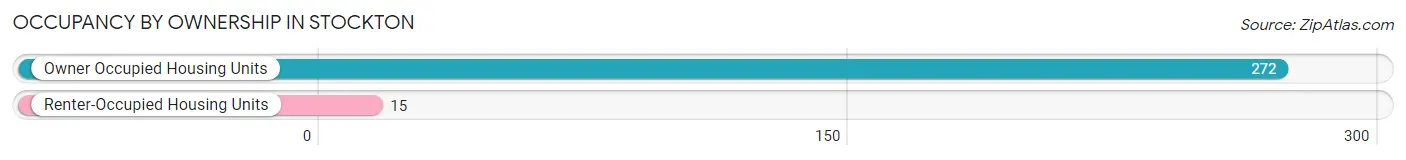
| Occupancy | # Housing Units | % Housing Units |
| Owner Occupied Housing Units | 272 | 94.8% |
| Renter-Occupied Housing Units | 15 | 5.2% |
| Total Occupied Housing Units | 287 | 100.0% |
Occupancy by Household Size in Stockton
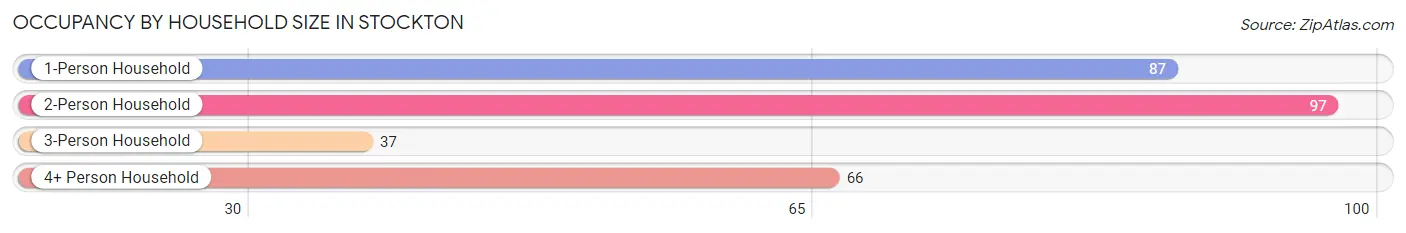
| Household Size | # Housing Units | % Housing Units |
| 1-Person Household | 87 | 30.3% |
| 2-Person Household | 97 | 33.8% |
| 3-Person Household | 37 | 12.9% |
| 4+ Person Household | 66 | 23.0% |
| Total Housing Units | 287 | 100.0% |
Occupancy by Ownership by Household Size in Stockton
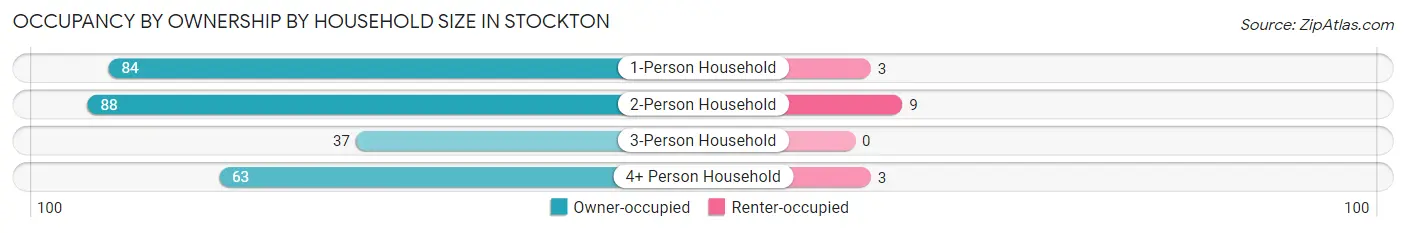
| Household Size | Owner-occupied | Renter-occupied |
| 1-Person Household | 84 (96.6%) | 3 (3.5%) |
| 2-Person Household | 88 (90.7%) | 9 (9.3%) |
| 3-Person Household | 37 (100.0%) | 0 (0.0%) |
| 4+ Person Household | 63 (95.5%) | 3 (4.5%) |
| Total Housing Units | 272 (94.8%) | 15 (5.2%) |
Occupancy by Educational Attainment in Stockton
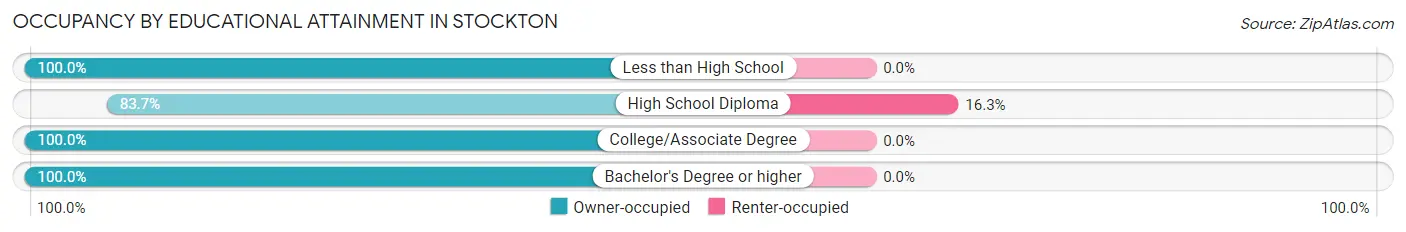
| Household Size | Owner-occupied | Renter-occupied |
| Less than High School | 3 (100.0%) | 0 (0.0%) |
| High School Diploma | 77 (83.7%) | 15 (16.3%) |
| College/Associate Degree | 166 (100.0%) | 0 (0.0%) |
| Bachelor's Degree or higher | 26 (100.0%) | 0 (0.0%) |
Occupancy by Age of Householder in Stockton
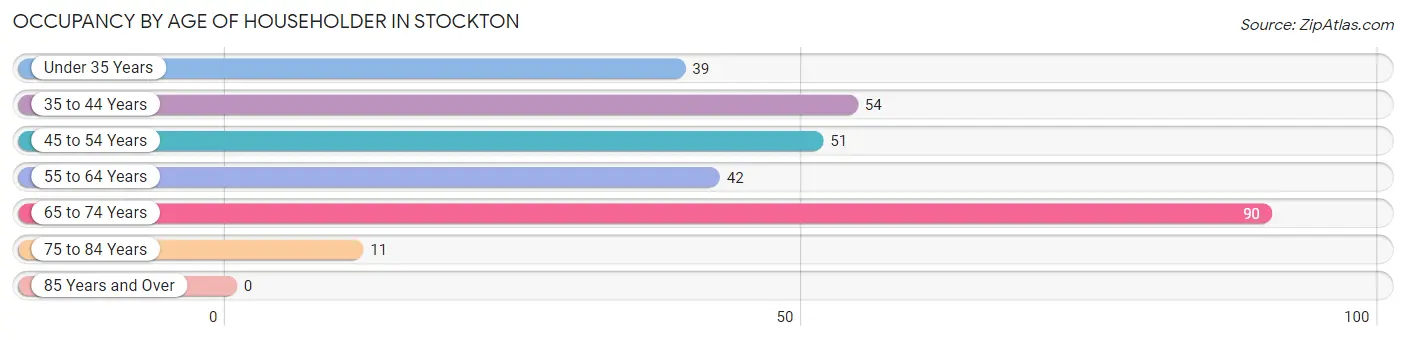
| Age Bracket | # Households | % Households |
| Under 35 Years | 39 | 13.6% |
| 35 to 44 Years | 54 | 18.8% |
| 45 to 54 Years | 51 | 17.8% |
| 55 to 64 Years | 42 | 14.6% |
| 65 to 74 Years | 90 | 31.4% |
| 75 to 84 Years | 11 | 3.8% |
| 85 Years and Over | 0 | 0.0% |
| Total | 287 | 100.0% |
Housing Finances in Stockton
Median Income by Occupancy in Stockton
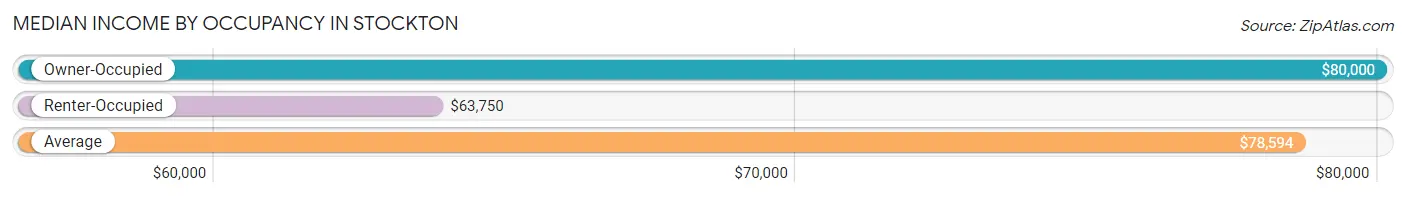
| Occupancy Type | # Households | Median Income |
| Owner-Occupied | 272 (94.8%) | $80,000 |
| Renter-Occupied | 15 (5.2%) | $63,750 |
| Average | 287 (100.0%) | $78,594 |
Occupancy by Householder Income Bracket in Stockton
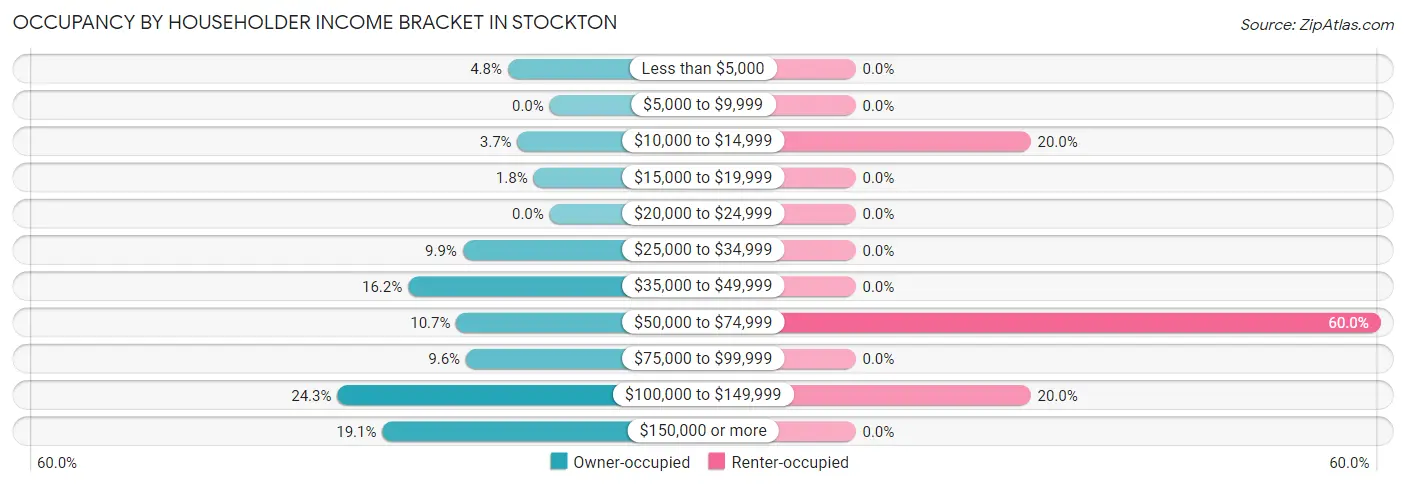
| Income Bracket | Owner-occupied | Renter-occupied |
| Less than $5,000 | 13 (4.8%) | 0 (0.0%) |
| $5,000 to $9,999 | 0 (0.0%) | 0 (0.0%) |
| $10,000 to $14,999 | 10 (3.7%) | 3 (20.0%) |
| $15,000 to $19,999 | 5 (1.8%) | 0 (0.0%) |
| $20,000 to $24,999 | 0 (0.0%) | 0 (0.0%) |
| $25,000 to $34,999 | 27 (9.9%) | 0 (0.0%) |
| $35,000 to $49,999 | 44 (16.2%) | 0 (0.0%) |
| $50,000 to $74,999 | 29 (10.7%) | 9 (60.0%) |
| $75,000 to $99,999 | 26 (9.6%) | 0 (0.0%) |
| $100,000 to $149,999 | 66 (24.3%) | 3 (20.0%) |
| $150,000 or more | 52 (19.1%) | 0 (0.0%) |
| Total | 272 (100.0%) | 15 (100.0%) |
Monthly Housing Cost Tiers in Stockton
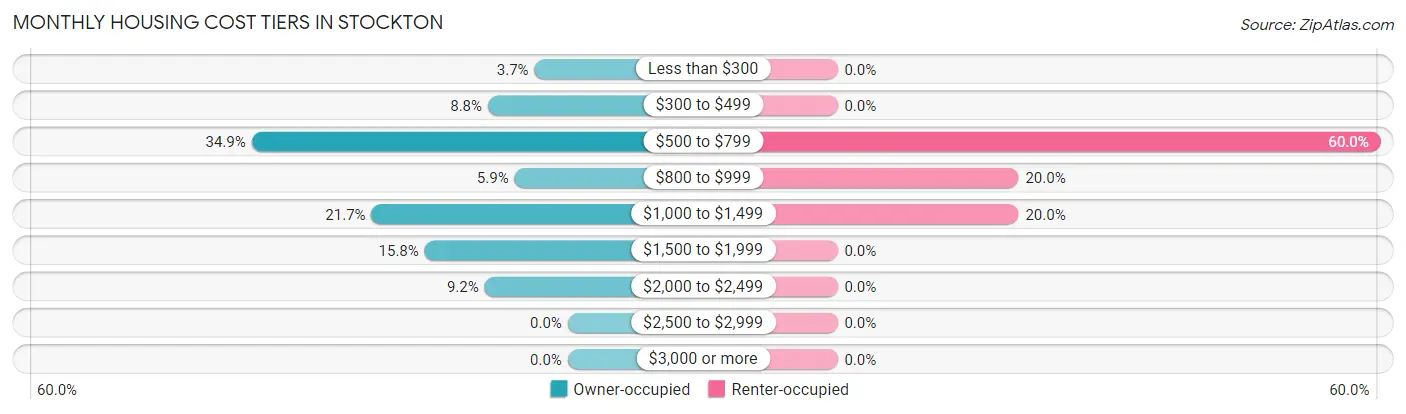
| Monthly Cost | Owner-occupied | Renter-occupied |
| Less than $300 | 10 (3.7%) | 0 (0.0%) |
| $300 to $499 | 24 (8.8%) | 0 (0.0%) |
| $500 to $799 | 95 (34.9%) | 9 (60.0%) |
| $800 to $999 | 16 (5.9%) | 3 (20.0%) |
| $1,000 to $1,499 | 59 (21.7%) | 3 (20.0%) |
| $1,500 to $1,999 | 43 (15.8%) | 0 (0.0%) |
| $2,000 to $2,499 | 25 (9.2%) | 0 (0.0%) |
| $2,500 to $2,999 | 0 (0.0%) | 0 (0.0%) |
| $3,000 or more | 0 (0.0%) | 0 (0.0%) |
| Total | 272 (100.0%) | 15 (100.0%) |
Physical Housing Characteristics in Stockton
Housing Structures in Stockton
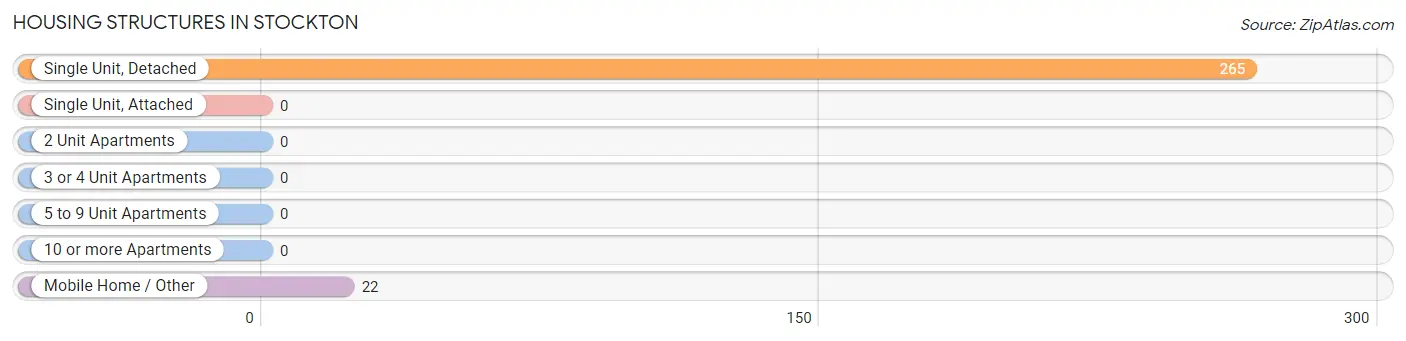
| Structure Type | # Housing Units | % Housing Units |
| Single Unit, Detached | 265 | 92.3% |
| Single Unit, Attached | 0 | 0.0% |
| 2 Unit Apartments | 0 | 0.0% |
| 3 or 4 Unit Apartments | 0 | 0.0% |
| 5 to 9 Unit Apartments | 0 | 0.0% |
| 10 or more Apartments | 0 | 0.0% |
| Mobile Home / Other | 22 | 7.7% |
| Total | 287 | 100.0% |
Housing Structures by Occupancy in Stockton
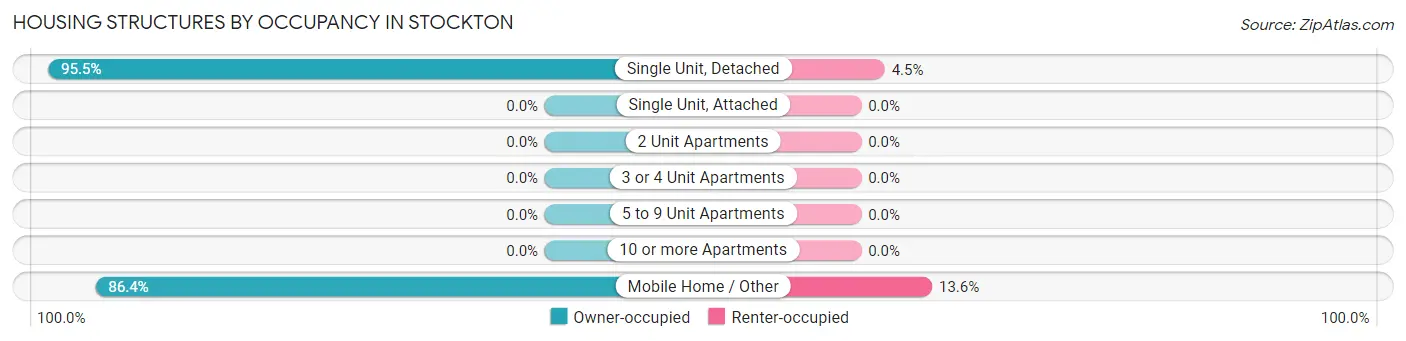
| Structure Type | Owner-occupied | Renter-occupied |
| Single Unit, Detached | 253 (95.5%) | 12 (4.5%) |
| Single Unit, Attached | 0 (0.0%) | 0 (0.0%) |
| 2 Unit Apartments | 0 (0.0%) | 0 (0.0%) |
| 3 or 4 Unit Apartments | 0 (0.0%) | 0 (0.0%) |
| 5 to 9 Unit Apartments | 0 (0.0%) | 0 (0.0%) |
| 10 or more Apartments | 0 (0.0%) | 0 (0.0%) |
| Mobile Home / Other | 19 (86.4%) | 3 (13.6%) |
| Total | 272 (94.8%) | 15 (5.2%) |
Housing Structures by Number of Rooms in Stockton
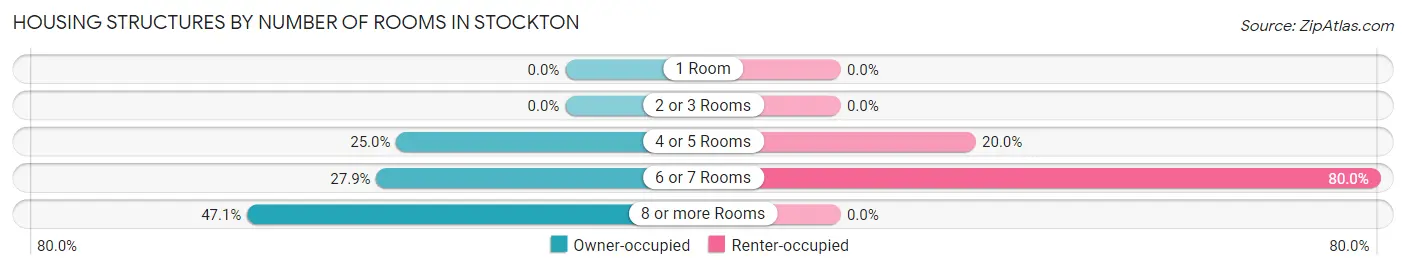
| Number of Rooms | Owner-occupied | Renter-occupied |
| 1 Room | 0 (0.0%) | 0 (0.0%) |
| 2 or 3 Rooms | 0 (0.0%) | 0 (0.0%) |
| 4 or 5 Rooms | 68 (25.0%) | 3 (20.0%) |
| 6 or 7 Rooms | 76 (27.9%) | 12 (80.0%) |
| 8 or more Rooms | 128 (47.1%) | 0 (0.0%) |
| Total | 272 (100.0%) | 15 (100.0%) |
Housing Structure by Heating Type in Stockton
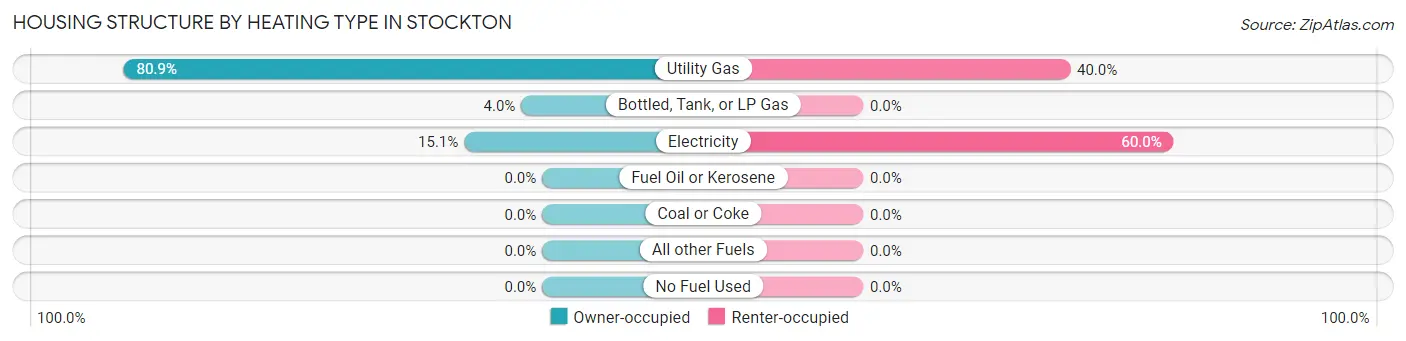
| Heating Type | Owner-occupied | Renter-occupied |
| Utility Gas | 220 (80.9%) | 6 (40.0%) |
| Bottled, Tank, or LP Gas | 11 (4.0%) | 0 (0.0%) |
| Electricity | 41 (15.1%) | 9 (60.0%) |
| Fuel Oil or Kerosene | 0 (0.0%) | 0 (0.0%) |
| Coal or Coke | 0 (0.0%) | 0 (0.0%) |
| All other Fuels | 0 (0.0%) | 0 (0.0%) |
| No Fuel Used | 0 (0.0%) | 0 (0.0%) |
| Total | 272 (100.0%) | 15 (100.0%) |
Household Vehicle Usage in Stockton
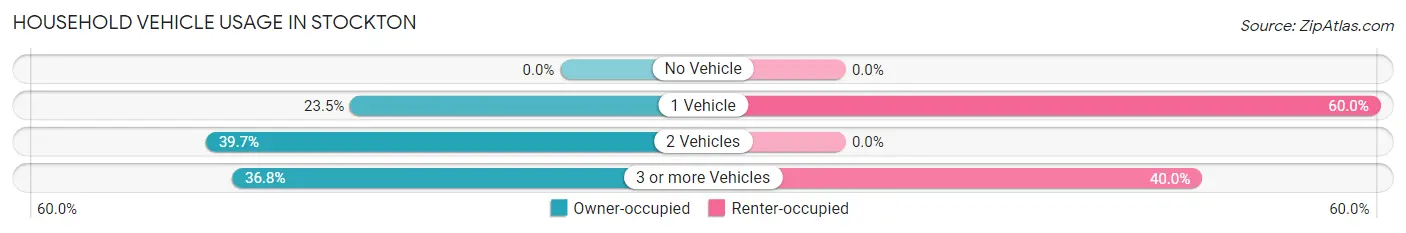
| Vehicles per Household | Owner-occupied | Renter-occupied |
| No Vehicle | 0 (0.0%) | 0 (0.0%) |
| 1 Vehicle | 64 (23.5%) | 9 (60.0%) |
| 2 Vehicles | 108 (39.7%) | 0 (0.0%) |
| 3 or more Vehicles | 100 (36.8%) | 6 (40.0%) |
| Total | 272 (100.0%) | 15 (100.0%) |
Real Estate & Mortgages in Stockton
Real Estate and Mortgage Overview in Stockton
| Characteristic | Without Mortgage | With Mortgage |
| Housing Units | 111 | 161 |
| Median Property Value | $432,100 | $270,100 |
| Median Household Income | $135,982 | $22 |
| Monthly Housing Costs | $709 | $0 |
| Real Estate Taxes | $3,122 | $16 |
Property Value by Mortgage Status in Stockton
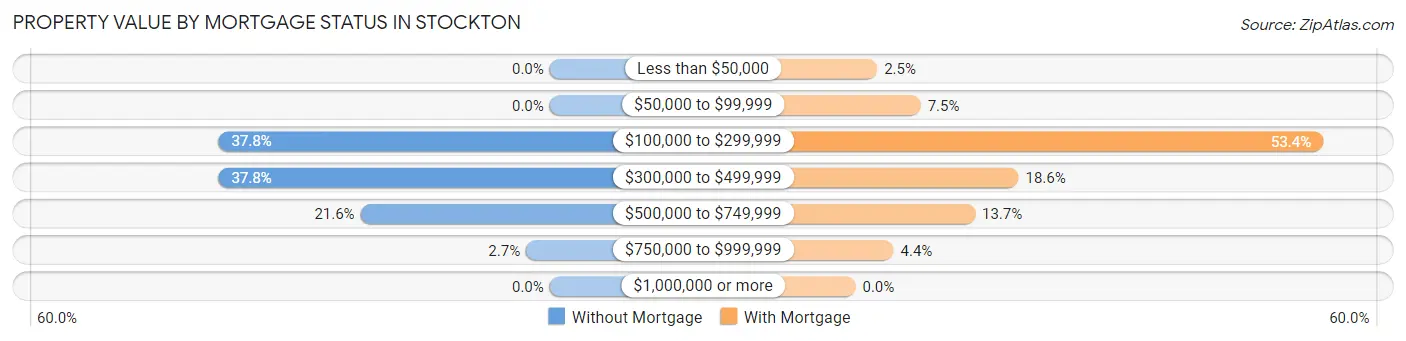
| Property Value | Without Mortgage | With Mortgage |
| Less than $50,000 | 0 (0.0%) | 4 (2.5%) |
| $50,000 to $99,999 | 0 (0.0%) | 12 (7.4%) |
| $100,000 to $299,999 | 42 (37.8%) | 86 (53.4%) |
| $300,000 to $499,999 | 42 (37.8%) | 30 (18.6%) |
| $500,000 to $749,999 | 24 (21.6%) | 22 (13.7%) |
| $750,000 to $999,999 | 3 (2.7%) | 7 (4.3%) |
| $1,000,000 or more | 0 (0.0%) | 0 (0.0%) |
| Total | 111 (100.0%) | 161 (100.0%) |
Household Income by Mortgage Status in Stockton
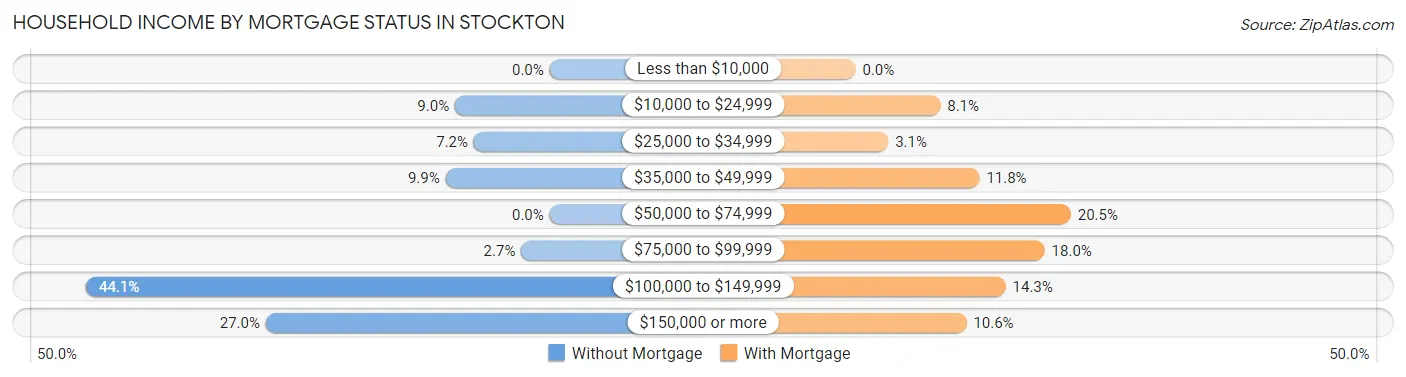
| Household Income | Without Mortgage | With Mortgage |
| Less than $10,000 | 0 (0.0%) | 0 (0.0%) |
| $10,000 to $24,999 | 10 (9.0%) | 13 (8.1%) |
| $25,000 to $34,999 | 8 (7.2%) | 5 (3.1%) |
| $35,000 to $49,999 | 11 (9.9%) | 19 (11.8%) |
| $50,000 to $74,999 | 0 (0.0%) | 33 (20.5%) |
| $75,000 to $99,999 | 3 (2.7%) | 29 (18.0%) |
| $100,000 to $149,999 | 49 (44.1%) | 23 (14.3%) |
| $150,000 or more | 30 (27.0%) | 17 (10.6%) |
| Total | 111 (100.0%) | 161 (100.0%) |
Property Value to Household Income Ratio in Stockton
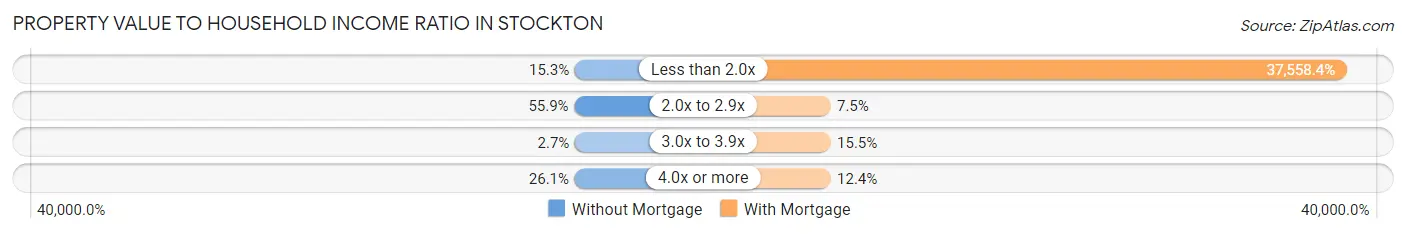
| Value-to-Income Ratio | Without Mortgage | With Mortgage |
| Less than 2.0x | 17 (15.3%) | 60,469 (37,558.4%) |
| 2.0x to 2.9x | 62 (55.9%) | 12 (7.4%) |
| 3.0x to 3.9x | 3 (2.7%) | 25 (15.5%) |
| 4.0x or more | 29 (26.1%) | 20 (12.4%) |
| Total | 111 (100.0%) | 161 (100.0%) |
Real Estate Taxes by Mortgage Status in Stockton

| Property Taxes | Without Mortgage | With Mortgage |
| Less than $800 | 17 (15.3%) | 0 (0.0%) |
| $800 to $1,499 | 13 (11.7%) | 7 (4.3%) |
| $800 to $1,499 | 81 (73.0%) | 44 (27.3%) |
| Total | 111 (100.0%) | 161 (100.0%) |
Health & Disability in Stockton
Health Insurance Coverage by Age in Stockton
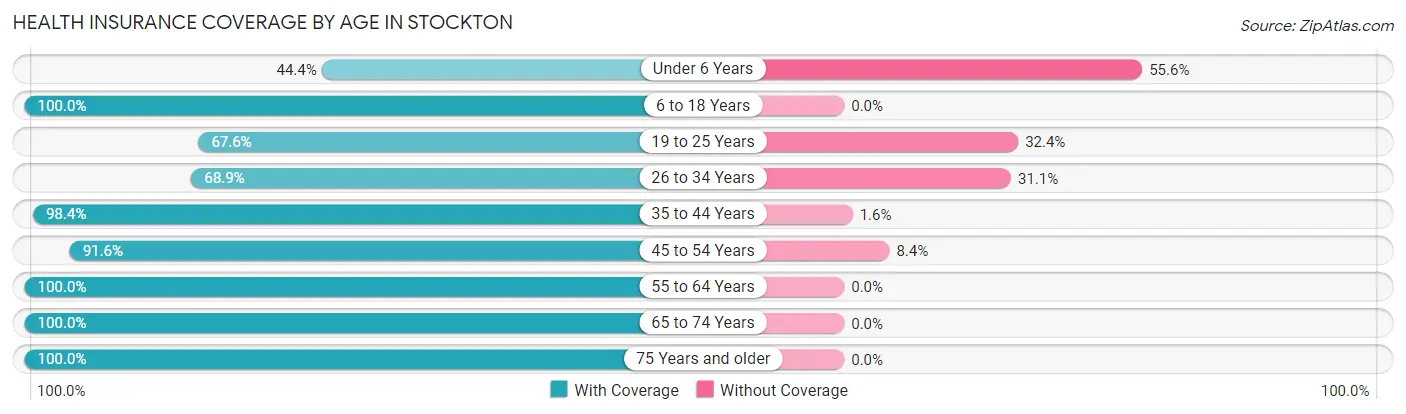
| Age Bracket | With Coverage | Without Coverage |
| Under 6 Years | 12 (44.4%) | 15 (55.6%) |
| 6 to 18 Years | 231 (100.0%) | 0 (0.0%) |
| 19 to 25 Years | 75 (67.6%) | 36 (32.4%) |
| 26 to 34 Years | 31 (68.9%) | 14 (31.1%) |
| 35 to 44 Years | 125 (98.4%) | 2 (1.6%) |
| 45 to 54 Years | 87 (91.6%) | 8 (8.4%) |
| 55 to 64 Years | 104 (100.0%) | 0 (0.0%) |
| 65 to 74 Years | 164 (100.0%) | 0 (0.0%) |
| 75 Years and older | 11 (100.0%) | 0 (0.0%) |
| Total | 840 (91.8%) | 75 (8.2%) |
Health Insurance Coverage by Citizenship Status in Stockton
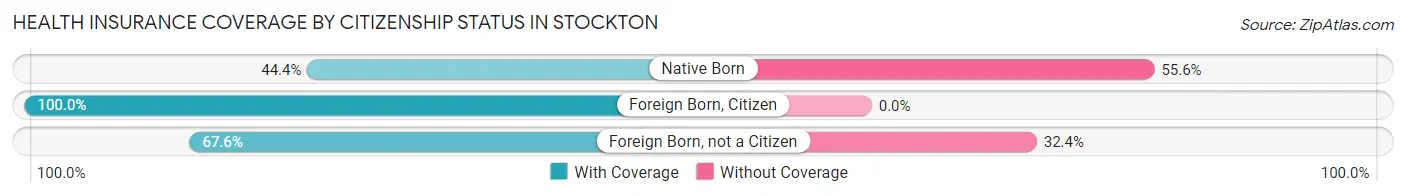
| Citizenship Status | With Coverage | Without Coverage |
| Native Born | 12 (44.4%) | 15 (55.6%) |
| Foreign Born, Citizen | 231 (100.0%) | 0 (0.0%) |
| Foreign Born, not a Citizen | 75 (67.6%) | 36 (32.4%) |
Health Insurance Coverage by Household Income in Stockton
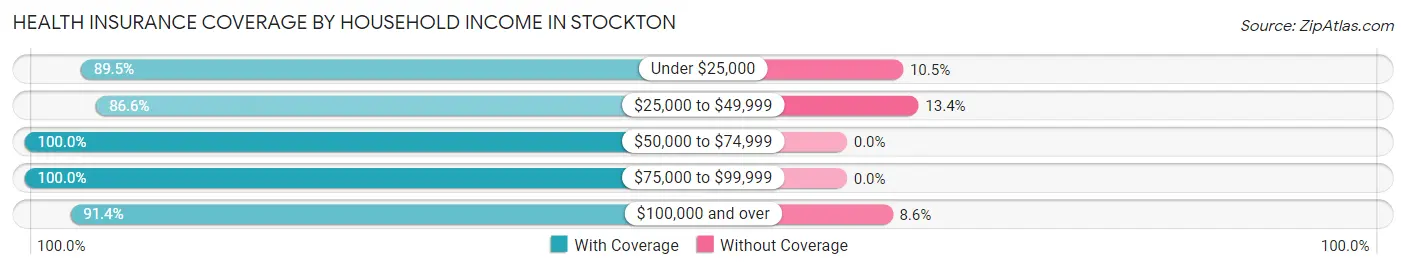
| Household Income | With Coverage | Without Coverage |
| Under $25,000 | 34 (89.5%) | 4 (10.5%) |
| $25,000 to $49,999 | 129 (86.6%) | 20 (13.4%) |
| $50,000 to $74,999 | 64 (100.0%) | 0 (0.0%) |
| $75,000 to $99,999 | 68 (100.0%) | 0 (0.0%) |
| $100,000 and over | 545 (91.4%) | 51 (8.6%) |
Public vs Private Health Insurance Coverage by Age in Stockton
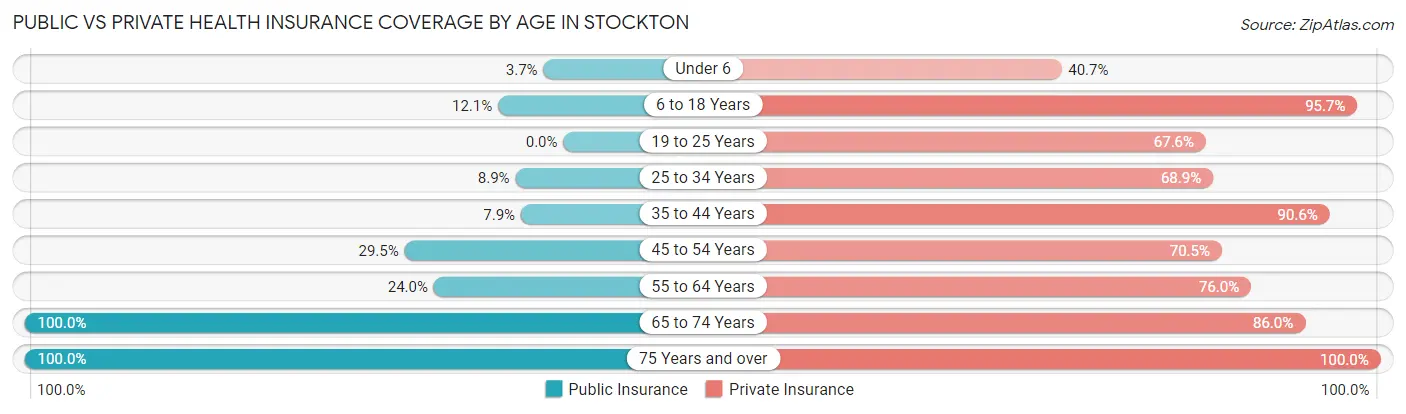
| Age Bracket | Public Insurance | Private Insurance |
| Under 6 | 1 (3.7%) | 11 (40.7%) |
| 6 to 18 Years | 28 (12.1%) | 221 (95.7%) |
| 19 to 25 Years | 0 (0.0%) | 75 (67.6%) |
| 25 to 34 Years | 4 (8.9%) | 31 (68.9%) |
| 35 to 44 Years | 10 (7.9%) | 115 (90.5%) |
| 45 to 54 Years | 28 (29.5%) | 67 (70.5%) |
| 55 to 64 Years | 25 (24.0%) | 79 (76.0%) |
| 65 to 74 Years | 164 (100.0%) | 141 (86.0%) |
| 75 Years and over | 11 (100.0%) | 11 (100.0%) |
| Total | 271 (29.6%) | 751 (82.1%) |
Disability Status by Sex by Age in Stockton
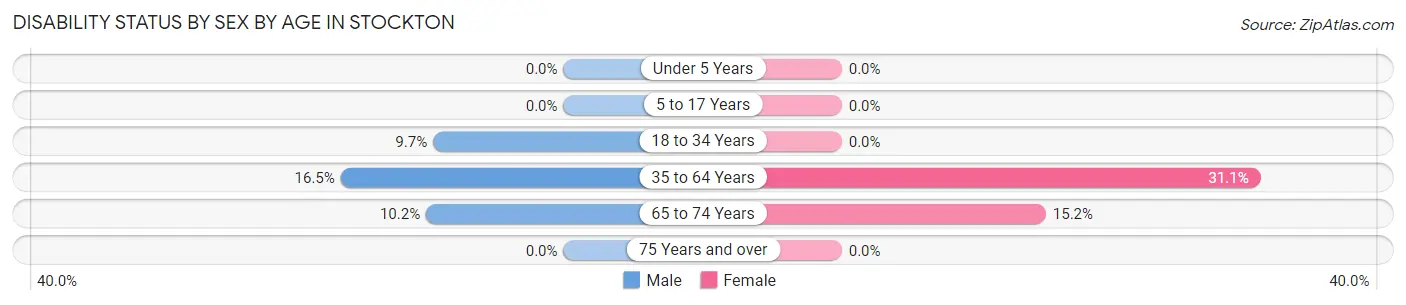
| Age Bracket | Male | Female |
| Under 5 Years | 0 (0.0%) | 0 (0.0%) |
| 5 to 17 Years | 0 (0.0%) | 0 (0.0%) |
| 18 to 34 Years | 9 (9.7%) | 0 (0.0%) |
| 35 to 64 Years | 22 (16.5%) | 60 (31.1%) |
| 65 to 74 Years | 10 (10.2%) | 10 (15.1%) |
| 75 Years and over | 0 (0.0%) | 0 (0.0%) |
Disability Class by Sex by Age in Stockton
Disability Class: Hearing Difficulty
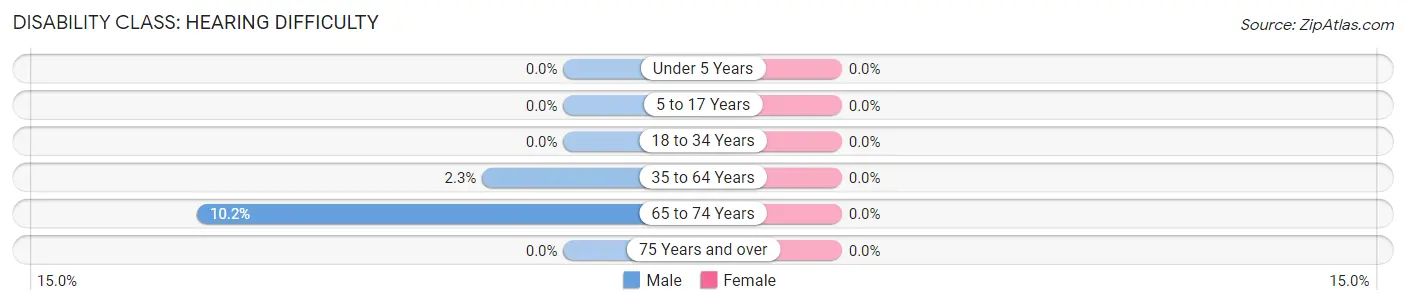
| Age Bracket | Male | Female |
| Under 5 Years | 0 (0.0%) | 0 (0.0%) |
| 5 to 17 Years | 0 (0.0%) | 0 (0.0%) |
| 18 to 34 Years | 0 (0.0%) | 0 (0.0%) |
| 35 to 64 Years | 3 (2.3%) | 0 (0.0%) |
| 65 to 74 Years | 10 (10.2%) | 0 (0.0%) |
| 75 Years and over | 0 (0.0%) | 0 (0.0%) |
Disability Class: Vision Difficulty
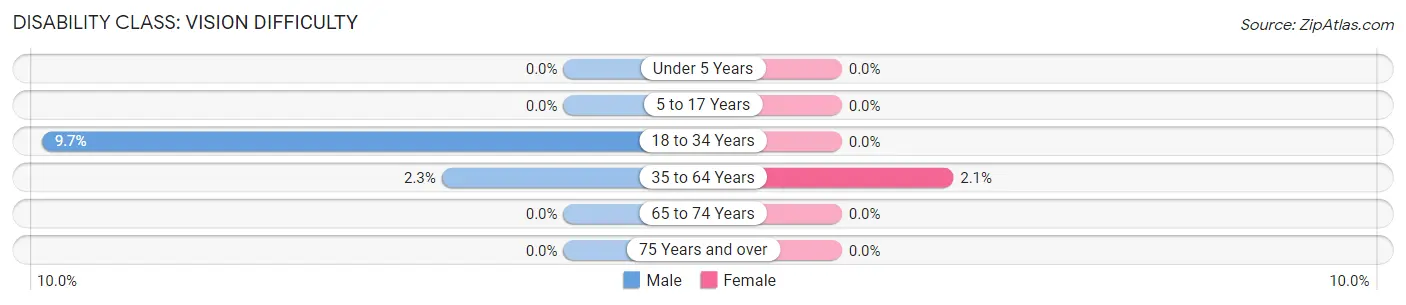
| Age Bracket | Male | Female |
| Under 5 Years | 0 (0.0%) | 0 (0.0%) |
| 5 to 17 Years | 0 (0.0%) | 0 (0.0%) |
| 18 to 34 Years | 9 (9.7%) | 0 (0.0%) |
| 35 to 64 Years | 3 (2.3%) | 4 (2.1%) |
| 65 to 74 Years | 0 (0.0%) | 0 (0.0%) |
| 75 Years and over | 0 (0.0%) | 0 (0.0%) |
Disability Class: Cognitive Difficulty
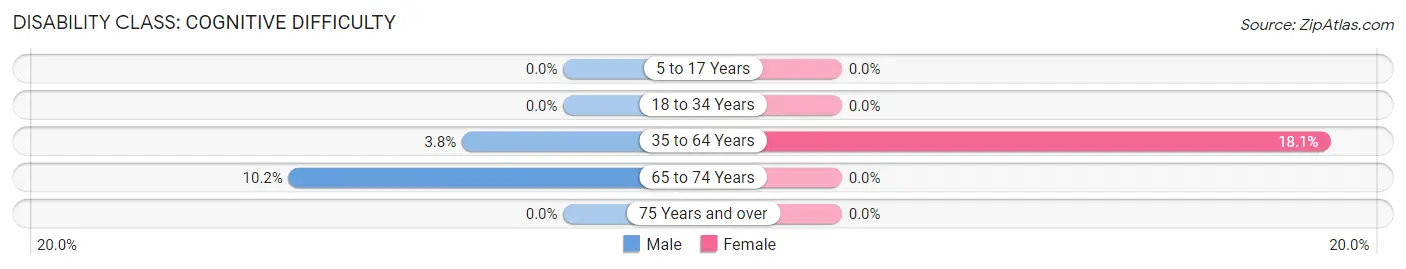
| Age Bracket | Male | Female |
| 5 to 17 Years | 0 (0.0%) | 0 (0.0%) |
| 18 to 34 Years | 0 (0.0%) | 0 (0.0%) |
| 35 to 64 Years | 5 (3.8%) | 35 (18.1%) |
| 65 to 74 Years | 10 (10.2%) | 0 (0.0%) |
| 75 Years and over | 0 (0.0%) | 0 (0.0%) |
Disability Class: Ambulatory Difficulty
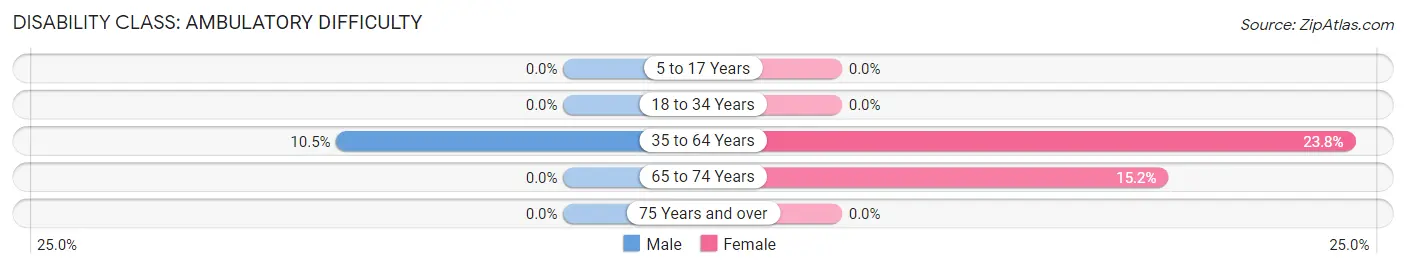
| Age Bracket | Male | Female |
| 5 to 17 Years | 0 (0.0%) | 0 (0.0%) |
| 18 to 34 Years | 0 (0.0%) | 0 (0.0%) |
| 35 to 64 Years | 14 (10.5%) | 46 (23.8%) |
| 65 to 74 Years | 0 (0.0%) | 10 (15.1%) |
| 75 Years and over | 0 (0.0%) | 0 (0.0%) |
Disability Class: Self-Care Difficulty
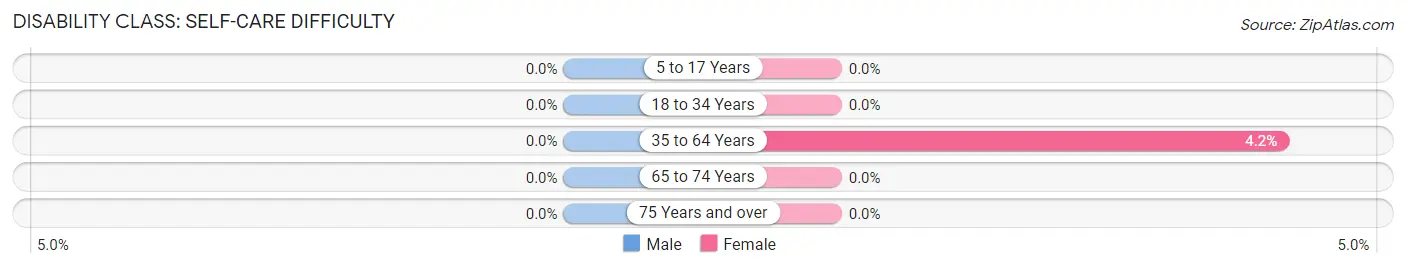
| Age Bracket | Male | Female |
| 5 to 17 Years | 0 (0.0%) | 0 (0.0%) |
| 18 to 34 Years | 0 (0.0%) | 0 (0.0%) |
| 35 to 64 Years | 0 (0.0%) | 8 (4.2%) |
| 65 to 74 Years | 0 (0.0%) | 0 (0.0%) |
| 75 Years and over | 0 (0.0%) | 0 (0.0%) |
Technology Access in Stockton
Computing Device Access in Stockton
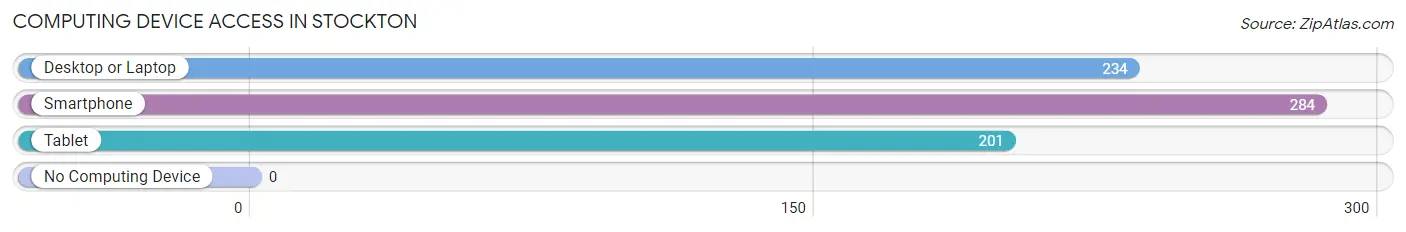
| Device Type | # Households | % Households |
| Desktop or Laptop | 234 | 81.5% |
| Smartphone | 284 | 99.0% |
| Tablet | 201 | 70.0% |
| No Computing Device | 0 | 0.0% |
| Total | 287 | 100.0% |
Internet Access in Stockton
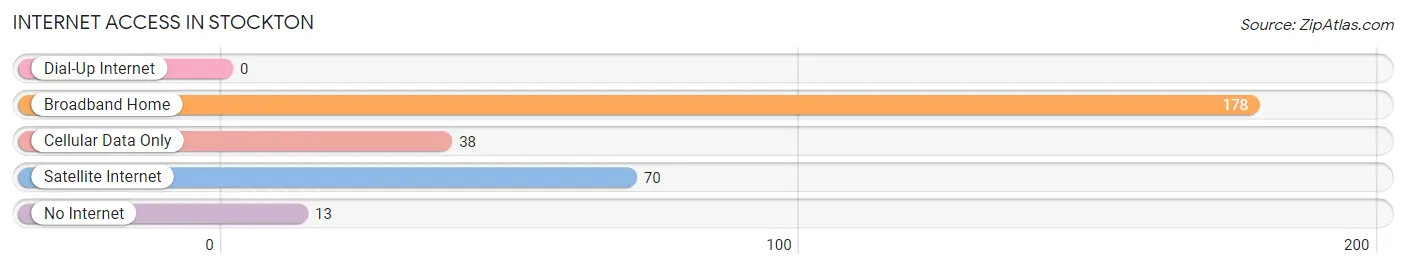
| Internet Type | # Households | % Households |
| Dial-Up Internet | 0 | 0.0% |
| Broadband Home | 178 | 62.0% |
| Cellular Data Only | 38 | 13.2% |
| Satellite Internet | 70 | 24.4% |
| No Internet | 13 | 4.5% |
| Total | 287 | 100.0% |
Stockton Summary
Stockton, Utah is a small town located in Tooele County, Utah. It is situated in the western part of the state, about 40 miles southwest of Salt Lake City. The town was founded in 1864 by Mormon pioneers and is named after the nearby Stockton Creek. As of the 2010 census, the population of Stockton was 1,845.
History
Stockton was founded in 1864 by Mormon pioneers who were sent to the area by Brigham Young. The town was named after the nearby Stockton Creek, which was named after a local Native American chief. The town was originally a farming community, and the first settlers built a fort to protect themselves from Native American attacks.
In 1868, the first school was built in Stockton. The town was incorporated in 1872 and the first post office was established in 1873. In 1876, the first church was built in Stockton.
In the late 19th century, Stockton became a popular stop on the Pony Express route. The town also became a popular stop for stagecoaches and freight wagons.
In the early 20th century, Stockton was a popular destination for tourists. The town was known for its hot springs, which were believed to have healing properties. The town also had a number of hotels and resorts.
Geography
Stockton is located in western Tooele County, Utah. It is situated at an elevation of 4,890 feet above sea level. The town is located about 40 miles southwest of Salt Lake City.
The town is situated in a semi-arid climate zone, with hot summers and cold winters. The average annual temperature is 50.2 degrees Fahrenheit. The average annual precipitation is 11.2 inches.
Economy
The economy of Stockton is largely based on agriculture. The town is home to a number of farms and ranches, which produce a variety of crops, including hay, wheat, corn, and alfalfa. The town is also home to a number of small businesses, including restaurants, retail stores, and service providers.
Demographics
As of the 2010 census, the population of Stockton was 1,845. The racial makeup of the town was 95.2% White, 0.7% African American, 0.3% Native American, 0.2% Asian, 0.1% Pacific Islander, 1.2% from other races, and 2.4% from two or more races. Hispanic or Latino of any race were 4.2% of the population.
The median income for a household in Stockton was $45,938, and the median income for a family was $50,938. The per capita income for the town was $19,938. About 8.2% of families and 10.2% of the population were below the poverty line, including 14.2% of those under age 18 and 6.2% of those age 65 or over.
Common Questions
What is Per Capita Income in Stockton?
Per Capita income in Stockton is $33,177.
What is the Median Family Income in Stockton?
Median Family Income in Stockton is $135,060.
What is the Median Household income in Stockton?
Median Household Income in Stockton is $78,594.
What is Income or Wage Gap in Stockton?
Income or Wage Gap in Stockton is 20.1%.
Women in Stockton earn 79.9 cents for every dollar earned by a man.
What is Inequality or Gini Index in Stockton?
Inequality or Gini Index in Stockton is 0.36.
What is the Total Population of Stockton?
Total Population of Stockton is 915.
What is the Total Male Population of Stockton?
Total Male Population of Stockton is 397.
What is the Total Female Population of Stockton?
Total Female Population of Stockton is 518.
What is the Ratio of Males per 100 Females in Stockton?
There are 76.64 Males per 100 Females in Stockton.
What is the Ratio of Females per 100 Males in Stockton?
There are 130.48 Females per 100 Males in Stockton.
What is the Median Population Age in Stockton?
Median Population Age in Stockton is 41.1 Years.
What is the Average Family Size in Stockton
Average Family Size in Stockton is 4.0 People.
What is the Average Household Size in Stockton
Average Household Size in Stockton is 3.2 People.
How Large is the Labor Force in Stockton?
There are 492 People in the Labor Forcein in Stockton.
What is the Percentage of People in the Labor Force in Stockton?
69.7% of People are in the Labor Force in Stockton.
What is the Unemployment Rate in Stockton?
Unemployment Rate in Stockton is 5.7%.