Snowville, UT Map & Demographics
Snowville Map
Snowville Overview
$20,393
PER CAPITA INCOME
$71,250
AVG FAMILY INCOME
$68,750
AVG HOUSEHOLD INCOME
95.1%
WAGE / INCOME GAP [ % ]
4.9¢/ $1
WAGE / INCOME GAP [ $ ]
0.18
INEQUALITY / GINI INDEX
247
TOTAL POPULATION
132
MALE POPULATION
115
FEMALE POPULATION
114.78
MALES / 100 FEMALES
87.12
FEMALES / 100 MALES
39.6
MEDIAN AGE
4.0
AVG FAMILY SIZE
3.8
AVG HOUSEHOLD SIZE
59
LABOR FORCE [ PEOPLE ]
33.0%
PERCENT IN LABOR FORCE
Snowville Zip Codes
Snowville Area Codes
Income in Snowville
Income Overview in Snowville
Per Capita Income in Snowville is $20,393, while median incomes of families and households are $71,250 and $68,750 respectively.
| Characteristic | Number | Measure |
| Per Capita Income | 247 | $20,393 |
| Median Family Income | 59 | $71,250 |
| Mean Family Income | 59 | $77,973 |
| Median Household Income | 65 | $68,750 |
| Mean Household Income | 65 | $75,389 |
| Income Deficit | 59 | $0 |
| Wage / Income Gap (%) | 247 | 95.06% |
| Wage / Income Gap ($) | 247 | 4.94¢ per $1 |
| Gini / Inequality Index | 247 | 0.18 |
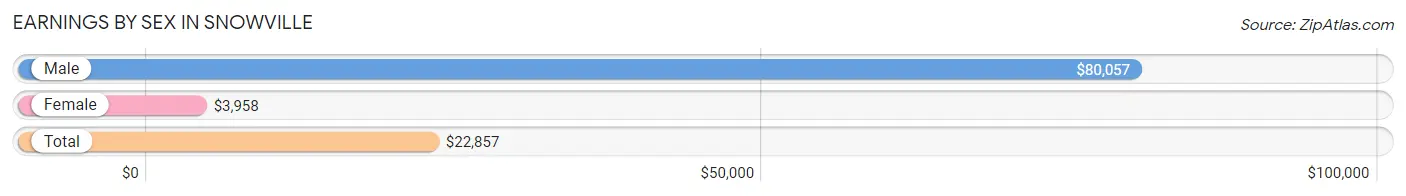
Earnings by Sex in Snowville
Average Earnings in Snowville are $22,857, $80,057 for men and $3,958 for women, a difference of 95.1%.
| Sex | Number | Average Earnings |
| Male | 47 (53.4%) | $80,057 |
| Female | 41 (46.6%) | $3,958 |
| Total | 88 (100.0%) | $22,857 |
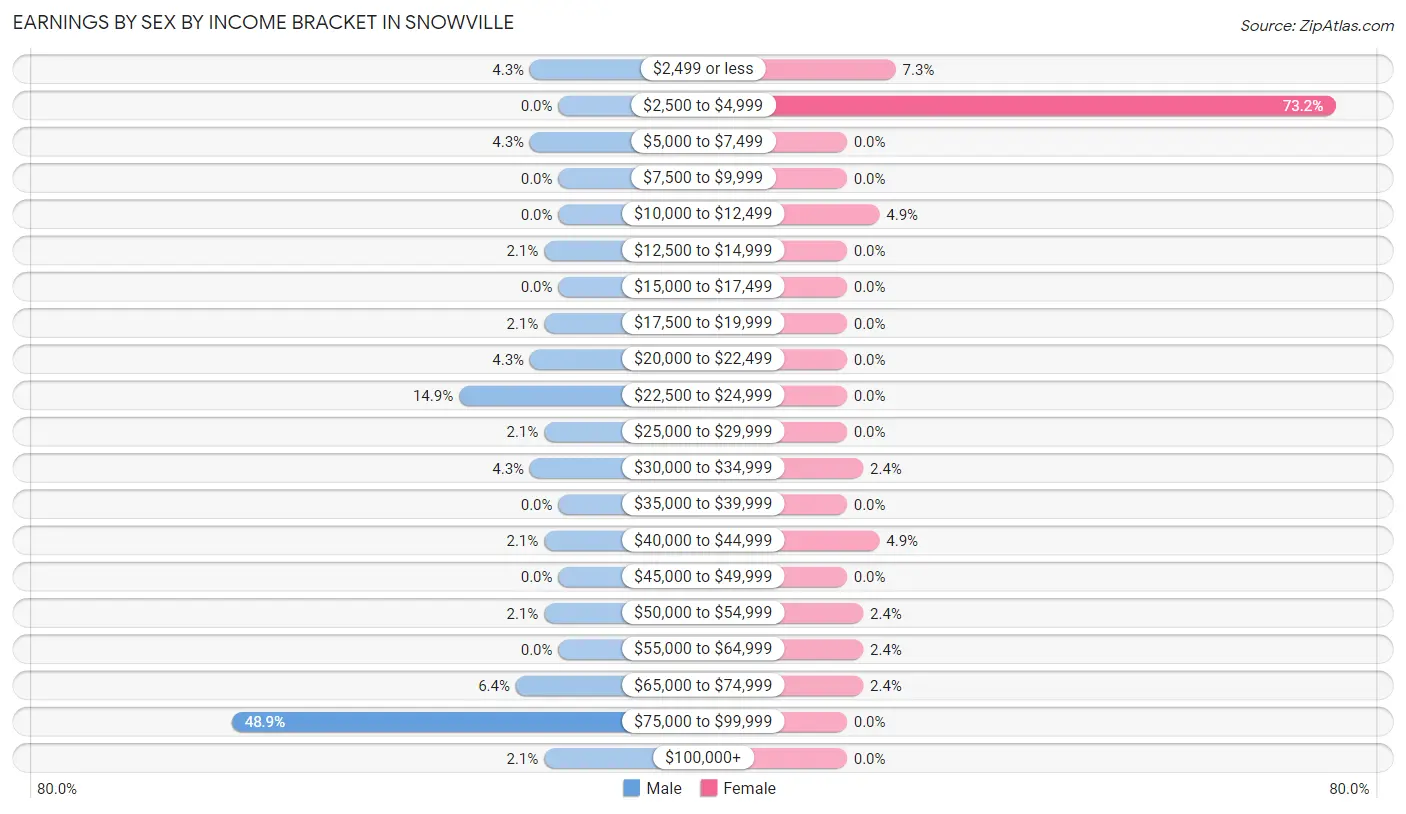
Earnings by Sex by Income Bracket in Snowville
The most common earnings brackets in Snowville are $75,000 to $99,999 for men (23 | 48.9%) and $2,500 to $4,999 for women (30 | 73.2%).
| Income | Male | Female |
| $2,499 or less | 2 (4.3%) | 3 (7.3%) |
| $2,500 to $4,999 | 0 (0.0%) | 30 (73.2%) |
| $5,000 to $7,499 | 2 (4.3%) | 0 (0.0%) |
| $7,500 to $9,999 | 0 (0.0%) | 0 (0.0%) |
| $10,000 to $12,499 | 0 (0.0%) | 2 (4.9%) |
| $12,500 to $14,999 | 1 (2.1%) | 0 (0.0%) |
| $15,000 to $17,499 | 0 (0.0%) | 0 (0.0%) |
| $17,500 to $19,999 | 1 (2.1%) | 0 (0.0%) |
| $20,000 to $22,499 | 2 (4.3%) | 0 (0.0%) |
| $22,500 to $24,999 | 7 (14.9%) | 0 (0.0%) |
| $25,000 to $29,999 | 1 (2.1%) | 0 (0.0%) |
| $30,000 to $34,999 | 2 (4.3%) | 1 (2.4%) |
| $35,000 to $39,999 | 0 (0.0%) | 0 (0.0%) |
| $40,000 to $44,999 | 1 (2.1%) | 2 (4.9%) |
| $45,000 to $49,999 | 0 (0.0%) | 0 (0.0%) |
| $50,000 to $54,999 | 1 (2.1%) | 1 (2.4%) |
| $55,000 to $64,999 | 0 (0.0%) | 1 (2.4%) |
| $65,000 to $74,999 | 3 (6.4%) | 1 (2.4%) |
| $75,000 to $99,999 | 23 (48.9%) | 0 (0.0%) |
| $100,000+ | 1 (2.1%) | 0 (0.0%) |
| Total | 47 (100.0%) | 41 (100.0%) |
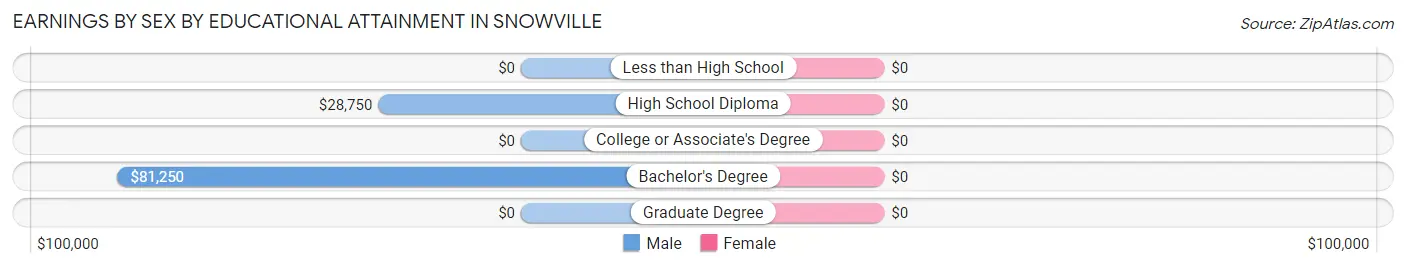
Earnings by Sex by Educational Attainment in Snowville
| Educational Attainment | Male Income | Female Income |
| Less than High School | - | - |
| High School Diploma | $28,750 | $0 |
| College or Associate's Degree | - | - |
| Bachelor's Degree | $81,250 | $0 |
| Graduate Degree | - | - |
| Total | $80,398 | $3,917 |
Family Income in Snowville
Family Income Brackets in Snowville
According to the Snowville family income data, there are 32 families falling into the $50,000 to $74,999 income range, which is the most common income bracket and makes up 54.2% of all families.
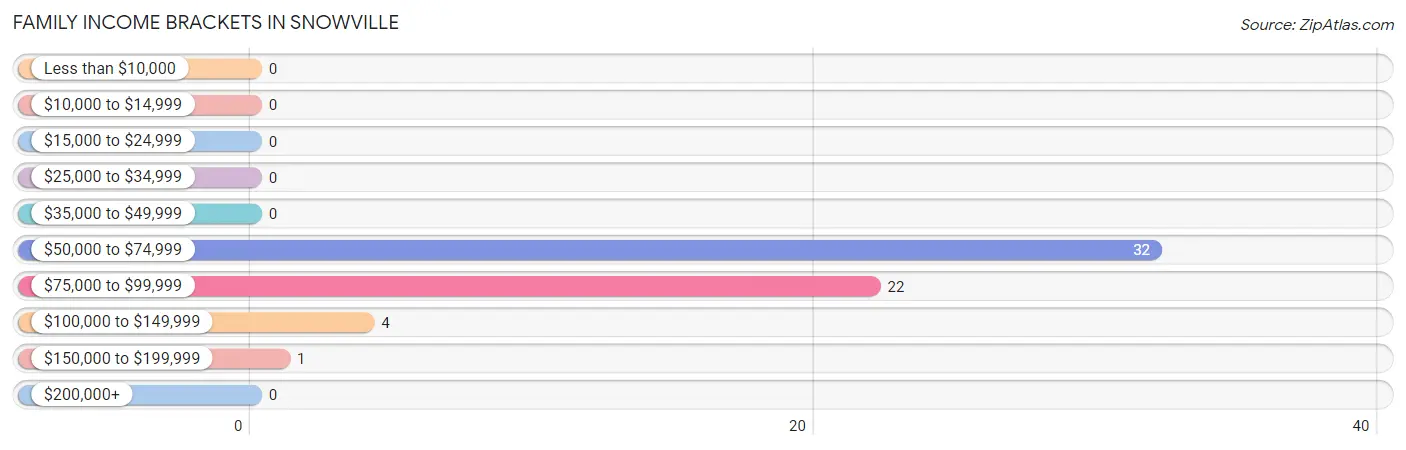
| Income Bracket | # Families | % Families |
| Less than $10,000 | 0 | 0.0% |
| $10,000 to $14,999 | 0 | 0.0% |
| $15,000 to $24,999 | 0 | 0.0% |
| $25,000 to $34,999 | 0 | 0.0% |
| $35,000 to $49,999 | 0 | 0.0% |
| $50,000 to $74,999 | 32 | 54.2% |
| $75,000 to $99,999 | 22 | 37.3% |
| $100,000 to $149,999 | 4 | 6.8% |
| $150,000 to $199,999 | 1 | 1.7% |
| $200,000+ | 0 | 0.0% |
Family Income by Famaliy Size in Snowville
2-person families (30 | 50.8%) account for the highest median family income in Snowville with $64,063 per family, while 2-person families (30 | 50.8%) have the highest median income of $32,032 per family member.
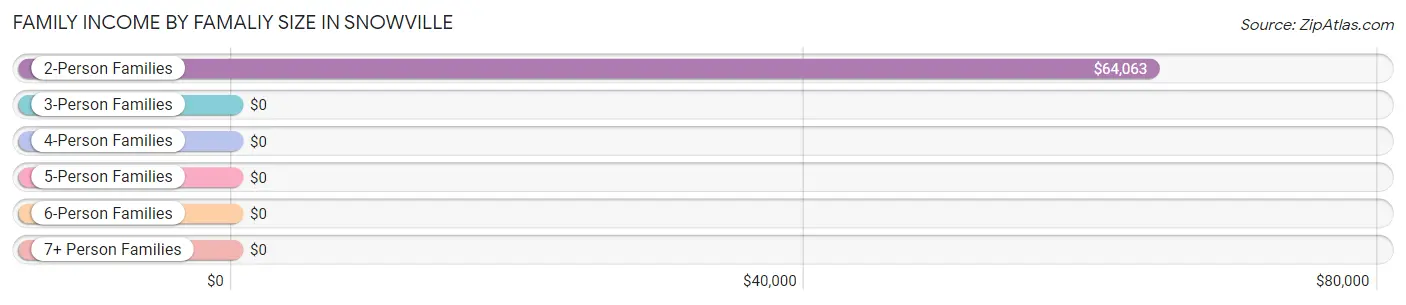
| Income Bracket | # Families | Median Income |
| 2-Person Families | 30 (50.8%) | $64,063 |
| 3-Person Families | 1 (1.7%) | $0 |
| 4-Person Families | 1 (1.7%) | $0 |
| 5-Person Families | 3 (5.1%) | $0 |
| 6-Person Families | 23 (39.0%) | $0 |
| 7+ Person Families | 1 (1.7%) | $0 |
| Total | 59 (100.0%) | $71,250 |
Family Income by Number of Earners in Snowville
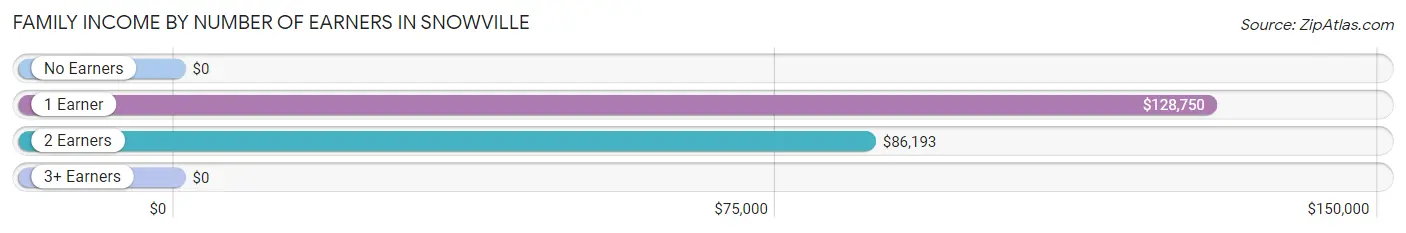
| Number of Earners | # Families | Median Income |
| No Earners | 25 (42.4%) | $0 |
| 1 Earner | 3 (5.1%) | $128,750 |
| 2 Earners | 27 (45.8%) | $86,193 |
| 3+ Earners | 4 (6.8%) | $0 |
| Total | 59 (100.0%) | $71,250 |
Household Income in Snowville
Household Income Brackets in Snowville
With 33 households falling in the category, the $50,000 to $74,999 income range is the most frequent in Snowville, accounting for 50.8% of all households.
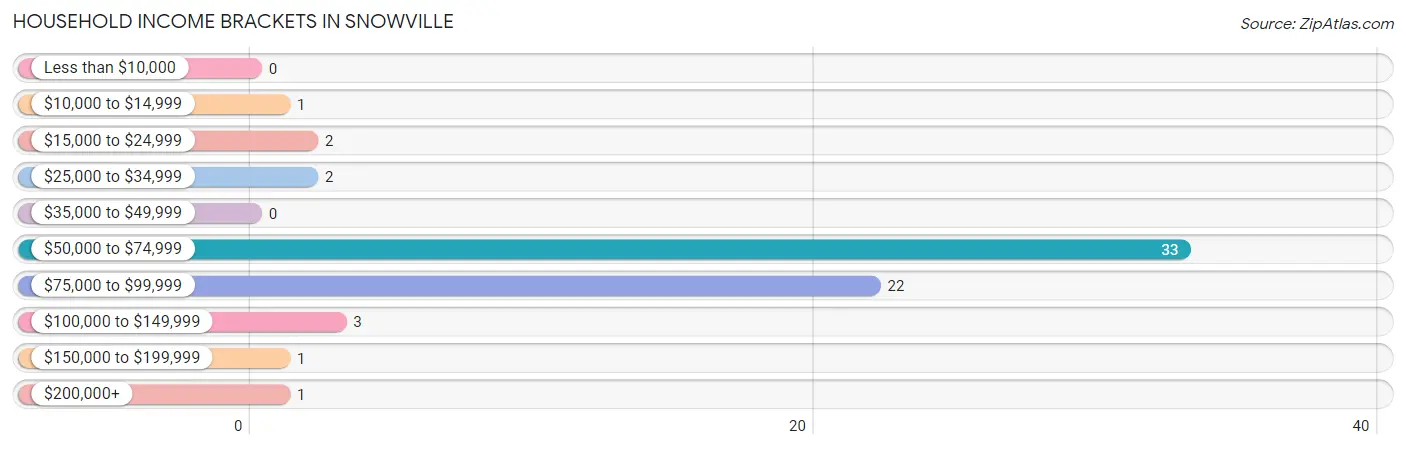
| Income Bracket | # Households | % Households |
| Less than $10,000 | 0 | 0.0% |
| $10,000 to $14,999 | 1 | 1.5% |
| $15,000 to $24,999 | 2 | 3.1% |
| $25,000 to $34,999 | 2 | 3.1% |
| $35,000 to $49,999 | 0 | 0.0% |
| $50,000 to $74,999 | 33 | 50.8% |
| $75,000 to $99,999 | 22 | 33.8% |
| $100,000 to $149,999 | 3 | 4.6% |
| $150,000 to $199,999 | 1 | 1.5% |
| $200,000+ | 1 | 1.5% |
Household Income by Householder Age in Snowville
The median household income in Snowville is $68,750, with the highest median household income of $86,136 found in the 25 to 44 years age bracket for the primary householder. A total of 26 households (40.0%) fall into this category. Meanwhile, the 15 to 24 years age bracket for the primary householder has the lowest median household income of $0, with 1 households (1.5%) in this group.
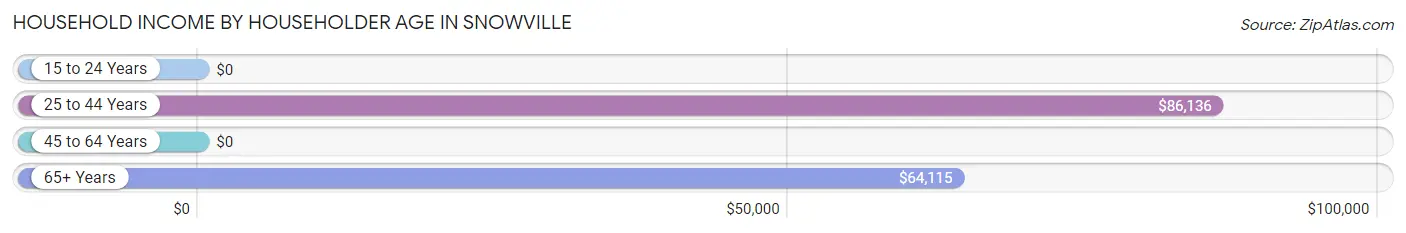
| Income Bracket | # Households | Median Income |
| 15 to 24 Years | 1 (1.5%) | $0 |
| 25 to 44 Years | 26 (40.0%) | $86,136 |
| 45 to 64 Years | 3 (4.6%) | $0 |
| 65+ Years | 35 (53.8%) | $64,115 |
| Total | 65 (100.0%) | $68,750 |
Poverty in Snowville
Income Below Poverty by Sex and Age in Snowville
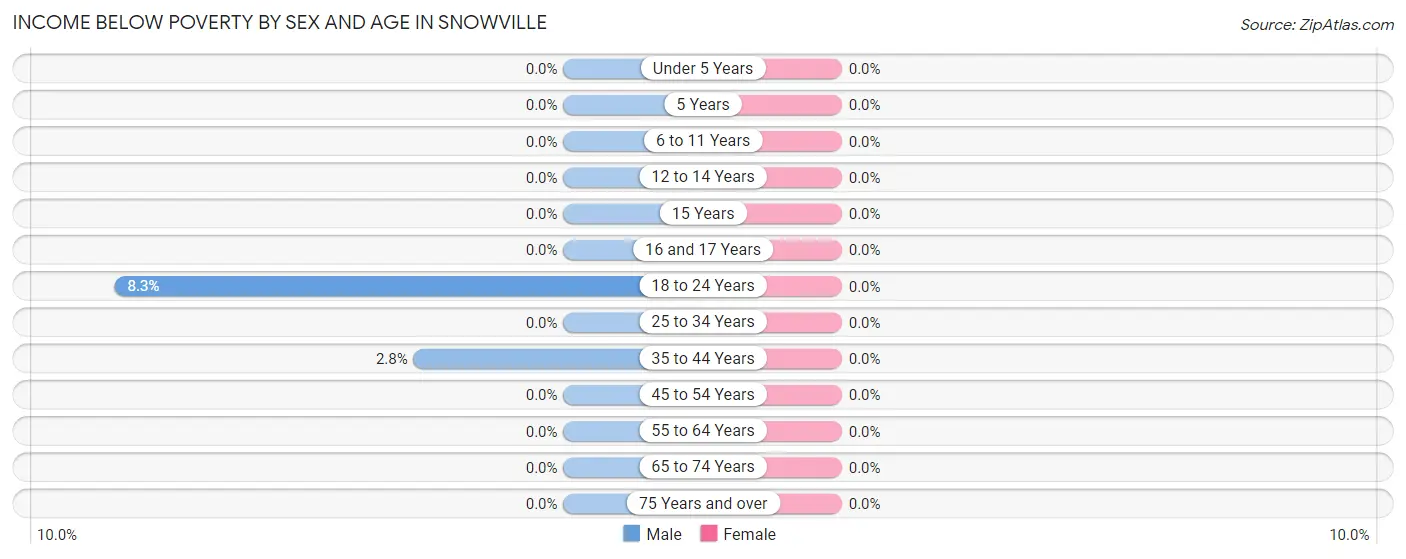
| Age Bracket | Male | Female |
| Under 5 Years | 0 (0.0%) | 0 (0.0%) |
| 5 Years | 0 (0.0%) | 0 (0.0%) |
| 6 to 11 Years | 0 (0.0%) | 0 (0.0%) |
| 12 to 14 Years | 0 (0.0%) | 0 (0.0%) |
| 15 Years | 0 (0.0%) | 0 (0.0%) |
| 16 and 17 Years | 0 (0.0%) | 0 (0.0%) |
| 18 to 24 Years | 2 (8.3%) | 0 (0.0%) |
| 25 to 34 Years | 0 (0.0%) | 0 (0.0%) |
| 35 to 44 Years | 1 (2.8%) | 0 (0.0%) |
| 45 to 54 Years | 0 (0.0%) | 0 (0.0%) |
| 55 to 64 Years | 0 (0.0%) | 0 (0.0%) |
| 65 to 74 Years | 0 (0.0%) | 0 (0.0%) |
| 75 Years and over | 0 (0.0%) | 0 (0.0%) |
| Total | 3 (2.3%) | 0 (0.0%) |
Income Above Poverty by Sex and Age in Snowville
According to the poverty statistics in Snowville, males aged under 5 years and females aged under 5 years are the age groups that are most secure financially, with 100.0% of males and 100.0% of females in these age groups living above the poverty line.
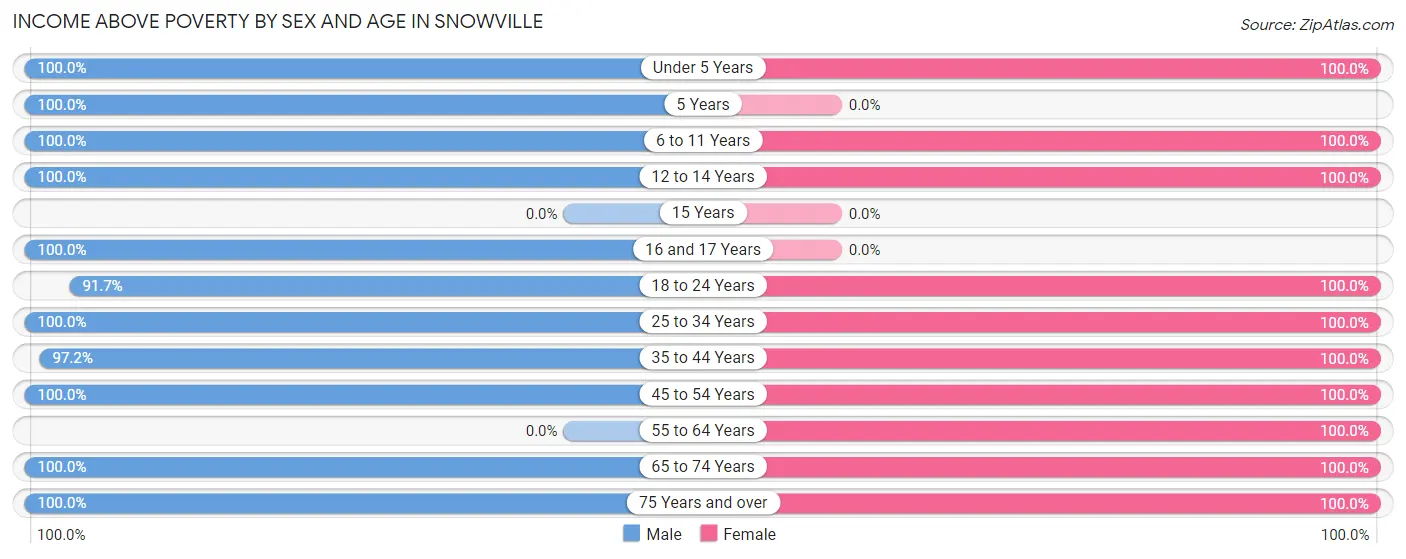
| Age Bracket | Male | Female |
| Under 5 Years | 8 (100.0%) | 1 (100.0%) |
| 5 Years | 2 (100.0%) | 0 (0.0%) |
| 6 to 11 Years | 24 (100.0%) | 31 (100.0%) |
| 12 to 14 Years | 1 (100.0%) | 1 (100.0%) |
| 15 Years | 0 (0.0%) | 0 (0.0%) |
| 16 and 17 Years | 1 (100.0%) | 0 (0.0%) |
| 18 to 24 Years | 22 (91.7%) | 18 (100.0%) |
| 25 to 34 Years | 2 (100.0%) | 5 (100.0%) |
| 35 to 44 Years | 35 (97.2%) | 2 (100.0%) |
| 45 to 54 Years | 1 (100.0%) | 28 (100.0%) |
| 55 to 64 Years | 0 (0.0%) | 6 (100.0%) |
| 65 to 74 Years | 8 (100.0%) | 6 (100.0%) |
| 75 Years and over | 25 (100.0%) | 17 (100.0%) |
| Total | 129 (97.7%) | 115 (100.0%) |
Income Below Poverty Among Married-Couple Families in Snowville
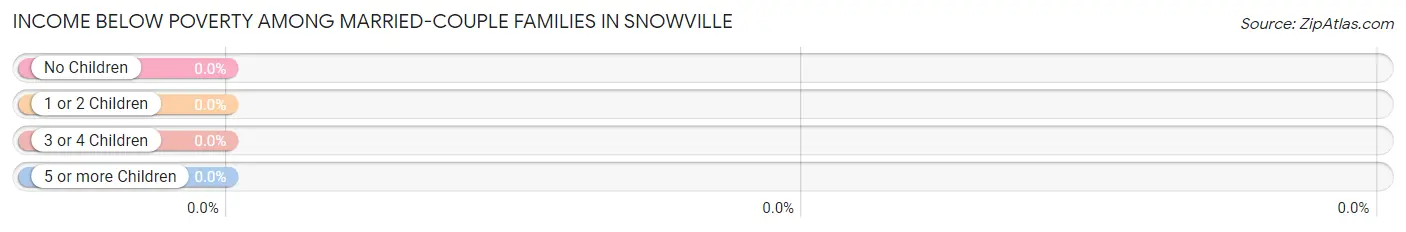
| Children | Above Poverty | Below Poverty |
| No Children | 31 (100.0%) | 0 (0.0%) |
| 1 or 2 Children | 26 (100.0%) | 0 (0.0%) |
| 3 or 4 Children | 1 (100.0%) | 0 (0.0%) |
| 5 or more Children | 0 (0.0%) | 0 (0.0%) |
| Total | 58 (100.0%) | 0 (0.0%) |
Income Below Poverty Among Single-Parent Households in Snowville
| Children | Single Father | Single Mother |
| No Children | 0 (0.0%) | 0 (0.0%) |
| 1 or 2 Children | 0 (0.0%) | 0 (0.0%) |
| 3 or 4 Children | 0 (0.0%) | 0 (0.0%) |
| 5 or more Children | 0 (0.0%) | 0 (0.0%) |
| Total | 0 (0.0%) | 0 (0.0%) |
Income Below Poverty Among Married-Couple vs Single-Parent Households in Snowville
| Children | Married-Couple Families | Single-Parent Households |
| No Children | 0 (0.0%) | 0 (0.0%) |
| 1 or 2 Children | 0 (0.0%) | 0 (0.0%) |
| 3 or 4 Children | 0 (0.0%) | 0 (0.0%) |
| 5 or more Children | 0 (0.0%) | 0 (0.0%) |
| Total | 0 (0.0%) | 0 (0.0%) |
Race in Snowville
The most populous races in Snowville are White / Caucasian (247 | 100.0%), and Hispanic or Latino (6 | 2.4%).
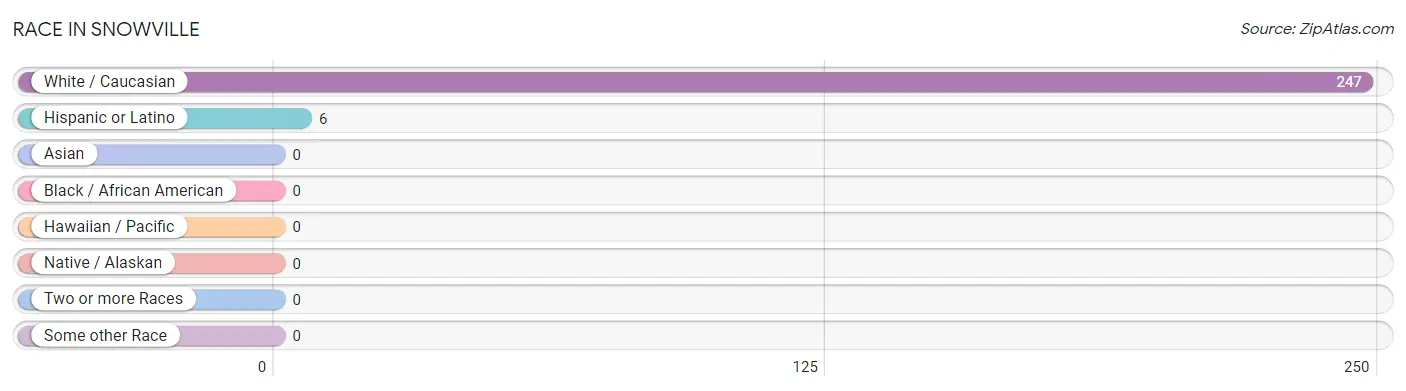
| Race | # Population | % Population |
| Asian | 0 | 0.0% |
| Black / African American | 0 | 0.0% |
| Hawaiian / Pacific | 0 | 0.0% |
| Hispanic or Latino | 6 | 2.4% |
| Native / Alaskan | 0 | 0.0% |
| White / Caucasian | 247 | 100.0% |
| Two or more Races | 0 | 0.0% |
| Some other Race | 0 | 0.0% |
| Total | 247 | 100.0% |
Ancestry in Snowville
The most populous ancestries reported in Snowville are German (157 | 63.6%), English (149 | 60.3%), Irish (27 | 10.9%), Danish (25 | 10.1%), and Scottish (15 | 6.1%), together accounting for 151.0% of all Snowville residents.
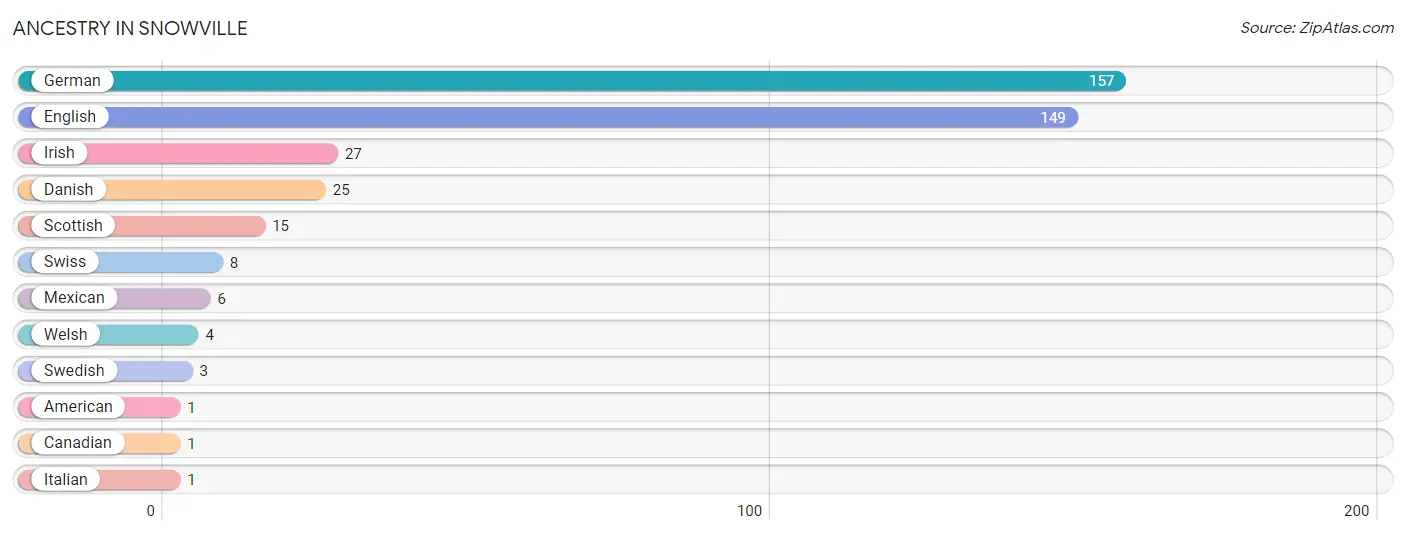
| Ancestry | # Population | % Population |
| American | 1 | 0.4% |
| Canadian | 1 | 0.4% |
| Danish | 25 | 10.1% |
| English | 149 | 60.3% |
| German | 157 | 63.6% |
| Irish | 27 | 10.9% |
| Italian | 1 | 0.4% |
| Mexican | 6 | 2.4% |
| Scottish | 15 | 6.1% |
| Swedish | 3 | 1.2% |
| Swiss | 8 | 3.2% |
| Welsh | 4 | 1.6% | View All 12 Rows |
Immigrants in Snowville
The most numerous immigrant groups reported in Snowville came from , and Canada (2 | 0.8%), together accounting for 0.8% of all Snowville residents.

| Immigration Origin | # Population | % Population |
| Canada | 2 | 0.8% | View All 1 Rows |
Sex and Age in Snowville
Sex and Age in Snowville
The most populous age groups in Snowville are 40 to 44 Years (30 | 22.7%) for men and 10 to 14 Years (31 | 27.0%) for women.
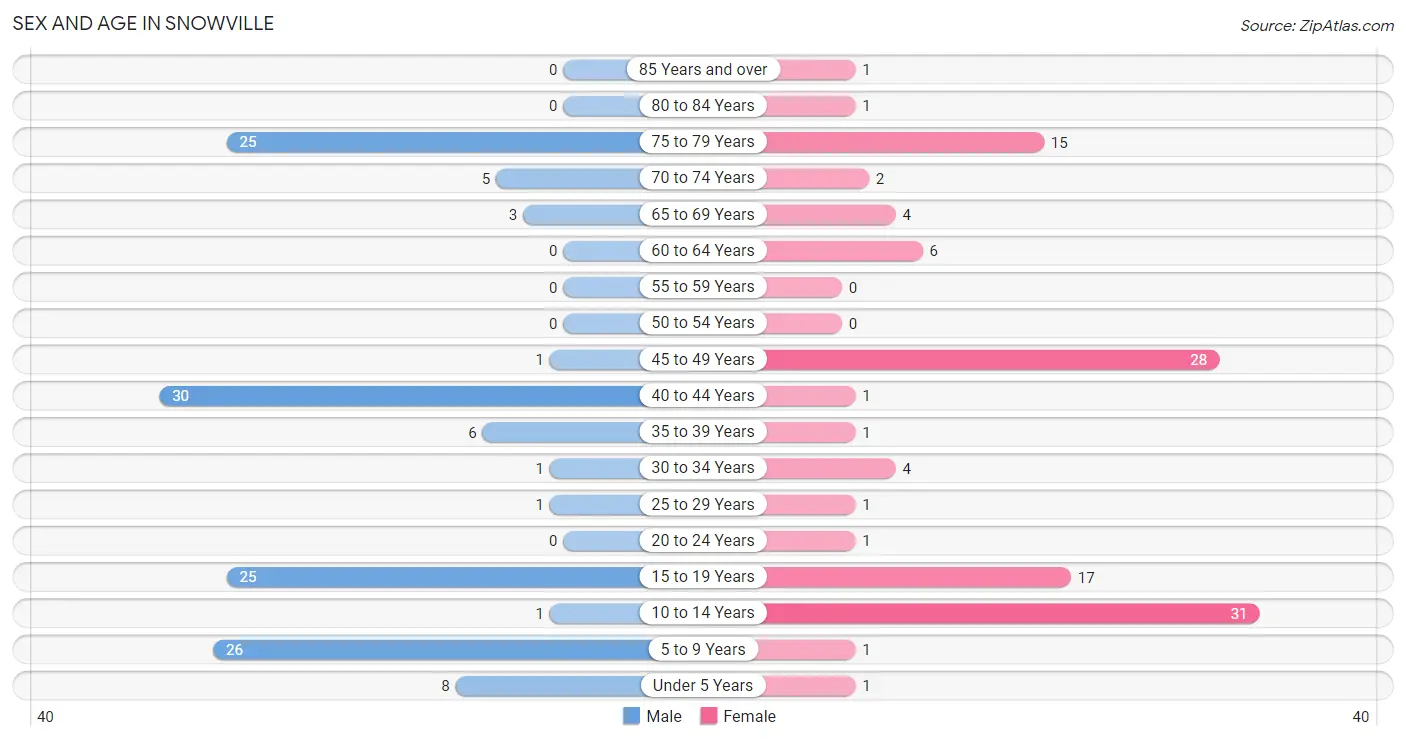
| Age Bracket | Male | Female |
| Under 5 Years | 8 (6.1%) | 1 (0.9%) |
| 5 to 9 Years | 26 (19.7%) | 1 (0.9%) |
| 10 to 14 Years | 1 (0.8%) | 31 (27.0%) |
| 15 to 19 Years | 25 (18.9%) | 17 (14.8%) |
| 20 to 24 Years | 0 (0.0%) | 1 (0.9%) |
| 25 to 29 Years | 1 (0.8%) | 1 (0.9%) |
| 30 to 34 Years | 1 (0.8%) | 4 (3.5%) |
| 35 to 39 Years | 6 (4.5%) | 1 (0.9%) |
| 40 to 44 Years | 30 (22.7%) | 1 (0.9%) |
| 45 to 49 Years | 1 (0.8%) | 28 (24.3%) |
| 50 to 54 Years | 0 (0.0%) | 0 (0.0%) |
| 55 to 59 Years | 0 (0.0%) | 0 (0.0%) |
| 60 to 64 Years | 0 (0.0%) | 6 (5.2%) |
| 65 to 69 Years | 3 (2.3%) | 4 (3.5%) |
| 70 to 74 Years | 5 (3.8%) | 2 (1.7%) |
| 75 to 79 Years | 25 (18.9%) | 15 (13.0%) |
| 80 to 84 Years | 0 (0.0%) | 1 (0.9%) |
| 85 Years and over | 0 (0.0%) | 1 (0.9%) |
| Total | 132 (100.0%) | 115 (100.0%) |
Families and Households in Snowville
Median Family Size in Snowville
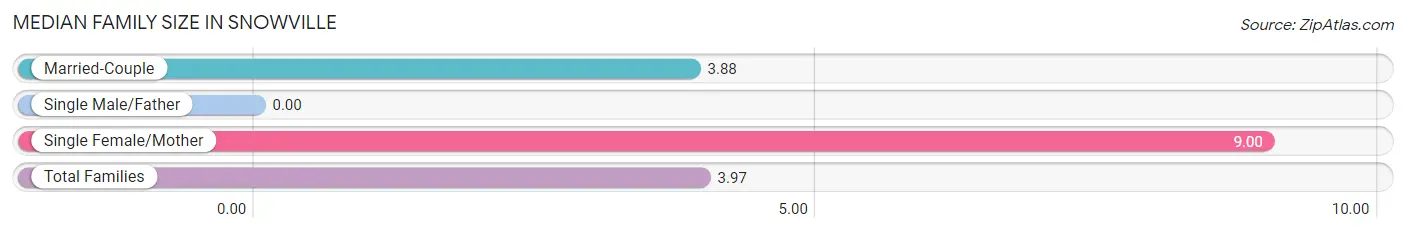
| Family Type | # Families | Family Size |
| Married-Couple | 58 (98.3%) | 3.88 |
| Single Male/Father | 0 (0.0%) | - |
| Single Female/Mother | 1 (1.7%) | 9.00 |
| Total Families | 59 (100.0%) | 3.97 |
Median Household Size in Snowville
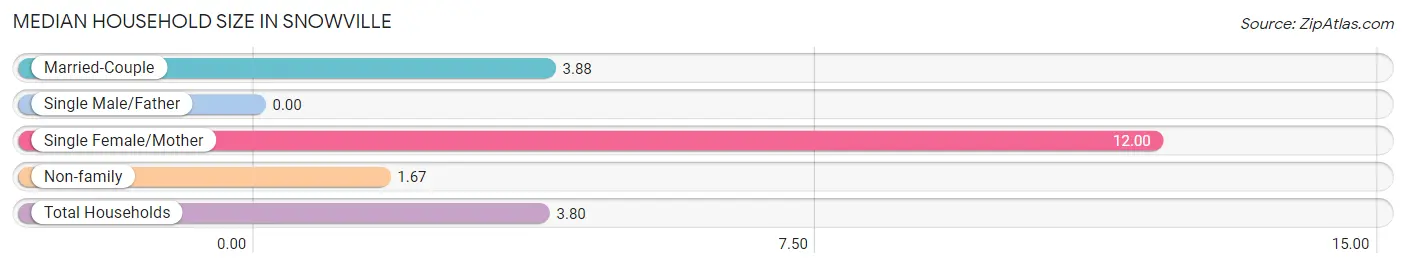
| Household Type | # Households | Household Size |
| Married-Couple | 58 (89.2%) | 3.88 |
| Single Male/Father | 0 (0.0%) | - |
| Single Female/Mother | 1 (1.5%) | 12.00 |
| Non-family | 6 (9.2%) | 1.67 |
| Total Households | 65 (100.0%) | 3.80 |
Household Size by Marriage Status in Snowville
Out of a total of 65 households in Snowville, 59 (90.8%) are family households, while 6 (9.2%) are nonfamily households. The most numerous type of family households are 2-person households, comprising 30, and the most common type of nonfamily households are 1-person households, comprising 5.
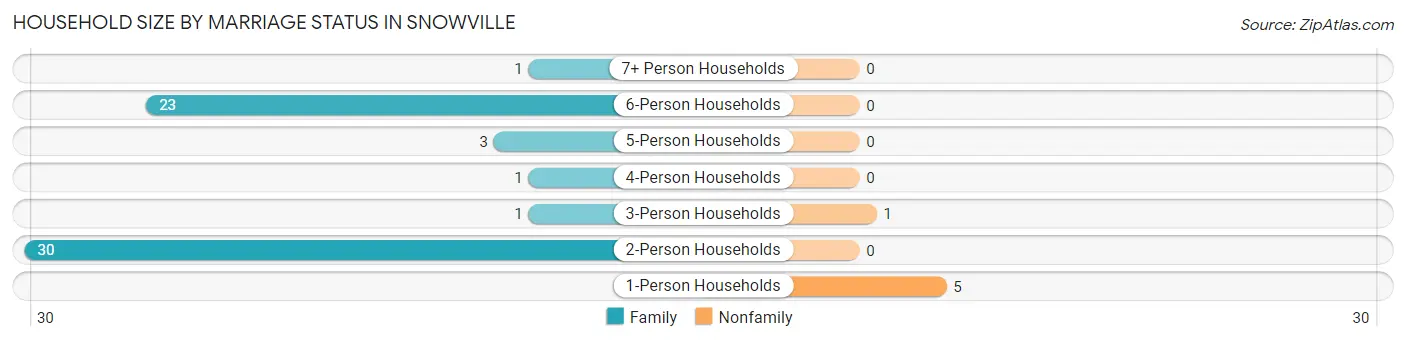
| Household Size | Family Households | Nonfamily Households |
| 1-Person Households | - | 5 (7.7%) |
| 2-Person Households | 30 (46.2%) | 0 (0.0%) |
| 3-Person Households | 1 (1.5%) | 1 (1.5%) |
| 4-Person Households | 1 (1.5%) | 0 (0.0%) |
| 5-Person Households | 3 (4.6%) | 0 (0.0%) |
| 6-Person Households | 23 (35.4%) | 0 (0.0%) |
| 7+ Person Households | 1 (1.5%) | 0 (0.0%) |
| Total | 59 (90.8%) | 6 (9.2%) |
Female Fertility in Snowville
Fertility by Age in Snowville
| Age Bracket | Women with Births | Births / 1,000 Women |
| 15 to 19 years | 0 (0.0%) | 0.0 |
| 20 to 34 years | 0 (0.0%) | 0.0 |
| 35 to 50 years | 0 (0.0%) | 0.0 |
| Total | 0 (0.0%) | 0.0 |
Fertility by Age by Marriage Status in Snowville
| Age Bracket | Married | Unmarried |
| 15 to 19 years | 0 (0.0%) | 0 (0.0%) |
| 20 to 34 years | 0 (0.0%) | 0 (0.0%) |
| 35 to 50 years | 0 (0.0%) | 0 (0.0%) |
| Total | 0 (0.0%) | 0 (0.0%) |
Fertility by Education in Snowville
| Educational Attainment | Women with Births | Births / 1,000 Women |
| Less than High School | 0 (0.0%) | 0.0 |
| High School Diploma | 0 (0.0%) | 0.0 |
| College or Associate's Degree | 0 (0.0%) | 0.0 |
| Bachelor's Degree | 0 (0.0%) | 0.0 |
| Graduate Degree | 0 (0.0%) | 0.0 |
| Total | 0 (0.0%) | 0.0 |
Fertility by Education by Marriage Status in Snowville
| Educational Attainment | Married | Unmarried |
| Less than High School | 0 (0.0%) | 0 (0.0%) |
| High School Diploma | 0 (0.0%) | 0 (0.0%) |
| College or Associate's Degree | 0 (0.0%) | 0 (0.0%) |
| Bachelor's Degree | 0 (0.0%) | 0 (0.0%) |
| Graduate Degree | 0 (0.0%) | 0 (0.0%) |
| Total | 0 (0.0%) | 0 (0.0%) |
Employment Characteristics in Snowville
Employment by Class of Employer in Snowville
Among the 59 employed individuals in Snowville, private company employees (24 | 40.7%), local government employees (23 | 39.0%), and state government employees (6 | 10.2%) make up the most common classes of employment.
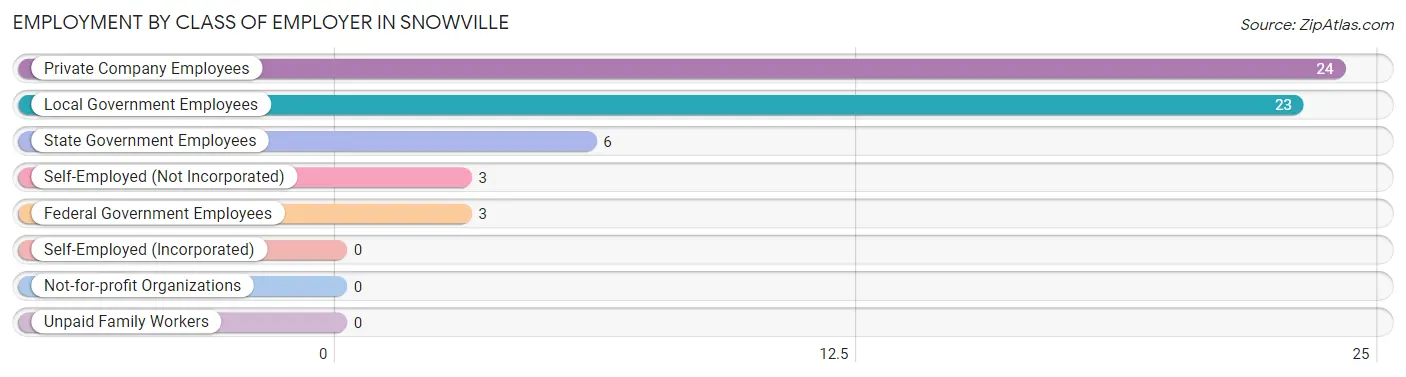
| Employer Class | # Employees | % Employees |
| Private Company Employees | 24 | 40.7% |
| Self-Employed (Incorporated) | 0 | 0.0% |
| Self-Employed (Not Incorporated) | 3 | 5.1% |
| Not-for-profit Organizations | 0 | 0.0% |
| Local Government Employees | 23 | 39.0% |
| State Government Employees | 6 | 10.2% |
| Federal Government Employees | 3 | 5.1% |
| Unpaid Family Workers | 0 | 0.0% |
| Total | 59 | 100.0% |
Employment Status by Age in Snowville
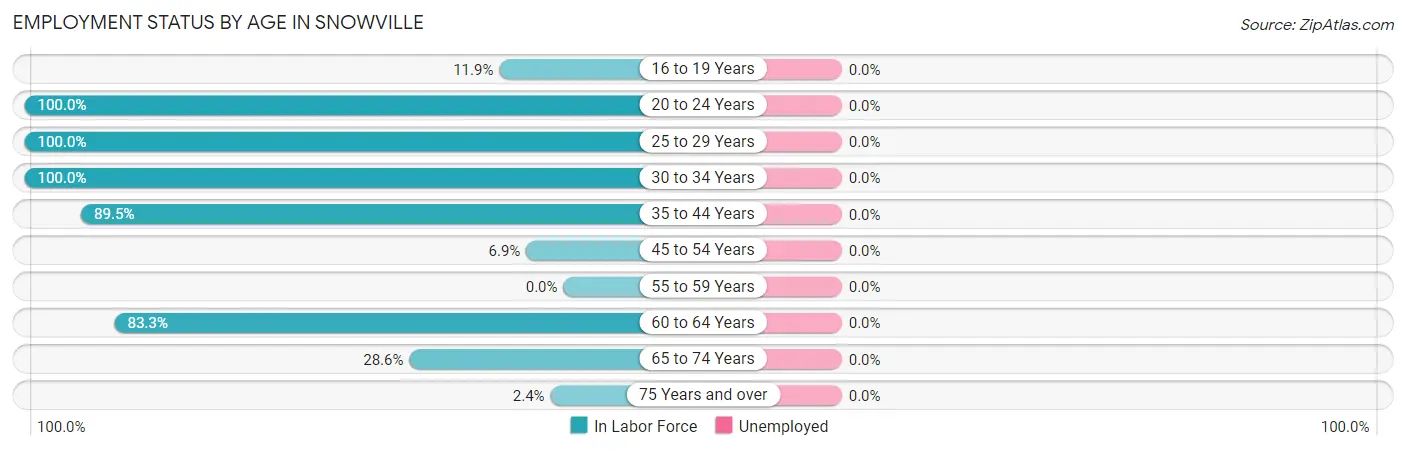
| Age Bracket | In Labor Force | Unemployed |
| 16 to 19 Years | 5 (11.9%) | 0 (0.0%) |
| 20 to 24 Years | 1 (100.0%) | 0 (0.0%) |
| 25 to 29 Years | 2 (100.0%) | 0 (0.0%) |
| 30 to 34 Years | 5 (100.0%) | 0 (0.0%) |
| 35 to 44 Years | 34 (89.5%) | 0 (0.0%) |
| 45 to 54 Years | 2 (6.9%) | 0 (0.0%) |
| 55 to 59 Years | 0 (0.0%) | 0 (0.0%) |
| 60 to 64 Years | 5 (83.3%) | 0 (0.0%) |
| 65 to 74 Years | 4 (28.6%) | 0 (0.0%) |
| 75 Years and over | 1 (2.4%) | 0 (0.0%) |
| Total | 59 (33.0%) | 0 (0.0%) |
Employment Status by Educational Attainment in Snowville
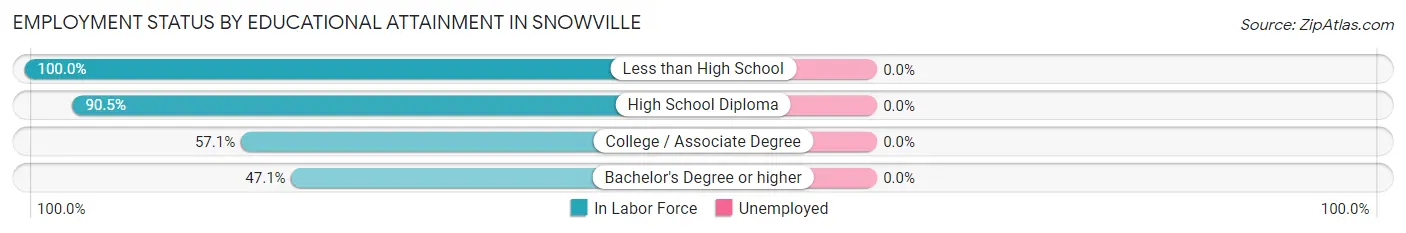
| Educational Attainment | In Labor Force | Unemployed |
| Less than High School | 1 (100.0%) | 0 (0.0%) |
| High School Diploma | 19 (90.5%) | 0 (0.0%) |
| College / Associate Degree | 4 (57.1%) | 0 (0.0%) |
| Bachelor's Degree or higher | 24 (47.1%) | 0 (0.0%) |
| Total | 48 (60.0%) | 0 (0.0%) |
Employment Occupations by Sex in Snowville
Management, Business, Science and Arts Occupations
The most common Management, Business, Science and Arts occupations in Snowville are Community & Social Service (22 | 37.3%), Education Instruction & Library (22 | 37.3%), and Business & Financial (3 | 5.1%).
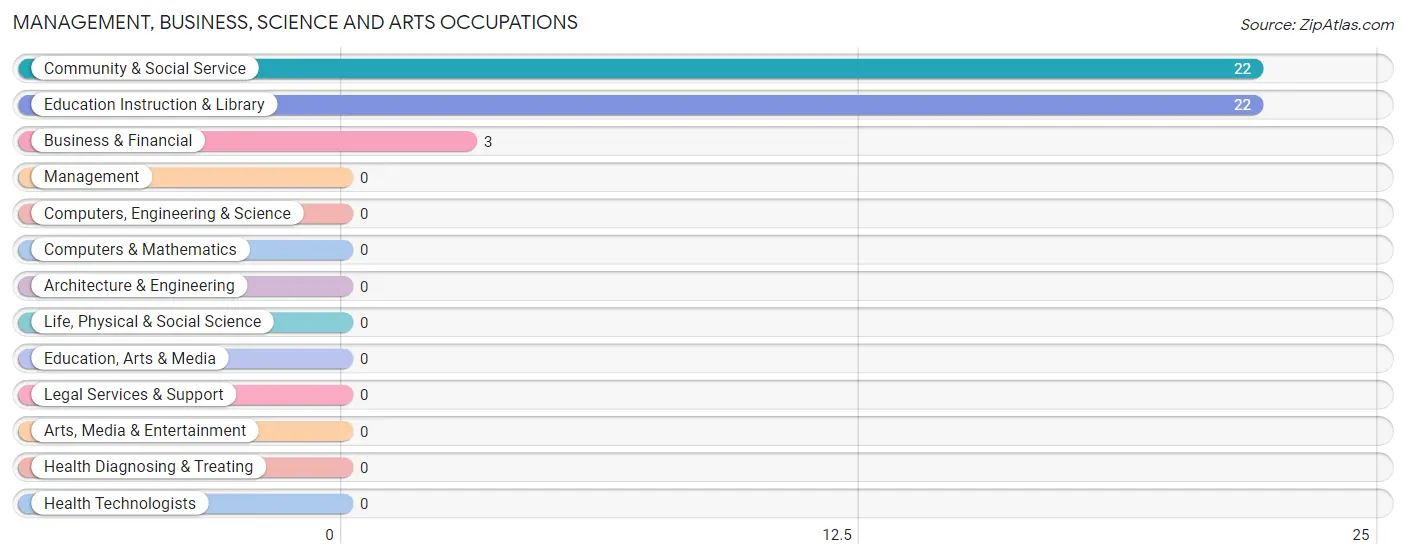
Management, Business, Science and Arts Occupations by Sex
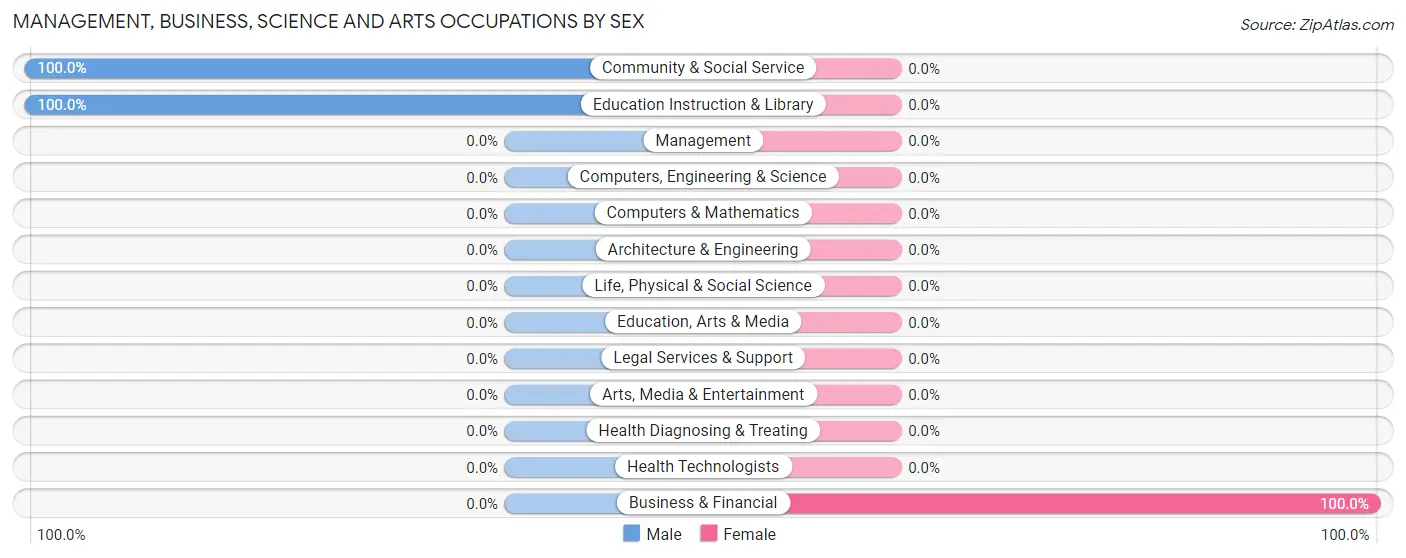
| Occupation | Male | Female |
| Management | 0 (0.0%) | 0 (0.0%) |
| Business & Financial | 0 (0.0%) | 3 (100.0%) |
| Computers, Engineering & Science | 0 (0.0%) | 0 (0.0%) |
| Computers & Mathematics | 0 (0.0%) | 0 (0.0%) |
| Architecture & Engineering | 0 (0.0%) | 0 (0.0%) |
| Life, Physical & Social Science | 0 (0.0%) | 0 (0.0%) |
| Community & Social Service | 22 (100.0%) | 0 (0.0%) |
| Education, Arts & Media | 0 (0.0%) | 0 (0.0%) |
| Legal Services & Support | 0 (0.0%) | 0 (0.0%) |
| Education Instruction & Library | 22 (100.0%) | 0 (0.0%) |
| Arts, Media & Entertainment | 0 (0.0%) | 0 (0.0%) |
| Health Diagnosing & Treating | 0 (0.0%) | 0 (0.0%) |
| Health Technologists | 0 (0.0%) | 0 (0.0%) |
| Total (Category) | 22 (88.0%) | 3 (12.0%) |
| Total (Overall) | 45 (76.3%) | 14 (23.7%) |
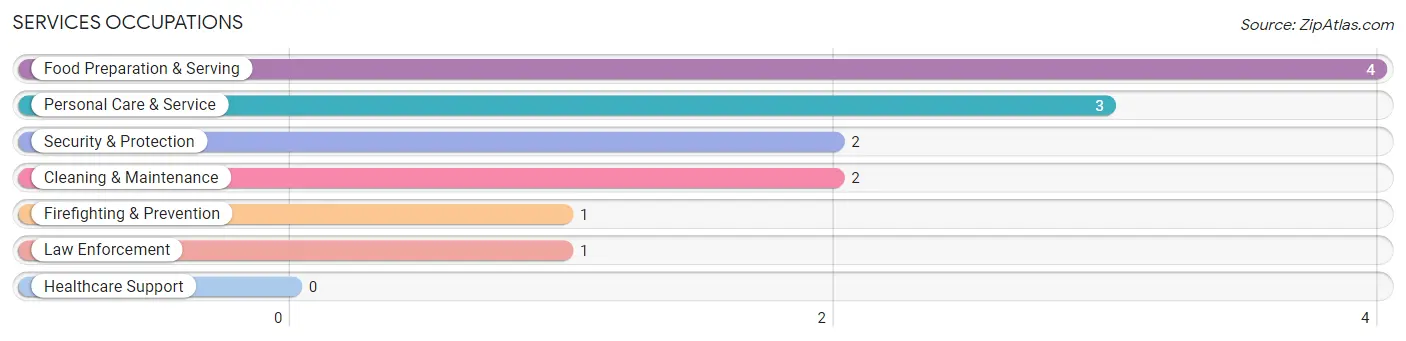
Services Occupations
The most common Services occupations in Snowville are Food Preparation & Serving (4 | 6.8%), Personal Care & Service (3 | 5.1%), Security & Protection (2 | 3.4%), Cleaning & Maintenance (2 | 3.4%), and Firefighting & Prevention (1 | 1.7%).
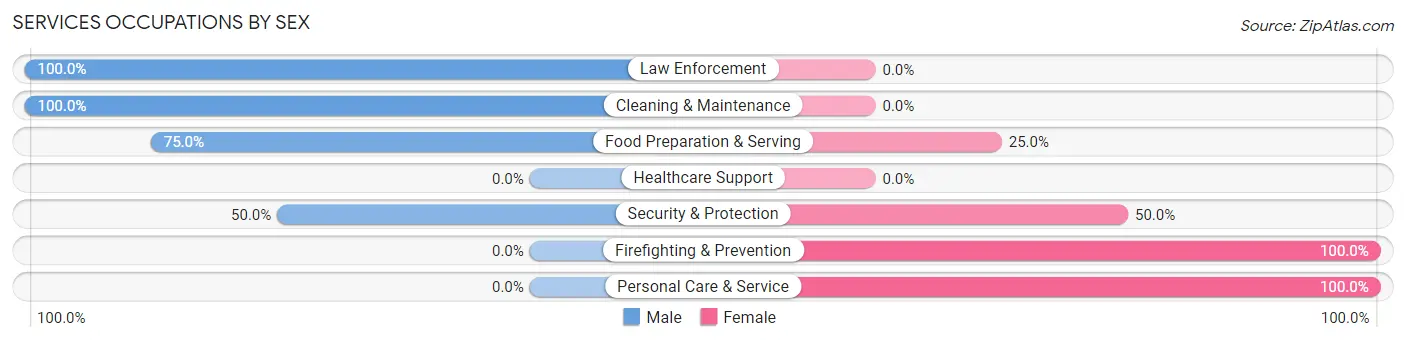
Services Occupations by Sex
Within the Services occupations in Snowville, the most male-oriented occupations are Law Enforcement (100.0%), Cleaning & Maintenance (100.0%), and Food Preparation & Serving (75.0%), while the most female-oriented occupations are Firefighting & Prevention (100.0%), Personal Care & Service (100.0%), and Security & Protection (50.0%).
| Occupation | Male | Female |
| Healthcare Support | 0 (0.0%) | 0 (0.0%) |
| Security & Protection | 1 (50.0%) | 1 (50.0%) |
| Firefighting & Prevention | 0 (0.0%) | 1 (100.0%) |
| Law Enforcement | 1 (100.0%) | 0 (0.0%) |
| Food Preparation & Serving | 3 (75.0%) | 1 (25.0%) |
| Cleaning & Maintenance | 2 (100.0%) | 0 (0.0%) |
| Personal Care & Service | 0 (0.0%) | 3 (100.0%) |
| Total (Category) | 6 (54.5%) | 5 (45.5%) |
| Total (Overall) | 45 (76.3%) | 14 (23.7%) |
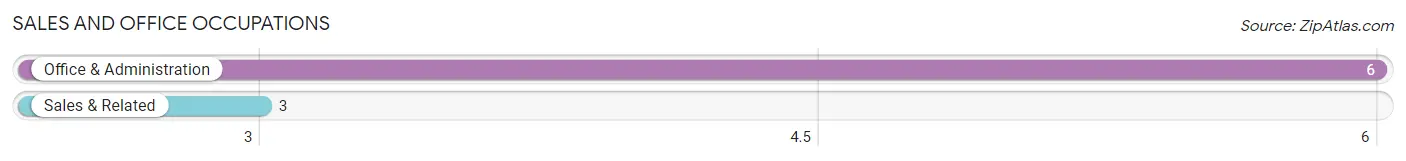
Sales and Office Occupations
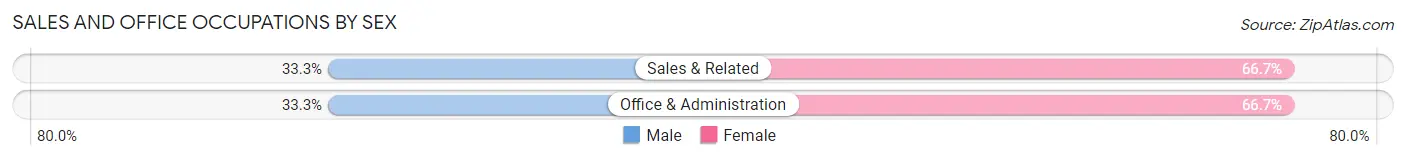
The most common Sales and Office occupations in Snowville are Office & Administration (6 | 10.2%), and Sales & Related (3 | 5.1%).
Sales and Office Occupations by Sex
| Occupation | Male | Female |
| Sales & Related | 1 (33.3%) | 2 (66.7%) |
| Office & Administration | 2 (33.3%) | 4 (66.7%) |
| Total (Category) | 3 (33.3%) | 6 (66.7%) |
| Total (Overall) | 45 (76.3%) | 14 (23.7%) |
Natural Resources, Construction and Maintenance Occupations
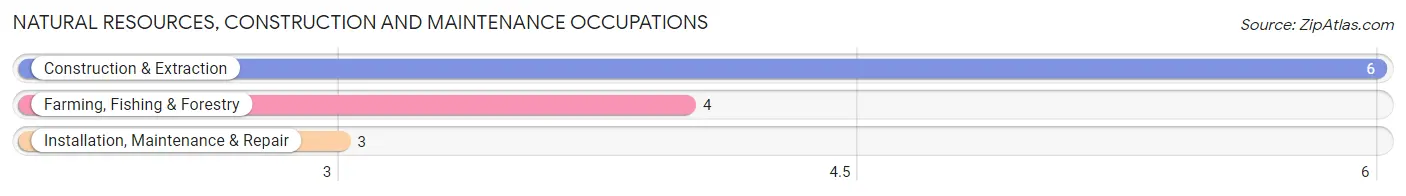
The most common Natural Resources, Construction and Maintenance occupations in Snowville are Construction & Extraction (6 | 10.2%), Farming, Fishing & Forestry (4 | 6.8%), and Installation, Maintenance & Repair (3 | 5.1%).
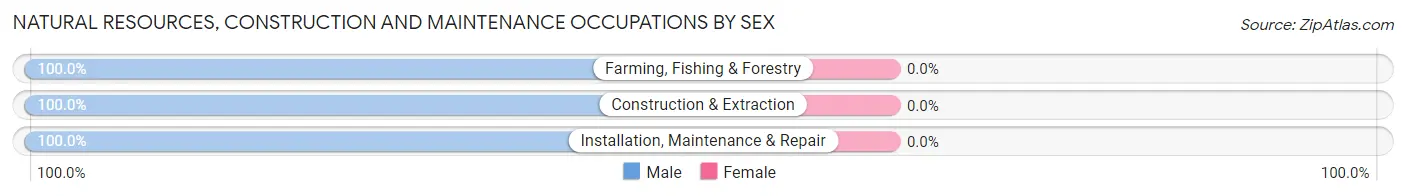
Natural Resources, Construction and Maintenance Occupations by Sex
| Occupation | Male | Female |
| Farming, Fishing & Forestry | 4 (100.0%) | 0 (0.0%) |
| Construction & Extraction | 6 (100.0%) | 0 (0.0%) |
| Installation, Maintenance & Repair | 3 (100.0%) | 0 (0.0%) |
| Total (Category) | 13 (100.0%) | 0 (0.0%) |
| Total (Overall) | 45 (76.3%) | 14 (23.7%) |
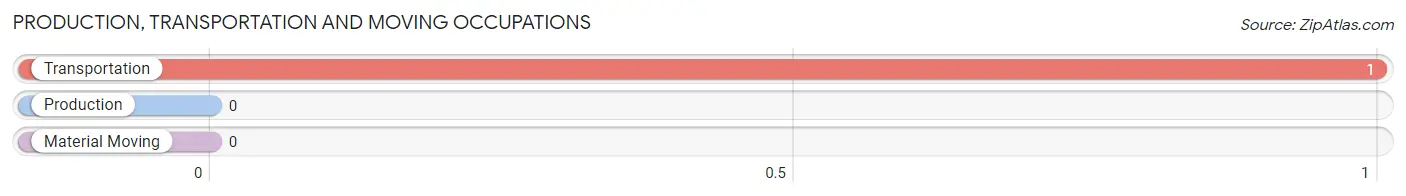
Production, Transportation and Moving Occupations
The most common Production, Transportation and Moving occupations in Snowville are , and Transportation (1 | 1.7%).
Production, Transportation and Moving Occupations by Sex
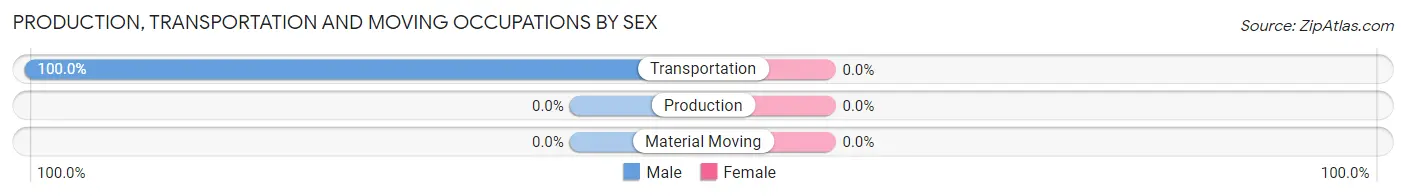
| Occupation | Male | Female |
| Production | 0 (0.0%) | 0 (0.0%) |
| Transportation | 1 (100.0%) | 0 (0.0%) |
| Material Moving | 0 (0.0%) | 0 (0.0%) |
| Total (Category) | 1 (100.0%) | 0 (0.0%) |
| Total (Overall) | 45 (76.3%) | 14 (23.7%) |
Employment Industries by Sex in Snowville
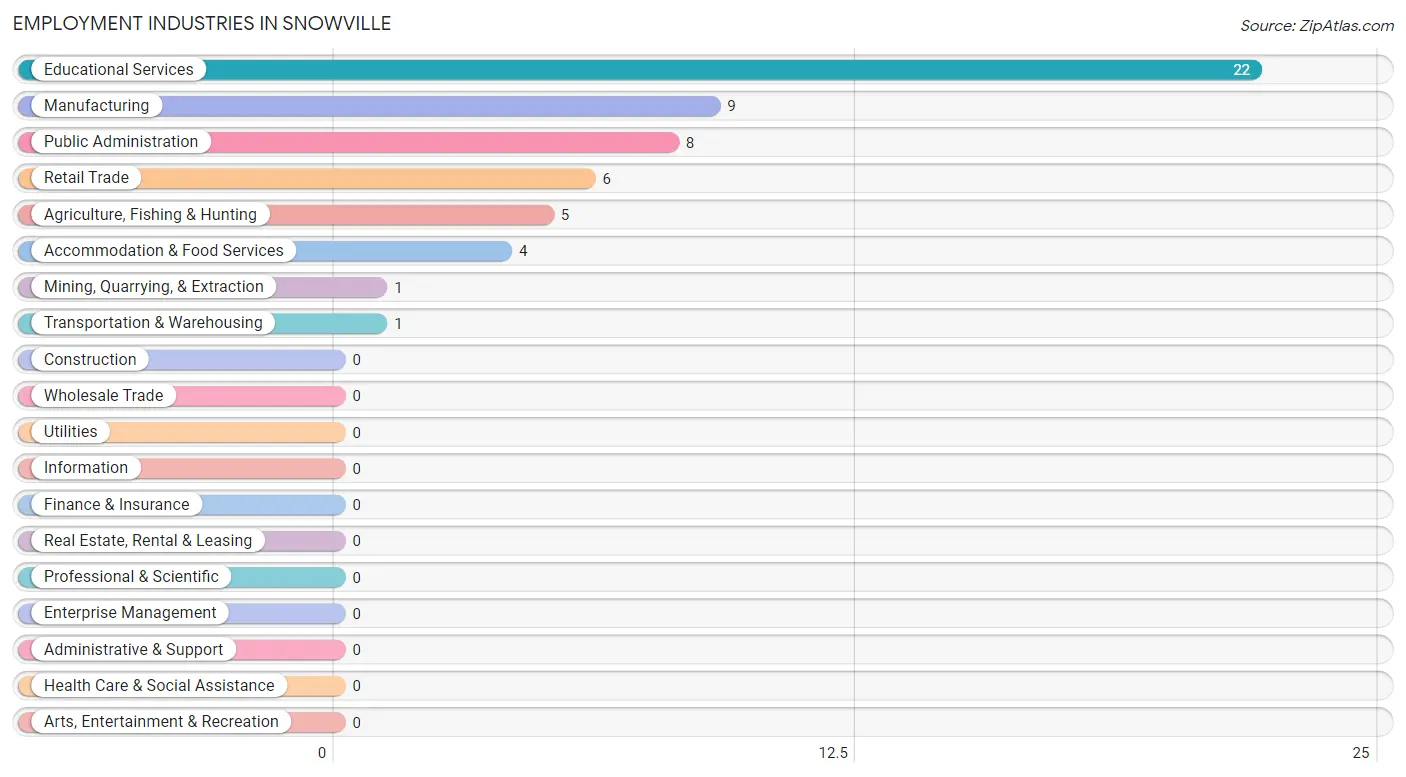
Employment Industries in Snowville
The major employment industries in Snowville include Educational Services (22 | 37.3%), Manufacturing (9 | 15.2%), Public Administration (8 | 13.6%), Retail Trade (6 | 10.2%), and Agriculture, Fishing & Hunting (5 | 8.5%).
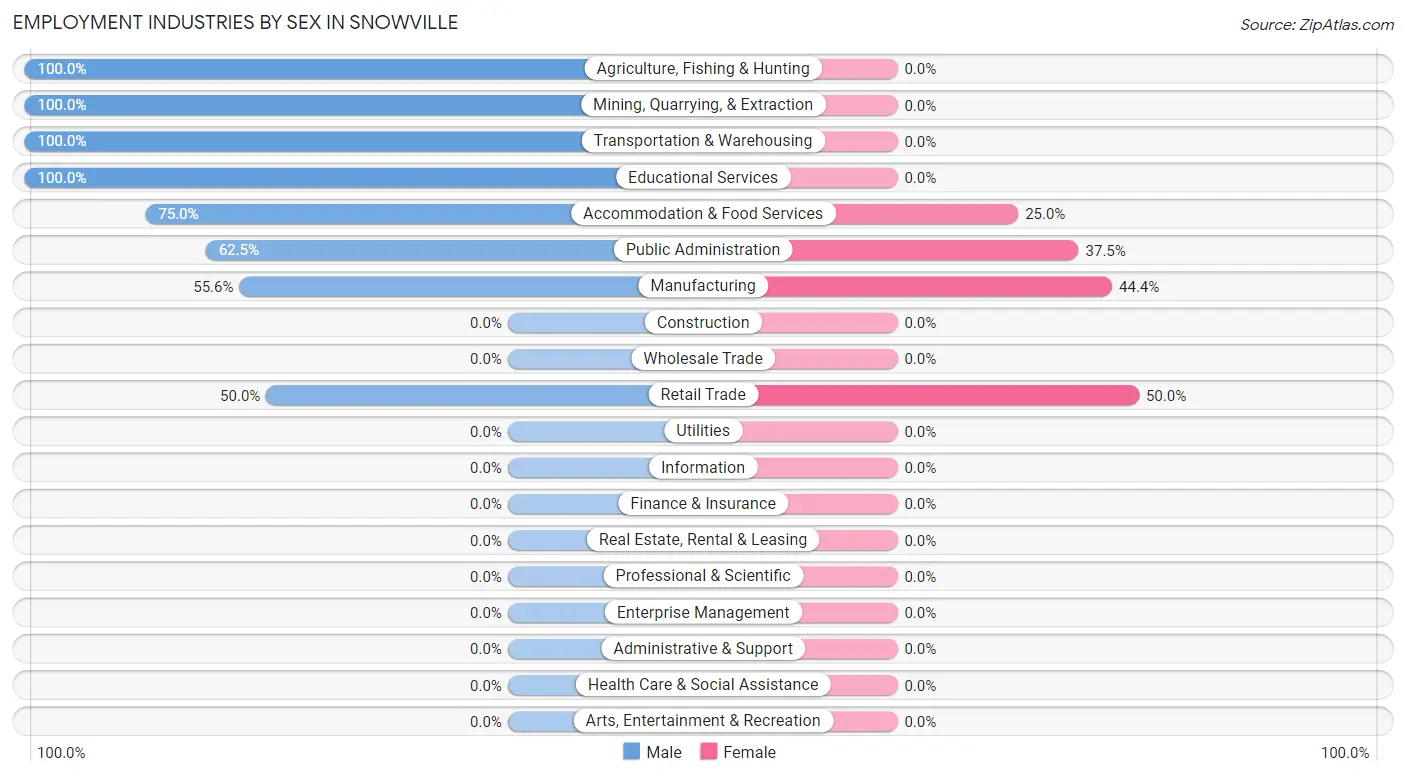
Employment Industries by Sex in Snowville
The Snowville industries that see more men than women are Agriculture, Fishing & Hunting (100.0%), Mining, Quarrying, & Extraction (100.0%), and Transportation & Warehousing (100.0%), whereas the industries that tend to have a higher number of women are Retail Trade (50.0%), Manufacturing (44.4%), and Public Administration (37.5%).
| Industry | Male | Female |
| Agriculture, Fishing & Hunting | 5 (100.0%) | 0 (0.0%) |
| Mining, Quarrying, & Extraction | 1 (100.0%) | 0 (0.0%) |
| Construction | 0 (0.0%) | 0 (0.0%) |
| Manufacturing | 5 (55.6%) | 4 (44.4%) |
| Wholesale Trade | 0 (0.0%) | 0 (0.0%) |
| Retail Trade | 3 (50.0%) | 3 (50.0%) |
| Transportation & Warehousing | 1 (100.0%) | 0 (0.0%) |
| Utilities | 0 (0.0%) | 0 (0.0%) |
| Information | 0 (0.0%) | 0 (0.0%) |
| Finance & Insurance | 0 (0.0%) | 0 (0.0%) |
| Real Estate, Rental & Leasing | 0 (0.0%) | 0 (0.0%) |
| Professional & Scientific | 0 (0.0%) | 0 (0.0%) |
| Enterprise Management | 0 (0.0%) | 0 (0.0%) |
| Administrative & Support | 0 (0.0%) | 0 (0.0%) |
| Educational Services | 22 (100.0%) | 0 (0.0%) |
| Health Care & Social Assistance | 0 (0.0%) | 0 (0.0%) |
| Arts, Entertainment & Recreation | 0 (0.0%) | 0 (0.0%) |
| Accommodation & Food Services | 3 (75.0%) | 1 (25.0%) |
| Public Administration | 5 (62.5%) | 3 (37.5%) |
| Total | 45 (76.3%) | 14 (23.7%) |
Education in Snowville
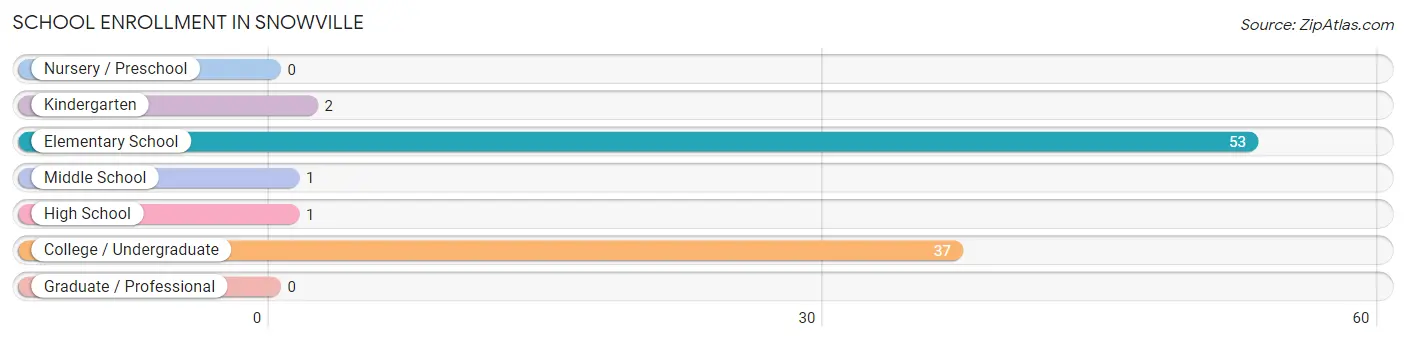
School Enrollment in Snowville
The most common levels of schooling among the 94 students in Snowville are elementary school (53 | 56.4%), college / undergraduate (37 | 39.4%), and kindergarten (2 | 2.1%).
| School Level | # Students | % Students |
| Nursery / Preschool | 0 | 0.0% |
| Kindergarten | 2 | 2.1% |
| Elementary School | 53 | 56.4% |
| Middle School | 1 | 1.1% |
| High School | 1 | 1.1% |
| College / Undergraduate | 37 | 39.4% |
| Graduate / Professional | 0 | 0.0% |
| Total | 94 | 100.0% |
School Enrollment by Age by Funding Source in Snowville
Out of a total of 94 students who are enrolled in schools in Snowville, 1 (1.1%) attend a private institution, while the remaining 93 (98.9%) are enrolled in public schools. The age group of 20 to 24 year olds has the highest likelihood of being enrolled in private schools, with 1 (100.0% in the age bracket) enrolled. Conversely, the age group of 5 to 9 year old has the lowest likelihood of being enrolled in a private school, with 25 (100.0% in the age bracket) attending a public institution.
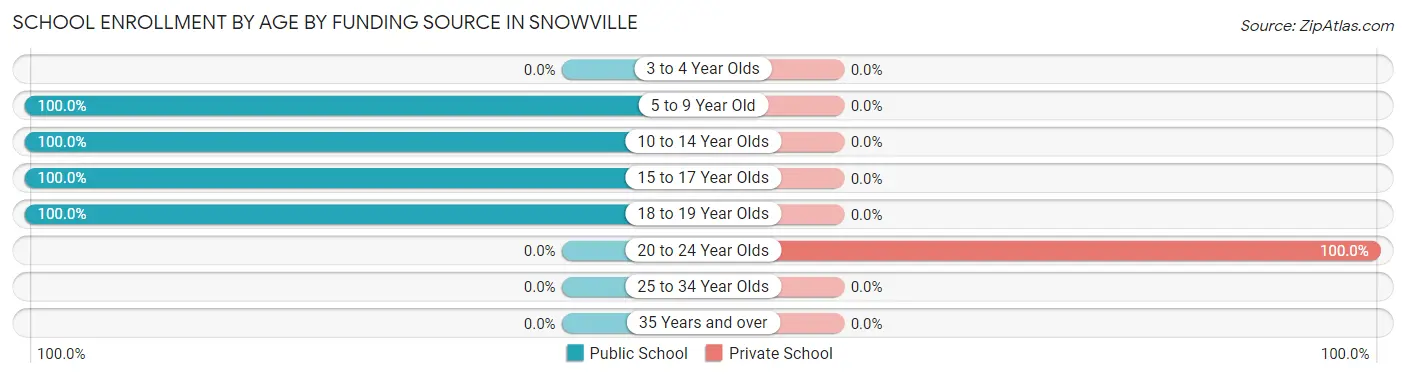
| Age Bracket | Public School | Private School |
| 3 to 4 Year Olds | 0 (0.0%) | 0 (0.0%) |
| 5 to 9 Year Old | 25 (100.0%) | 0 (0.0%) |
| 10 to 14 Year Olds | 31 (100.0%) | 0 (0.0%) |
| 15 to 17 Year Olds | 1 (100.0%) | 0 (0.0%) |
| 18 to 19 Year Olds | 36 (100.0%) | 0 (0.0%) |
| 20 to 24 Year Olds | 0 (0.0%) | 1 (100.0%) |
| 25 to 34 Year Olds | 0 (0.0%) | 0 (0.0%) |
| 35 Years and over | 0 (0.0%) | 0 (0.0%) |
| Total | 93 (98.9%) | 1 (1.1%) |
Educational Attainment by Field of Study in Snowville
Arts & humanities (28 | 36.4%), engineering (24 | 31.2%), education (23 | 29.9%), business (1 | 1.3%), and literature & languages (1 | 1.3%) are the most common fields of study among 77 individuals in Snowville who have obtained a bachelor's degree or higher.
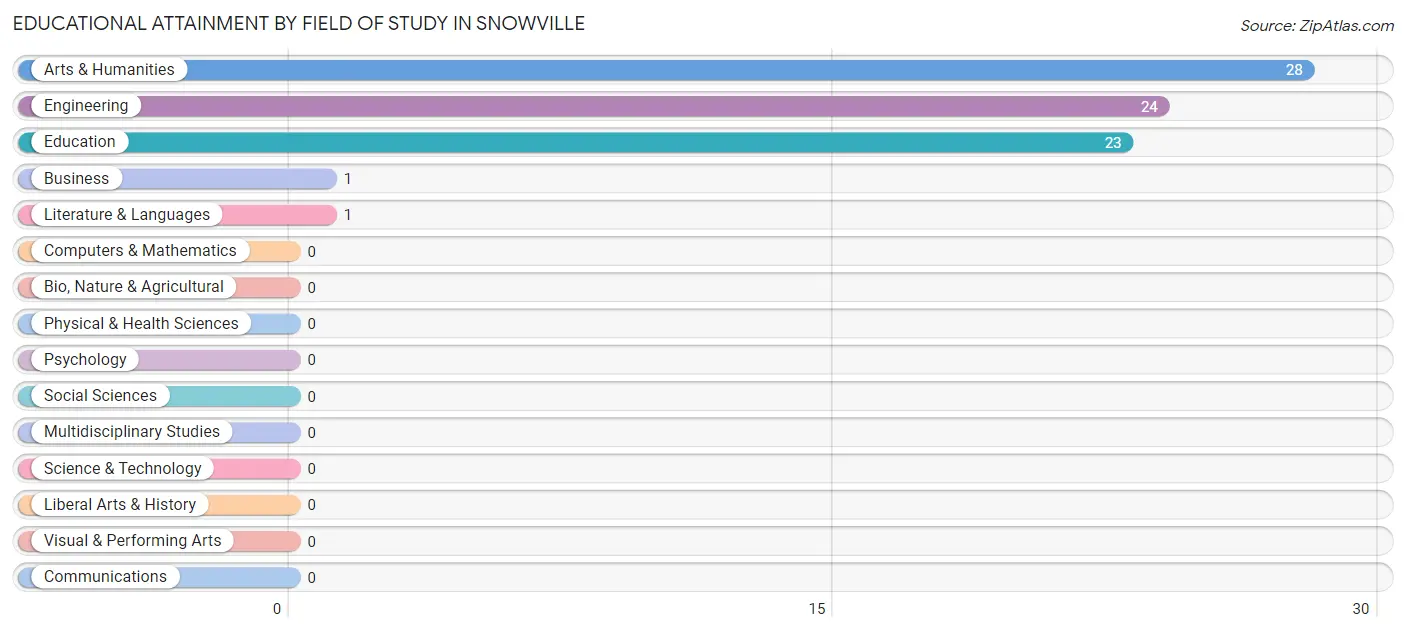
| Field of Study | # Graduates | % Graduates |
| Computers & Mathematics | 0 | 0.0% |
| Bio, Nature & Agricultural | 0 | 0.0% |
| Physical & Health Sciences | 0 | 0.0% |
| Psychology | 0 | 0.0% |
| Social Sciences | 0 | 0.0% |
| Engineering | 24 | 31.2% |
| Multidisciplinary Studies | 0 | 0.0% |
| Science & Technology | 0 | 0.0% |
| Business | 1 | 1.3% |
| Education | 23 | 29.9% |
| Literature & Languages | 1 | 1.3% |
| Liberal Arts & History | 0 | 0.0% |
| Visual & Performing Arts | 0 | 0.0% |
| Communications | 0 | 0.0% |
| Arts & Humanities | 28 | 36.4% |
| Total | 77 | 100.0% |
Transportation & Commute in Snowville
Vehicle Availability by Sex in Snowville
The most prevalent vehicle ownership categories in Snowville are males with 4 vehicles (30, accounting for 66.7%) and females with 4 vehicles (0, making up 214.3%).

| Vehicles Available | Male | Female |
| No Vehicle | 0 (0.0%) | 0 (0.0%) |
| 1 Vehicle | 0 (0.0%) | 0 (0.0%) |
| 2 Vehicles | 5 (11.1%) | 4 (28.6%) |
| 3 Vehicles | 2 (4.4%) | 2 (14.3%) |
| 4 Vehicles | 30 (66.7%) | 0 (0.0%) |
| 5 or more Vehicles | 8 (17.8%) | 8 (57.1%) |
| Total | 45 (100.0%) | 14 (100.0%) |
Commute Time in Snowville
The most frequently occuring commute durations in Snowville are 40 to 44 minutes (23 commuters, 39.0%), 60 to 89 minutes (8 commuters, 13.6%), and 5 to 9 minutes (6 commuters, 10.2%).
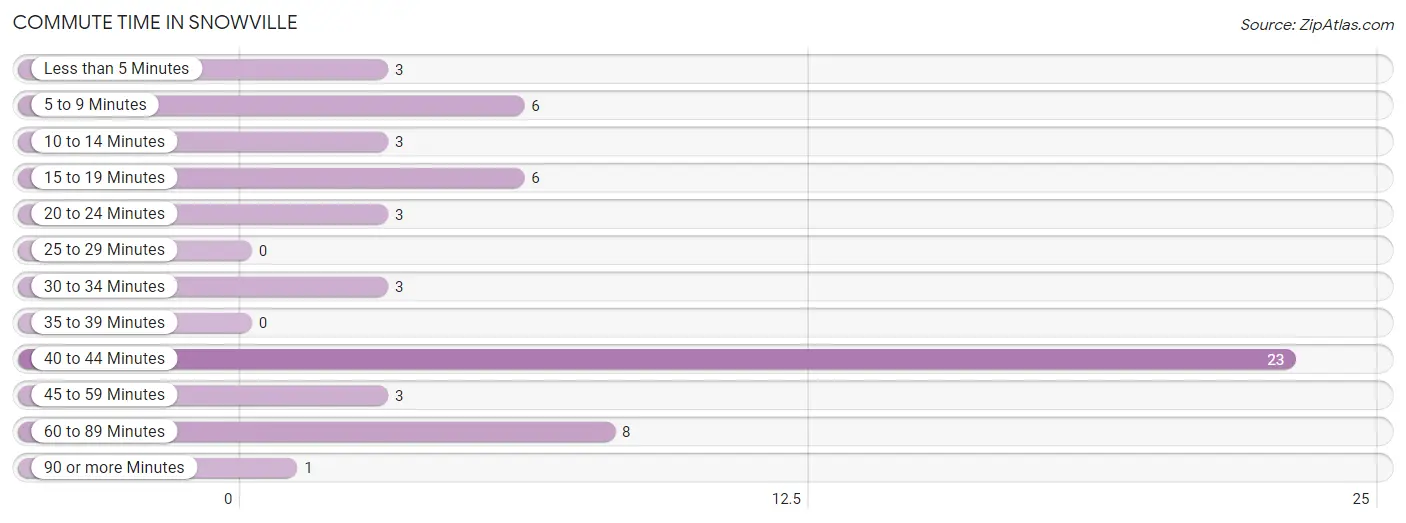
| Commute Time | # Commuters | % Commuters |
| Less than 5 Minutes | 3 | 5.1% |
| 5 to 9 Minutes | 6 | 10.2% |
| 10 to 14 Minutes | 3 | 5.1% |
| 15 to 19 Minutes | 6 | 10.2% |
| 20 to 24 Minutes | 3 | 5.1% |
| 25 to 29 Minutes | 0 | 0.0% |
| 30 to 34 Minutes | 3 | 5.1% |
| 35 to 39 Minutes | 0 | 0.0% |
| 40 to 44 Minutes | 23 | 39.0% |
| 45 to 59 Minutes | 3 | 5.1% |
| 60 to 89 Minutes | 8 | 13.6% |
| 90 or more Minutes | 1 | 1.7% |
Commute Time by Sex in Snowville
The most common commute times in Snowville are 40 to 44 minutes (22 commuters, 48.9%) for males and less than 5 minutes (3 commuters, 21.4%) for females.
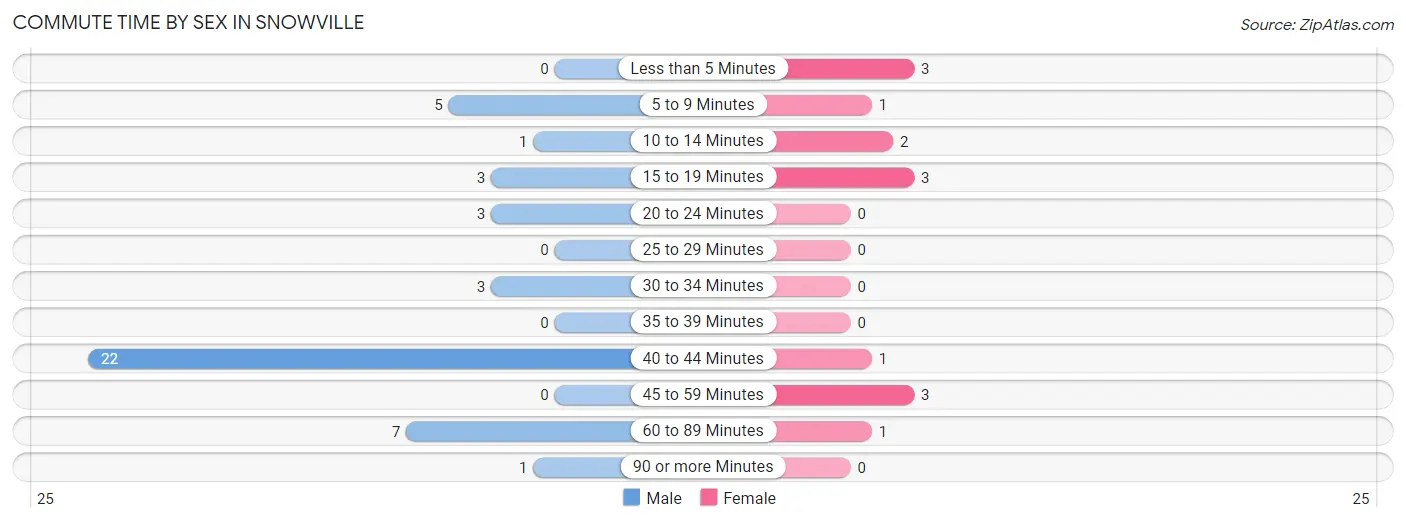
| Commute Time | Male | Female |
| Less than 5 Minutes | 0 (0.0%) | 3 (21.4%) |
| 5 to 9 Minutes | 5 (11.1%) | 1 (7.1%) |
| 10 to 14 Minutes | 1 (2.2%) | 2 (14.3%) |
| 15 to 19 Minutes | 3 (6.7%) | 3 (21.4%) |
| 20 to 24 Minutes | 3 (6.7%) | 0 (0.0%) |
| 25 to 29 Minutes | 0 (0.0%) | 0 (0.0%) |
| 30 to 34 Minutes | 3 (6.7%) | 0 (0.0%) |
| 35 to 39 Minutes | 0 (0.0%) | 0 (0.0%) |
| 40 to 44 Minutes | 22 (48.9%) | 1 (7.1%) |
| 45 to 59 Minutes | 0 (0.0%) | 3 (21.4%) |
| 60 to 89 Minutes | 7 (15.6%) | 1 (7.1%) |
| 90 or more Minutes | 1 (2.2%) | 0 (0.0%) |
Time of Departure to Work by Sex in Snowville
The most frequent times of departure to work in Snowville are 6:30 AM to 6:59 AM (22, 48.9%) for males and 8:00 AM to 8:29 AM (4, 28.6%) for females.
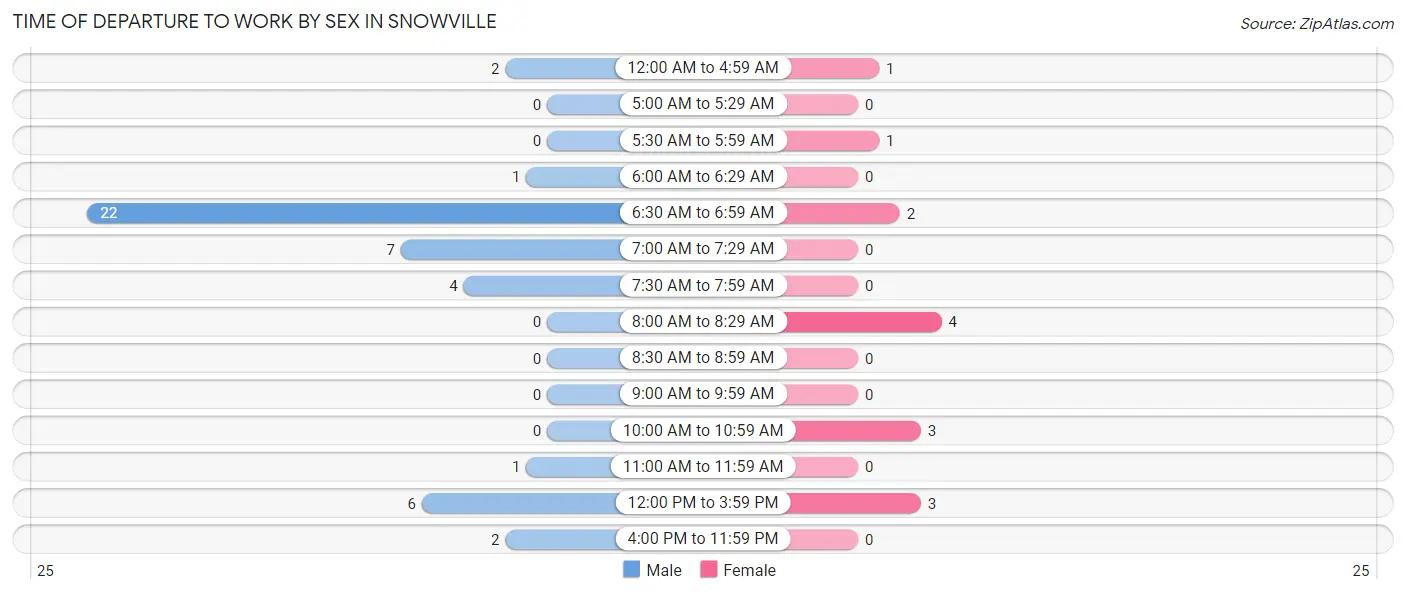
| Time of Departure | Male | Female |
| 12:00 AM to 4:59 AM | 2 (4.4%) | 1 (7.1%) |
| 5:00 AM to 5:29 AM | 0 (0.0%) | 0 (0.0%) |
| 5:30 AM to 5:59 AM | 0 (0.0%) | 1 (7.1%) |
| 6:00 AM to 6:29 AM | 1 (2.2%) | 0 (0.0%) |
| 6:30 AM to 6:59 AM | 22 (48.9%) | 2 (14.3%) |
| 7:00 AM to 7:29 AM | 7 (15.6%) | 0 (0.0%) |
| 7:30 AM to 7:59 AM | 4 (8.9%) | 0 (0.0%) |
| 8:00 AM to 8:29 AM | 0 (0.0%) | 4 (28.6%) |
| 8:30 AM to 8:59 AM | 0 (0.0%) | 0 (0.0%) |
| 9:00 AM to 9:59 AM | 0 (0.0%) | 0 (0.0%) |
| 10:00 AM to 10:59 AM | 0 (0.0%) | 3 (21.4%) |
| 11:00 AM to 11:59 AM | 1 (2.2%) | 0 (0.0%) |
| 12:00 PM to 3:59 PM | 6 (13.3%) | 3 (21.4%) |
| 4:00 PM to 11:59 PM | 2 (4.4%) | 0 (0.0%) |
| Total | 45 (100.0%) | 14 (100.0%) |
Housing Occupancy in Snowville
Occupancy by Ownership in Snowville
Of the total 65 dwellings in Snowville, owner-occupied units account for 62 (95.4%), while renter-occupied units make up 3 (4.6%).
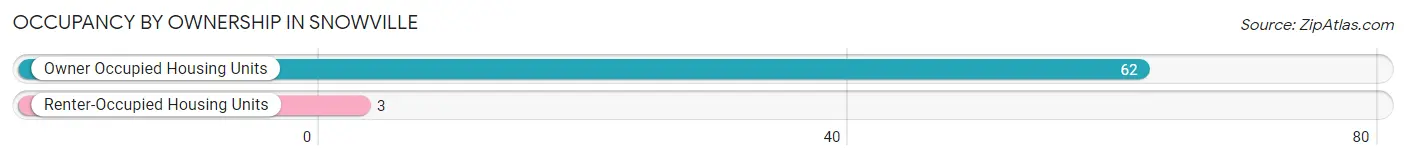
| Occupancy | # Housing Units | % Housing Units |
| Owner Occupied Housing Units | 62 | 95.4% |
| Renter-Occupied Housing Units | 3 | 4.6% |
| Total Occupied Housing Units | 65 | 100.0% |
Occupancy by Household Size in Snowville
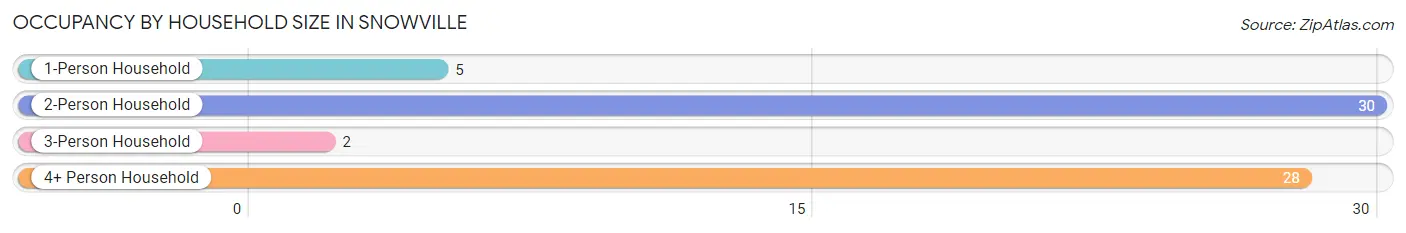
| Household Size | # Housing Units | % Housing Units |
| 1-Person Household | 5 | 7.7% |
| 2-Person Household | 30 | 46.2% |
| 3-Person Household | 2 | 3.1% |
| 4+ Person Household | 28 | 43.1% |
| Total Housing Units | 65 | 100.0% |
Occupancy by Ownership by Household Size in Snowville
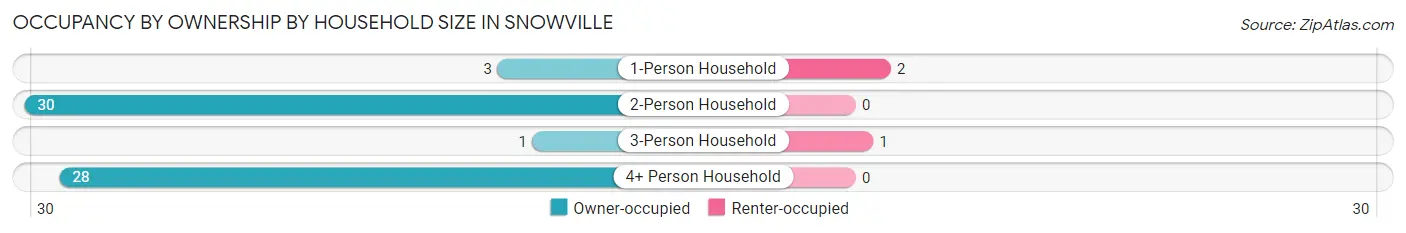
| Household Size | Owner-occupied | Renter-occupied |
| 1-Person Household | 3 (60.0%) | 2 (40.0%) |
| 2-Person Household | 30 (100.0%) | 0 (0.0%) |
| 3-Person Household | 1 (50.0%) | 1 (50.0%) |
| 4+ Person Household | 28 (100.0%) | 0 (0.0%) |
| Total Housing Units | 62 (95.4%) | 3 (4.6%) |
Occupancy by Educational Attainment in Snowville
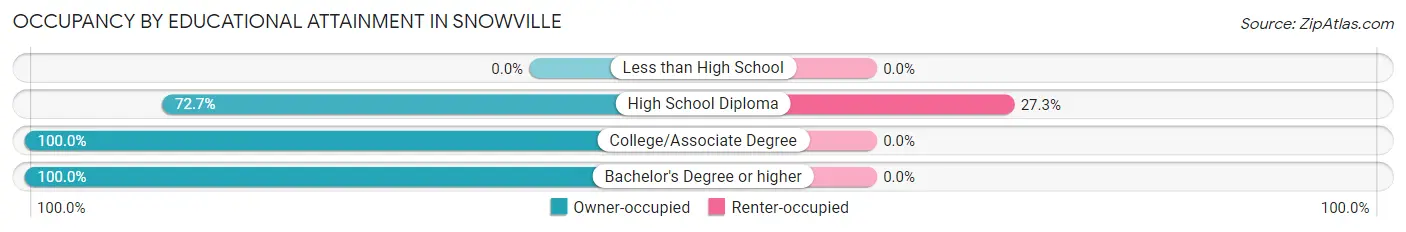
| Household Size | Owner-occupied | Renter-occupied |
| Less than High School | 0 (0.0%) | 0 (0.0%) |
| High School Diploma | 8 (72.7%) | 3 (27.3%) |
| College/Associate Degree | 5 (100.0%) | 0 (0.0%) |
| Bachelor's Degree or higher | 49 (100.0%) | 0 (0.0%) |
Occupancy by Age of Householder in Snowville
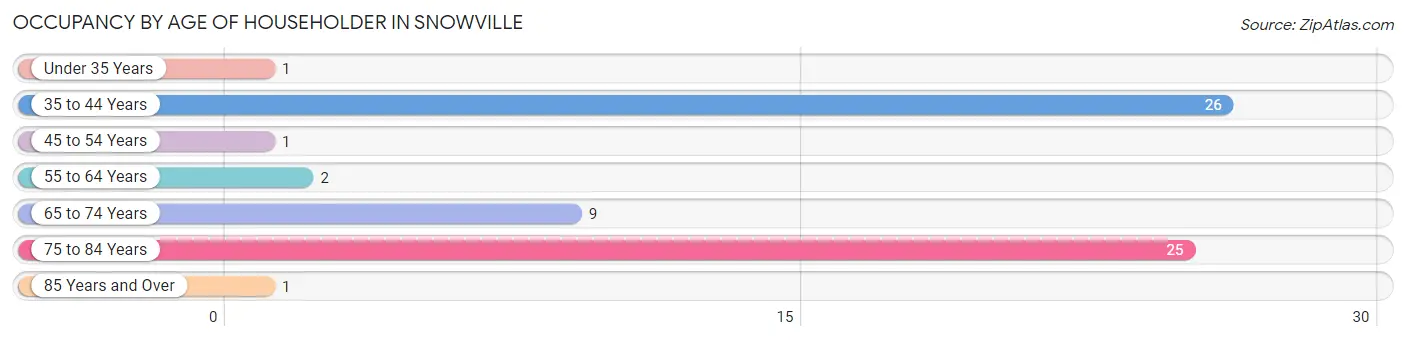
| Age Bracket | # Households | % Households |
| Under 35 Years | 1 | 1.5% |
| 35 to 44 Years | 26 | 40.0% |
| 45 to 54 Years | 1 | 1.5% |
| 55 to 64 Years | 2 | 3.1% |
| 65 to 74 Years | 9 | 13.9% |
| 75 to 84 Years | 25 | 38.5% |
| 85 Years and Over | 1 | 1.5% |
| Total | 65 | 100.0% |
Housing Finances in Snowville
Median Income by Occupancy in Snowville
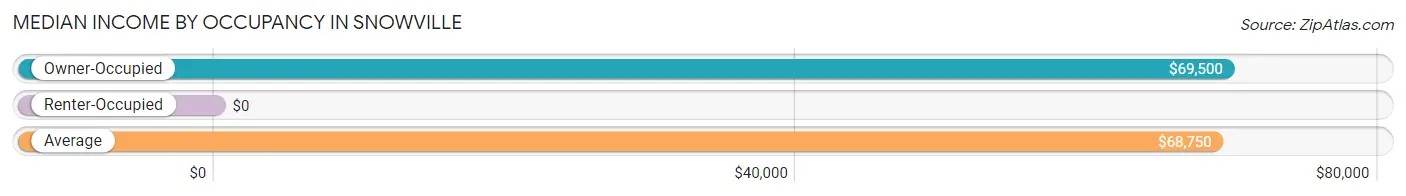
| Occupancy Type | # Households | Median Income |
| Owner-Occupied | 62 (95.4%) | $69,500 |
| Renter-Occupied | 3 (4.6%) | $0 |
| Average | 65 (100.0%) | $68,750 |
Occupancy by Householder Income Bracket in Snowville
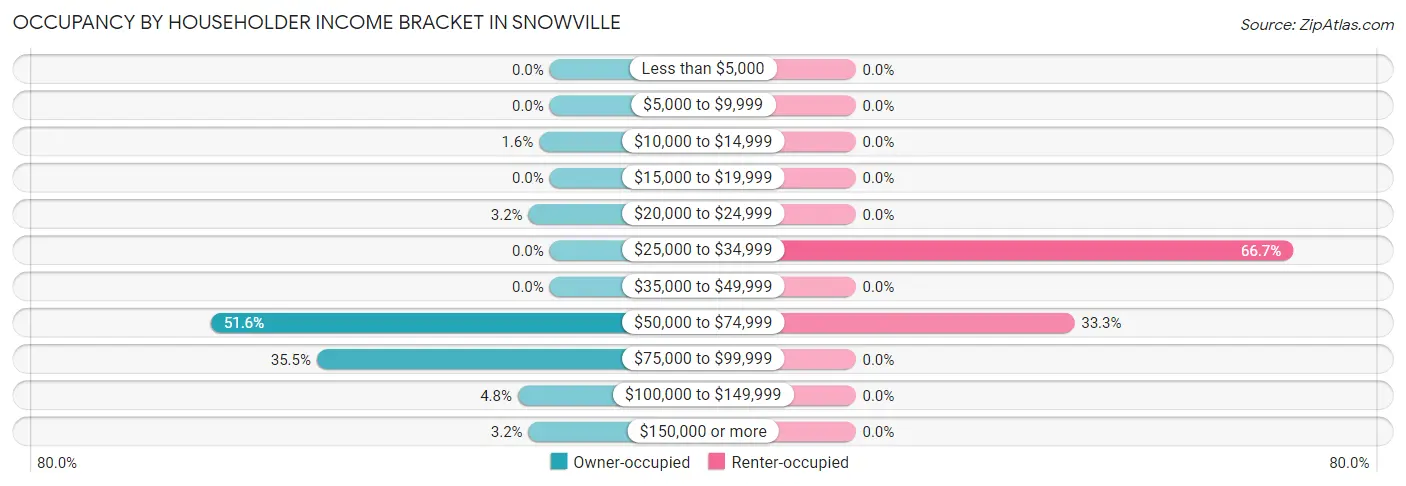
| Income Bracket | Owner-occupied | Renter-occupied |
| Less than $5,000 | 0 (0.0%) | 0 (0.0%) |
| $5,000 to $9,999 | 0 (0.0%) | 0 (0.0%) |
| $10,000 to $14,999 | 1 (1.6%) | 0 (0.0%) |
| $15,000 to $19,999 | 0 (0.0%) | 0 (0.0%) |
| $20,000 to $24,999 | 2 (3.2%) | 0 (0.0%) |
| $25,000 to $34,999 | 0 (0.0%) | 2 (66.7%) |
| $35,000 to $49,999 | 0 (0.0%) | 0 (0.0%) |
| $50,000 to $74,999 | 32 (51.6%) | 1 (33.3%) |
| $75,000 to $99,999 | 22 (35.5%) | 0 (0.0%) |
| $100,000 to $149,999 | 3 (4.8%) | 0 (0.0%) |
| $150,000 or more | 2 (3.2%) | 0 (0.0%) |
| Total | 62 (100.0%) | 3 (100.0%) |
Monthly Housing Cost Tiers in Snowville
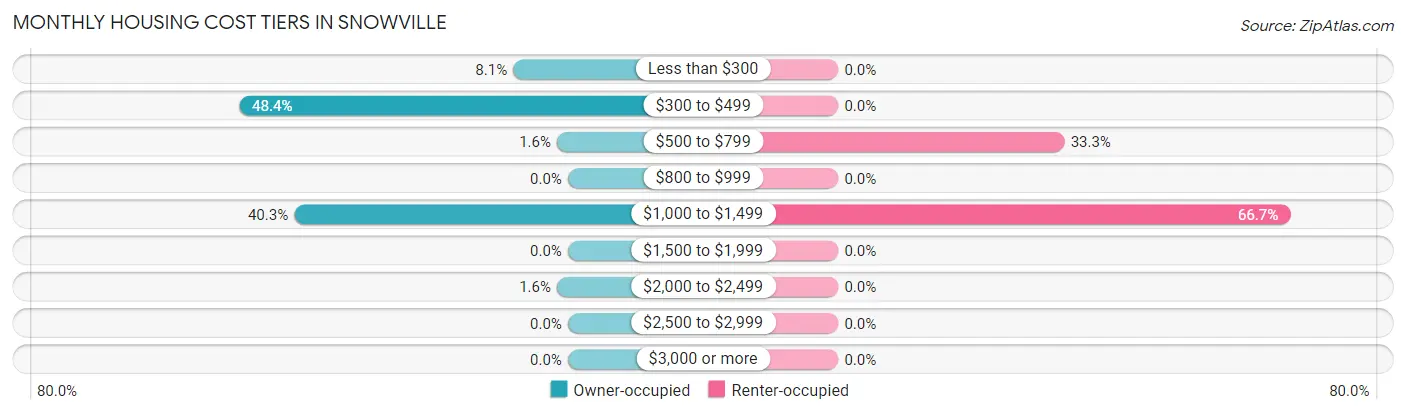
| Monthly Cost | Owner-occupied | Renter-occupied |
| Less than $300 | 5 (8.1%) | 0 (0.0%) |
| $300 to $499 | 30 (48.4%) | 0 (0.0%) |
| $500 to $799 | 1 (1.6%) | 1 (33.3%) |
| $800 to $999 | 0 (0.0%) | 0 (0.0%) |
| $1,000 to $1,499 | 25 (40.3%) | 2 (66.7%) |
| $1,500 to $1,999 | 0 (0.0%) | 0 (0.0%) |
| $2,000 to $2,499 | 1 (1.6%) | 0 (0.0%) |
| $2,500 to $2,999 | 0 (0.0%) | 0 (0.0%) |
| $3,000 or more | 0 (0.0%) | 0 (0.0%) |
| Total | 62 (100.0%) | 3 (100.0%) |
Physical Housing Characteristics in Snowville
Housing Structures in Snowville
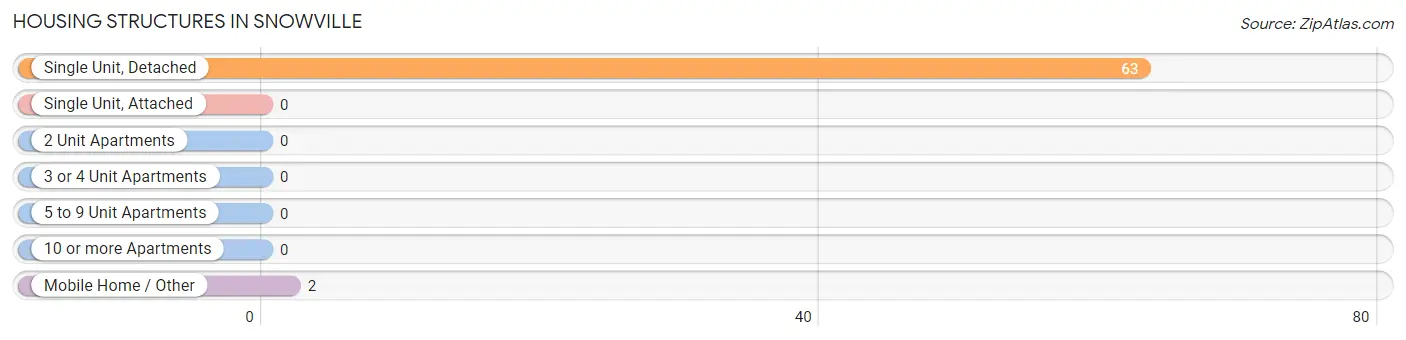
| Structure Type | # Housing Units | % Housing Units |
| Single Unit, Detached | 63 | 96.9% |
| Single Unit, Attached | 0 | 0.0% |
| 2 Unit Apartments | 0 | 0.0% |
| 3 or 4 Unit Apartments | 0 | 0.0% |
| 5 to 9 Unit Apartments | 0 | 0.0% |
| 10 or more Apartments | 0 | 0.0% |
| Mobile Home / Other | 2 | 3.1% |
| Total | 65 | 100.0% |
Housing Structures by Occupancy in Snowville
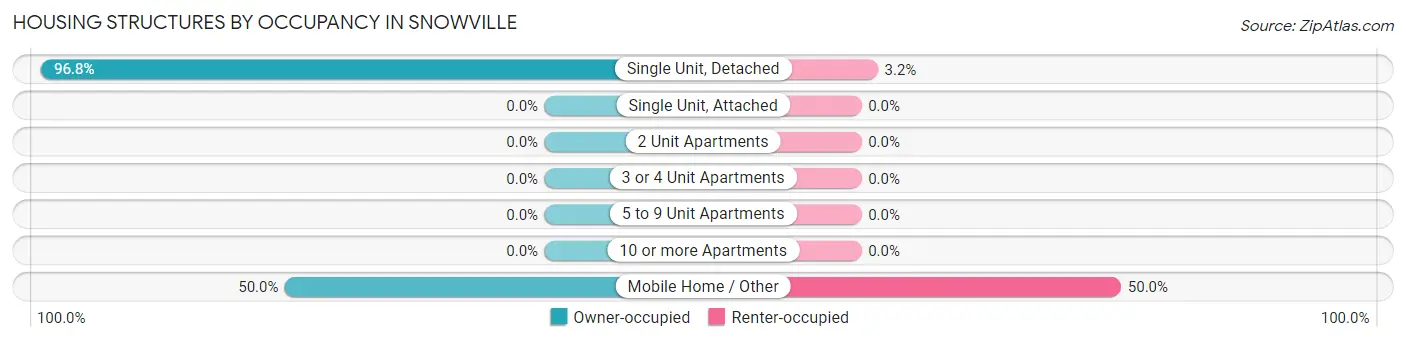
| Structure Type | Owner-occupied | Renter-occupied |
| Single Unit, Detached | 61 (96.8%) | 2 (3.2%) |
| Single Unit, Attached | 0 (0.0%) | 0 (0.0%) |
| 2 Unit Apartments | 0 (0.0%) | 0 (0.0%) |
| 3 or 4 Unit Apartments | 0 (0.0%) | 0 (0.0%) |
| 5 to 9 Unit Apartments | 0 (0.0%) | 0 (0.0%) |
| 10 or more Apartments | 0 (0.0%) | 0 (0.0%) |
| Mobile Home / Other | 1 (50.0%) | 1 (50.0%) |
| Total | 62 (95.4%) | 3 (4.6%) |
Housing Structures by Number of Rooms in Snowville
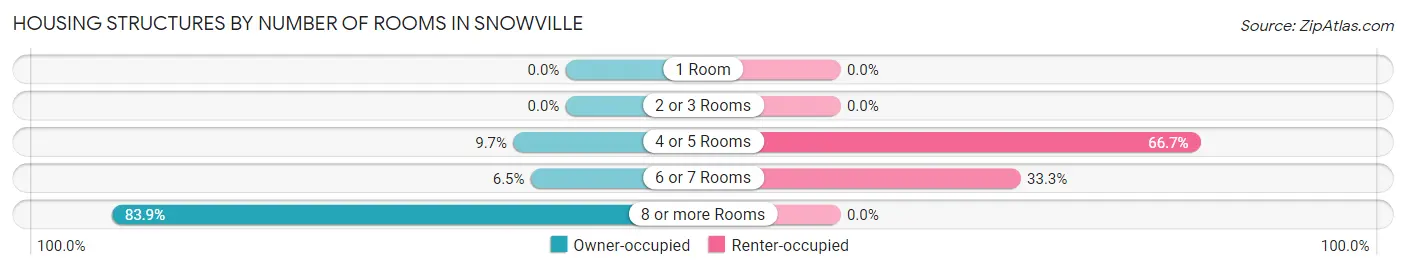
| Number of Rooms | Owner-occupied | Renter-occupied |
| 1 Room | 0 (0.0%) | 0 (0.0%) |
| 2 or 3 Rooms | 0 (0.0%) | 0 (0.0%) |
| 4 or 5 Rooms | 6 (9.7%) | 2 (66.7%) |
| 6 or 7 Rooms | 4 (6.5%) | 1 (33.3%) |
| 8 or more Rooms | 52 (83.9%) | 0 (0.0%) |
| Total | 62 (100.0%) | 3 (100.0%) |
Housing Structure by Heating Type in Snowville
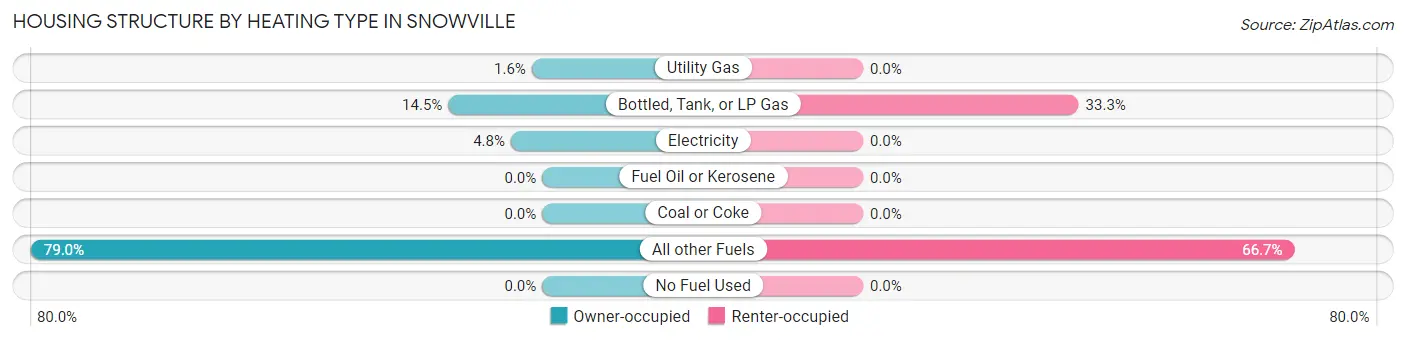
| Heating Type | Owner-occupied | Renter-occupied |
| Utility Gas | 1 (1.6%) | 0 (0.0%) |
| Bottled, Tank, or LP Gas | 9 (14.5%) | 1 (33.3%) |
| Electricity | 3 (4.8%) | 0 (0.0%) |
| Fuel Oil or Kerosene | 0 (0.0%) | 0 (0.0%) |
| Coal or Coke | 0 (0.0%) | 0 (0.0%) |
| All other Fuels | 49 (79.0%) | 2 (66.7%) |
| No Fuel Used | 0 (0.0%) | 0 (0.0%) |
| Total | 62 (100.0%) | 3 (100.0%) |
Household Vehicle Usage in Snowville
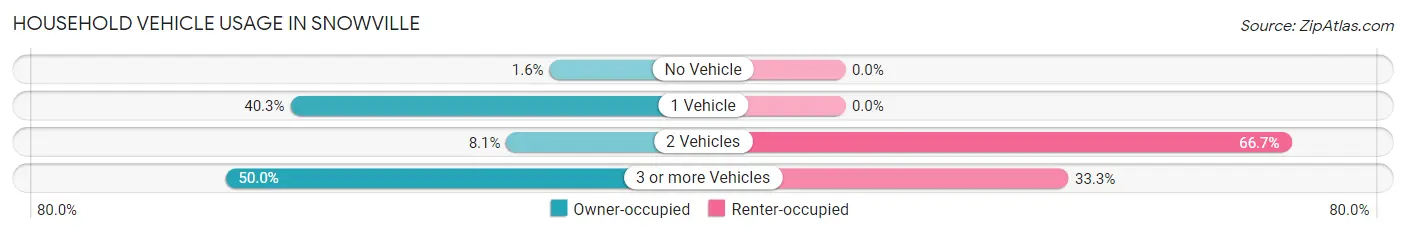
| Vehicles per Household | Owner-occupied | Renter-occupied |
| No Vehicle | 1 (1.6%) | 0 (0.0%) |
| 1 Vehicle | 25 (40.3%) | 0 (0.0%) |
| 2 Vehicles | 5 (8.1%) | 2 (66.7%) |
| 3 or more Vehicles | 31 (50.0%) | 1 (33.3%) |
| Total | 62 (100.0%) | 3 (100.0%) |
Real Estate & Mortgages in Snowville
Real Estate and Mortgage Overview in Snowville
| Characteristic | Without Mortgage | With Mortgage |
| Housing Units | 36 | 26 |
| Median Property Value | $162,100 | $222,700 |
| Median Household Income | $64,063 | $2 |
| Monthly Housing Costs | $439 | $0 |
| Real Estate Taxes | $1,167 | $0 |
Property Value by Mortgage Status in Snowville
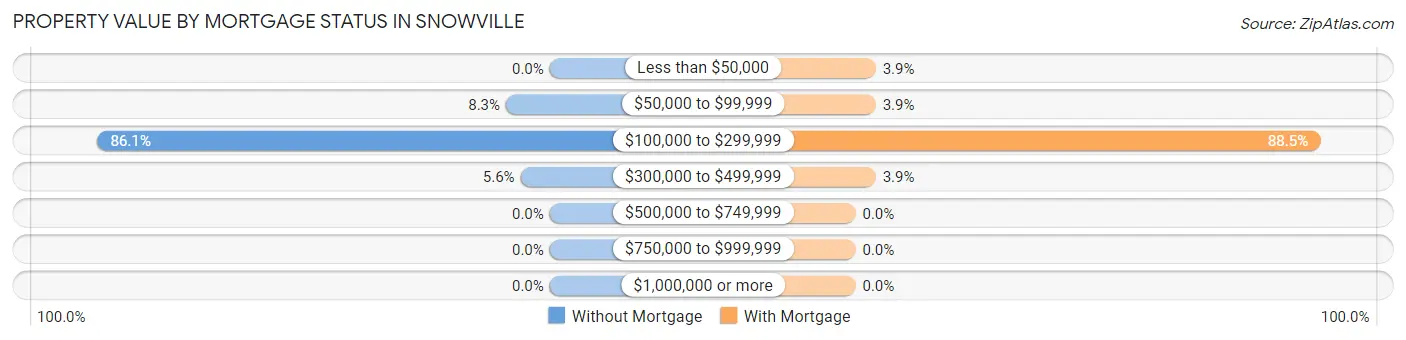
| Property Value | Without Mortgage | With Mortgage |
| Less than $50,000 | 0 (0.0%) | 1 (3.8%) |
| $50,000 to $99,999 | 3 (8.3%) | 1 (3.8%) |
| $100,000 to $299,999 | 31 (86.1%) | 23 (88.5%) |
| $300,000 to $499,999 | 2 (5.6%) | 1 (3.8%) |
| $500,000 to $749,999 | 0 (0.0%) | 0 (0.0%) |
| $750,000 to $999,999 | 0 (0.0%) | 0 (0.0%) |
| $1,000,000 or more | 0 (0.0%) | 0 (0.0%) |
| Total | 36 (100.0%) | 26 (100.0%) |
Household Income by Mortgage Status in Snowville
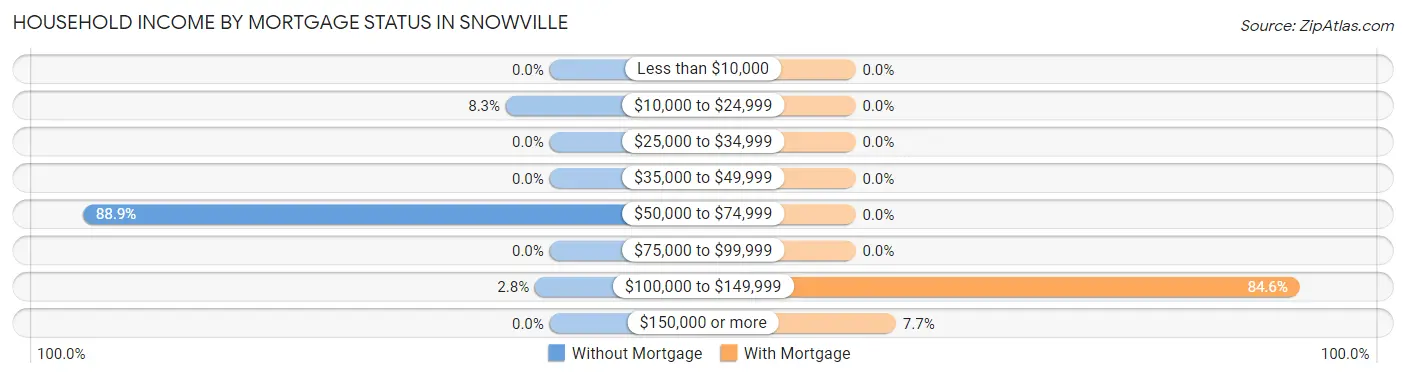
| Household Income | Without Mortgage | With Mortgage |
| Less than $10,000 | 0 (0.0%) | 0 (0.0%) |
| $10,000 to $24,999 | 3 (8.3%) | 0 (0.0%) |
| $25,000 to $34,999 | 0 (0.0%) | 0 (0.0%) |
| $35,000 to $49,999 | 0 (0.0%) | 0 (0.0%) |
| $50,000 to $74,999 | 32 (88.9%) | 0 (0.0%) |
| $75,000 to $99,999 | 0 (0.0%) | 0 (0.0%) |
| $100,000 to $149,999 | 1 (2.8%) | 22 (84.6%) |
| $150,000 or more | 0 (0.0%) | 2 (7.7%) |
| Total | 36 (100.0%) | 26 (100.0%) |
Property Value to Household Income Ratio in Snowville
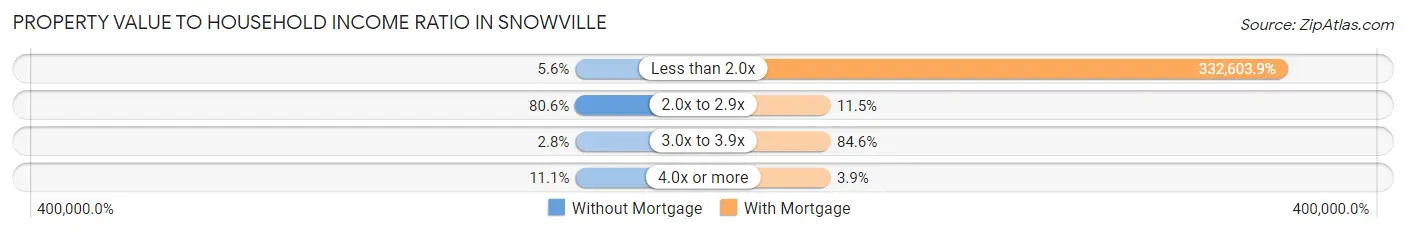
| Value-to-Income Ratio | Without Mortgage | With Mortgage |
| Less than 2.0x | 2 (5.6%) | 86,477 (332,603.9%) |
| 2.0x to 2.9x | 29 (80.6%) | 3 (11.5%) |
| 3.0x to 3.9x | 1 (2.8%) | 22 (84.6%) |
| 4.0x or more | 4 (11.1%) | 1 (3.8%) |
| Total | 36 (100.0%) | 26 (100.0%) |
Real Estate Taxes by Mortgage Status in Snowville
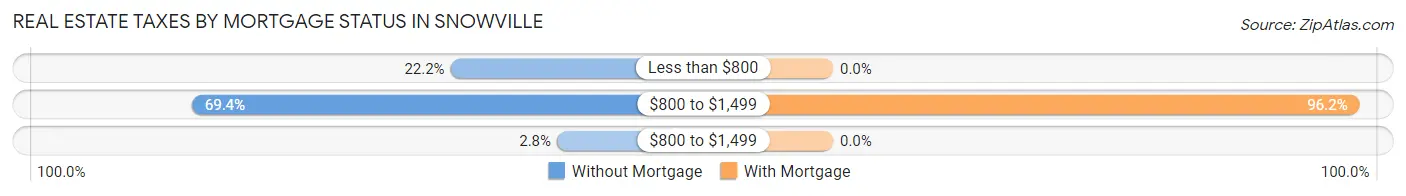
| Property Taxes | Without Mortgage | With Mortgage |
| Less than $800 | 8 (22.2%) | 0 (0.0%) |
| $800 to $1,499 | 25 (69.4%) | 25 (96.2%) |
| $800 to $1,499 | 1 (2.8%) | 0 (0.0%) |
| Total | 36 (100.0%) | 26 (100.0%) |
Health & Disability in Snowville
Health Insurance Coverage by Age in Snowville
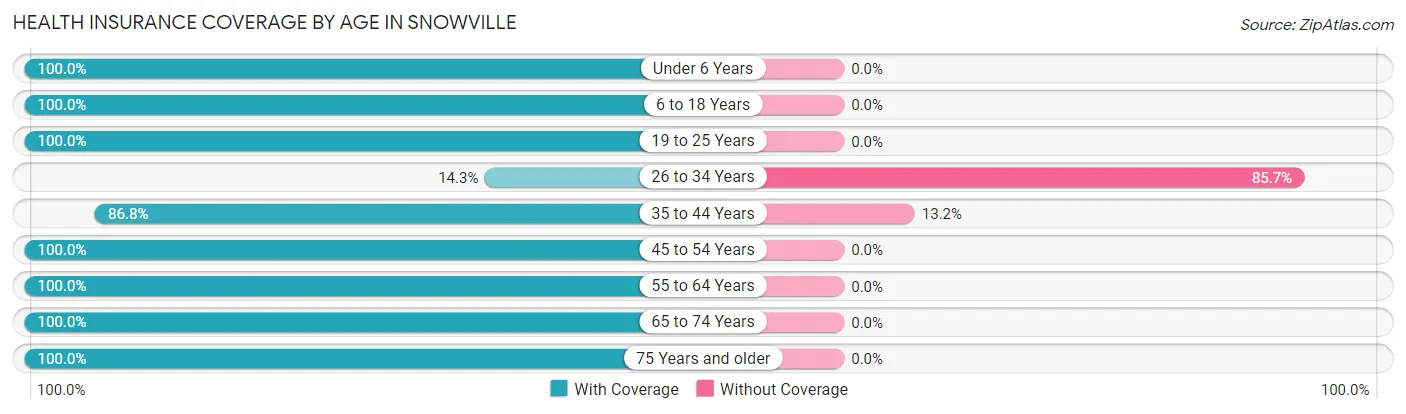
| Age Bracket | With Coverage | Without Coverage |
| Under 6 Years | 11 (100.0%) | 0 (0.0%) |
| 6 to 18 Years | 59 (100.0%) | 0 (0.0%) |
| 19 to 25 Years | 41 (100.0%) | 0 (0.0%) |
| 26 to 34 Years | 1 (14.3%) | 6 (85.7%) |
| 35 to 44 Years | 33 (86.8%) | 5 (13.2%) |
| 45 to 54 Years | 29 (100.0%) | 0 (0.0%) |
| 55 to 64 Years | 6 (100.0%) | 0 (0.0%) |
| 65 to 74 Years | 14 (100.0%) | 0 (0.0%) |
| 75 Years and older | 42 (100.0%) | 0 (0.0%) |
| Total | 236 (95.6%) | 11 (4.4%) |
Health Insurance Coverage by Citizenship Status in Snowville
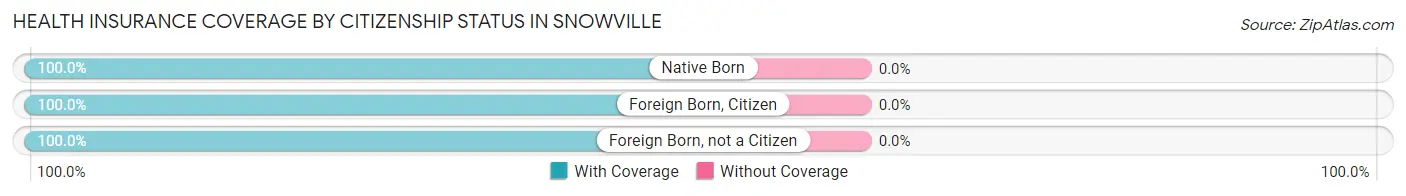
| Citizenship Status | With Coverage | Without Coverage |
| Native Born | 11 (100.0%) | 0 (0.0%) |
| Foreign Born, Citizen | 59 (100.0%) | 0 (0.0%) |
| Foreign Born, not a Citizen | 41 (100.0%) | 0 (0.0%) |
Health Insurance Coverage by Household Income in Snowville
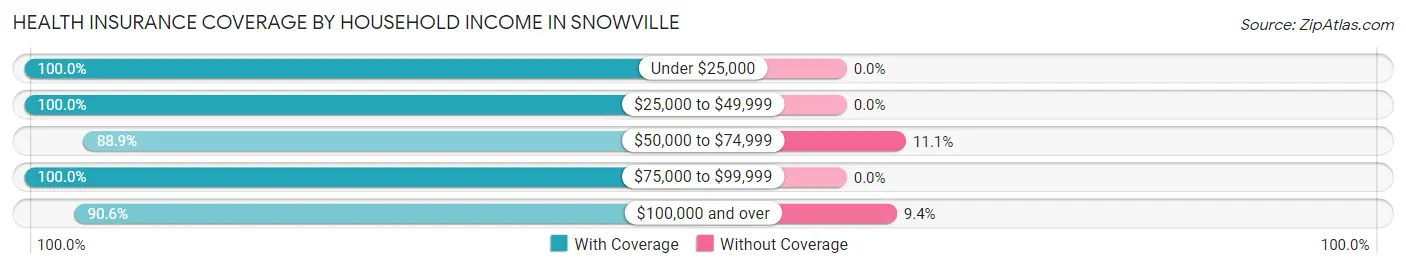
| Household Income | With Coverage | Without Coverage |
| Under $25,000 | 3 (100.0%) | 0 (0.0%) |
| $25,000 to $49,999 | 2 (100.0%) | 0 (0.0%) |
| $50,000 to $74,999 | 64 (88.9%) | 8 (11.1%) |
| $75,000 to $99,999 | 138 (100.0%) | 0 (0.0%) |
| $100,000 and over | 29 (90.6%) | 3 (9.4%) |
Public vs Private Health Insurance Coverage by Age in Snowville
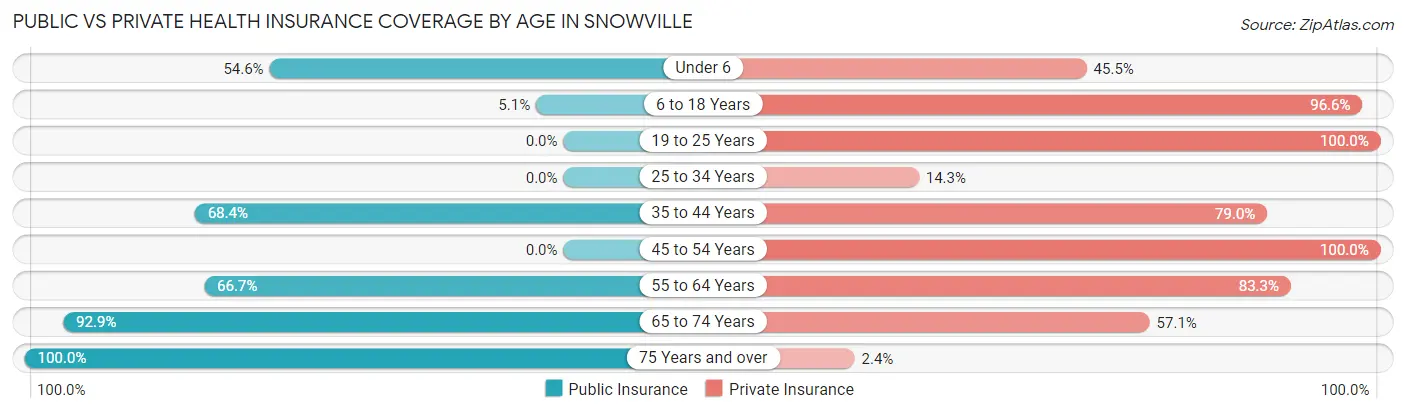
| Age Bracket | Public Insurance | Private Insurance |
| Under 6 | 6 (54.5%) | 5 (45.5%) |
| 6 to 18 Years | 3 (5.1%) | 57 (96.6%) |
| 19 to 25 Years | 0 (0.0%) | 41 (100.0%) |
| 25 to 34 Years | 0 (0.0%) | 1 (14.3%) |
| 35 to 44 Years | 26 (68.4%) | 30 (78.9%) |
| 45 to 54 Years | 0 (0.0%) | 29 (100.0%) |
| 55 to 64 Years | 4 (66.7%) | 5 (83.3%) |
| 65 to 74 Years | 13 (92.9%) | 8 (57.1%) |
| 75 Years and over | 42 (100.0%) | 1 (2.4%) |
| Total | 94 (38.1%) | 177 (71.7%) |
Disability Status by Sex by Age in Snowville
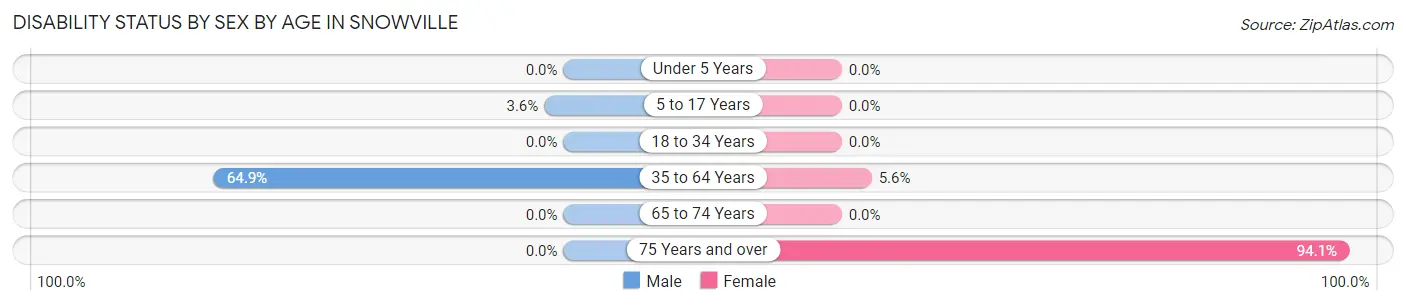
| Age Bracket | Male | Female |
| Under 5 Years | 0 (0.0%) | 0 (0.0%) |
| 5 to 17 Years | 1 (3.6%) | 0 (0.0%) |
| 18 to 34 Years | 0 (0.0%) | 0 (0.0%) |
| 35 to 64 Years | 24 (64.9%) | 2 (5.6%) |
| 65 to 74 Years | 0 (0.0%) | 0 (0.0%) |
| 75 Years and over | 0 (0.0%) | 16 (94.1%) |
Disability Class by Sex by Age in Snowville
Disability Class: Hearing Difficulty
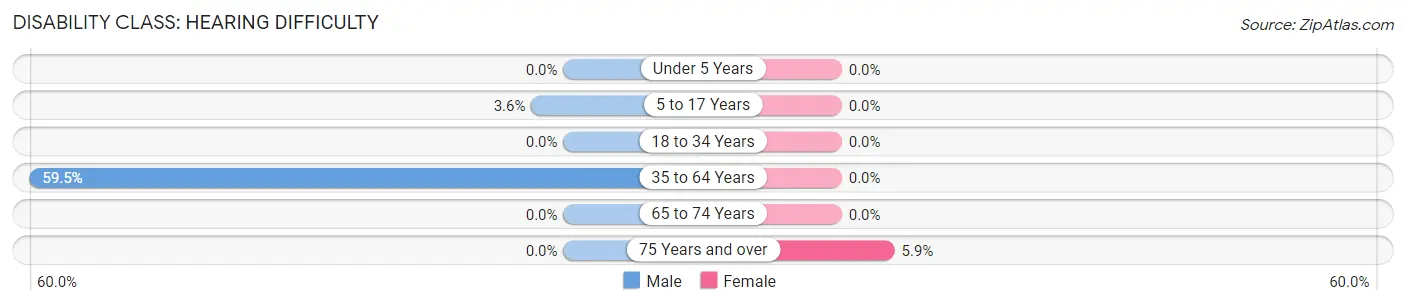
| Age Bracket | Male | Female |
| Under 5 Years | 0 (0.0%) | 0 (0.0%) |
| 5 to 17 Years | 1 (3.6%) | 0 (0.0%) |
| 18 to 34 Years | 0 (0.0%) | 0 (0.0%) |
| 35 to 64 Years | 22 (59.5%) | 0 (0.0%) |
| 65 to 74 Years | 0 (0.0%) | 0 (0.0%) |
| 75 Years and over | 0 (0.0%) | 1 (5.9%) |
Disability Class: Vision Difficulty
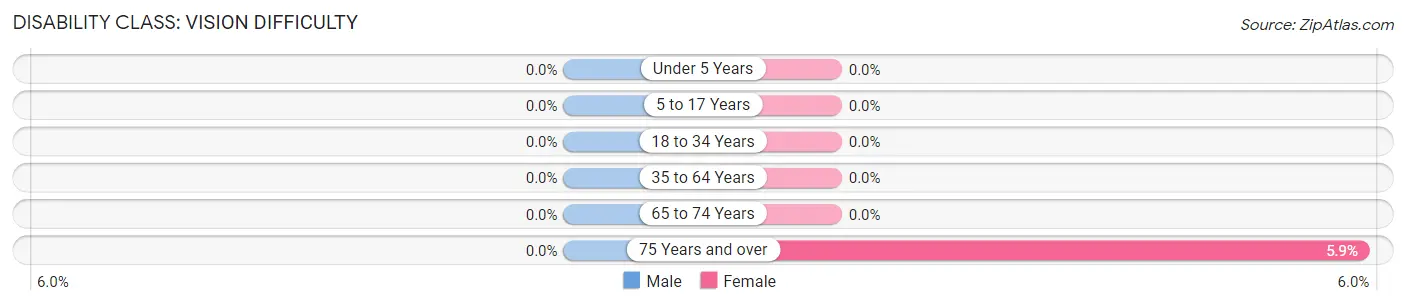
| Age Bracket | Male | Female |
| Under 5 Years | 0 (0.0%) | 0 (0.0%) |
| 5 to 17 Years | 0 (0.0%) | 0 (0.0%) |
| 18 to 34 Years | 0 (0.0%) | 0 (0.0%) |
| 35 to 64 Years | 0 (0.0%) | 0 (0.0%) |
| 65 to 74 Years | 0 (0.0%) | 0 (0.0%) |
| 75 Years and over | 0 (0.0%) | 1 (5.9%) |
Disability Class: Cognitive Difficulty
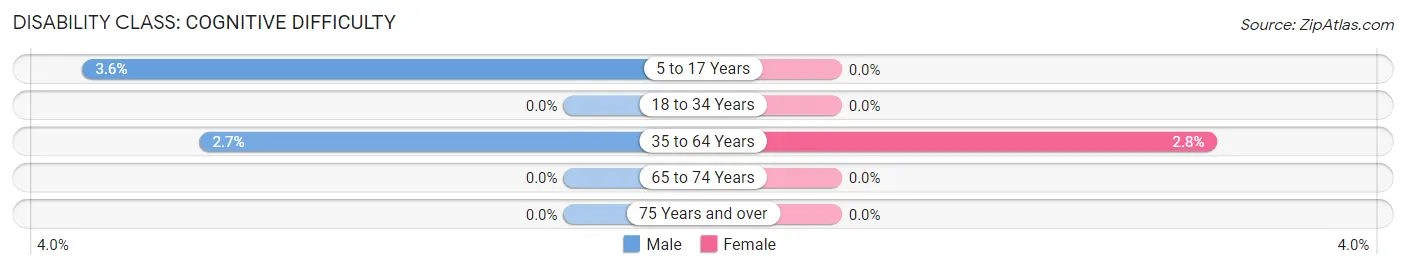
| Age Bracket | Male | Female |
| 5 to 17 Years | 1 (3.6%) | 0 (0.0%) |
| 18 to 34 Years | 0 (0.0%) | 0 (0.0%) |
| 35 to 64 Years | 1 (2.7%) | 1 (2.8%) |
| 65 to 74 Years | 0 (0.0%) | 0 (0.0%) |
| 75 Years and over | 0 (0.0%) | 0 (0.0%) |
Disability Class: Ambulatory Difficulty
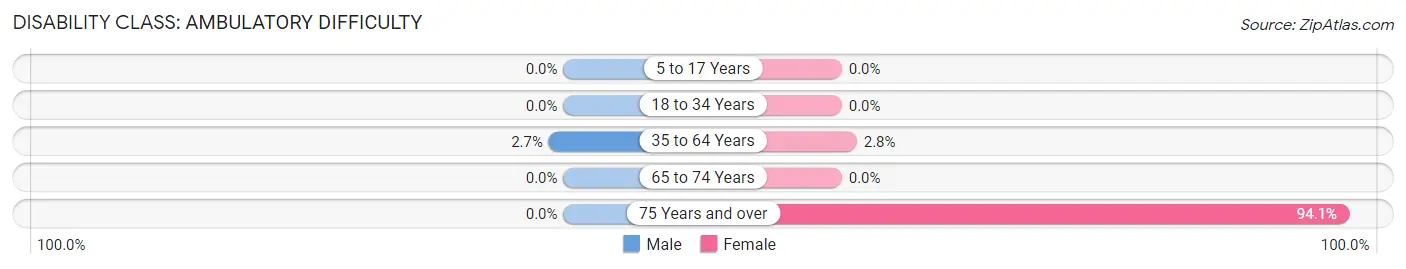
| Age Bracket | Male | Female |
| 5 to 17 Years | 0 (0.0%) | 0 (0.0%) |
| 18 to 34 Years | 0 (0.0%) | 0 (0.0%) |
| 35 to 64 Years | 1 (2.7%) | 1 (2.8%) |
| 65 to 74 Years | 0 (0.0%) | 0 (0.0%) |
| 75 Years and over | 0 (0.0%) | 16 (94.1%) |
Disability Class: Self-Care Difficulty
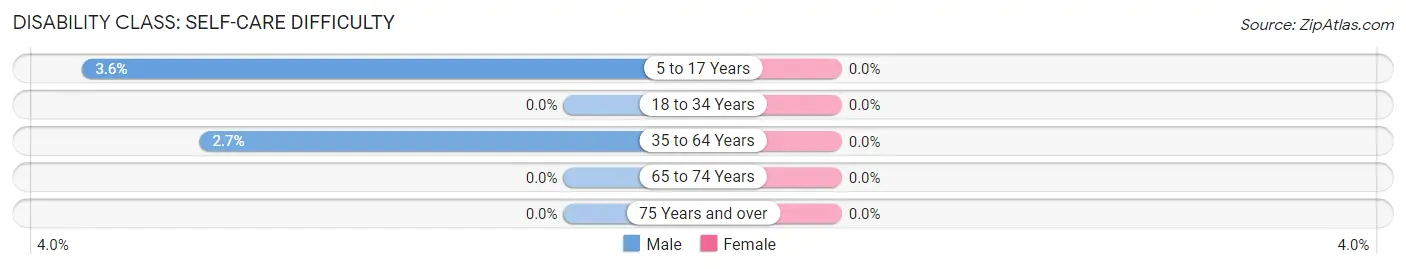
| Age Bracket | Male | Female |
| 5 to 17 Years | 1 (3.6%) | 0 (0.0%) |
| 18 to 34 Years | 0 (0.0%) | 0 (0.0%) |
| 35 to 64 Years | 1 (2.7%) | 0 (0.0%) |
| 65 to 74 Years | 0 (0.0%) | 0 (0.0%) |
| 75 Years and over | 0 (0.0%) | 0 (0.0%) |
Technology Access in Snowville
Computing Device Access in Snowville
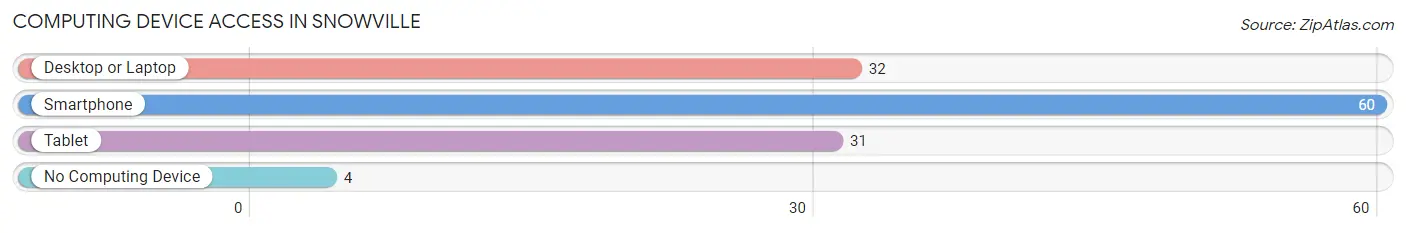
| Device Type | # Households | % Households |
| Desktop or Laptop | 32 | 49.2% |
| Smartphone | 60 | 92.3% |
| Tablet | 31 | 47.7% |
| No Computing Device | 4 | 6.1% |
| Total | 65 | 100.0% |
Internet Access in Snowville
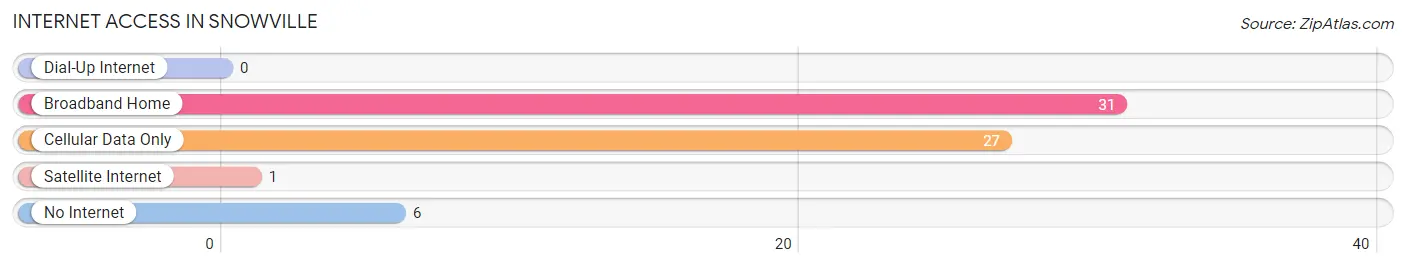
| Internet Type | # Households | % Households |
| Dial-Up Internet | 0 | 0.0% |
| Broadband Home | 31 | 47.7% |
| Cellular Data Only | 27 | 41.5% |
| Satellite Internet | 1 | 1.5% |
| No Internet | 6 | 9.2% |
| Total | 65 | 100.0% |
Snowville Summary
History
The small town of Snowville, Utah is located in the northern part of the state, near the Idaho border. It was first settled in 1869 by a group of Mormon pioneers who were looking for a place to settle and raise their families. The town was named after the nearby mountain range, which was covered in snow year-round. The town grew slowly over the years, and by the early 1900s, it had become a thriving agricultural community.
The town was known for its dairy farms, and the local economy was largely based on the production of milk and cheese. The town also had a few small businesses, such as a general store, a blacksmith, and a few other small shops. The town was also home to a few churches, including the Church of Jesus Christ of Latter-day Saints.
In the 1950s, the town began to experience a decline in population as many of the younger generations moved away in search of better opportunities. This trend continued until the late 1980s, when the town began to experience a resurgence in population growth. This was largely due to the influx of new residents who were attracted to the area’s rural charm and the nearby recreational opportunities.
Geography
Snowville is located in the northern part of Utah, near the Idaho border. It is situated in the Cache Valley, which is a large valley surrounded by mountains. The town is located at an elevation of 4,500 feet, and the surrounding area is mostly flat with rolling hills. The climate in the area is semi-arid, with hot summers and cold winters.
The town is located near several recreational areas, including the Bear River Mountains, the Wasatch Mountains, and the Great Salt Lake. These areas provide a variety of outdoor activities, such as hiking, camping, fishing, and skiing.
Economy
The economy of Snowville is largely based on agriculture and tourism. The town is home to several dairy farms, which produce milk and cheese for the local market. The town also has a few small businesses, such as a general store, a blacksmith, and a few other small shops.
The town is also home to several tourist attractions, such as the Bear River Mountains, the Wasatch Mountains, and the Great Salt Lake. These areas provide a variety of outdoor activities, such as hiking, camping, fishing, and skiing.
Demographics
As of the 2010 census, the population of Snowville was 1,845. The town is predominantly white, with a small Hispanic population. The median household income is $41,000, and the median age is 37. The town has a low unemployment rate of 4.2%.
Conclusion
Snowville, Utah is a small town located in the northern part of the state, near the Idaho border. It was first settled in 1869 by a group of Mormon pioneers, and it has since grown into a thriving agricultural community. The town is known for its dairy farms, and the local economy is largely based on the production of milk and cheese. The town is also home to several recreational areas, which provide a variety of outdoor activities. The population of Snowville is predominantly white, with a small Hispanic population. The median household income is $41,000, and the median age is 37. The town has a low unemployment rate of 4.2%.
Common Questions
What is Per Capita Income in Snowville?
Per Capita income in Snowville is $20,393.
What is the Median Family Income in Snowville?
Median Family Income in Snowville is $71,250.
What is the Median Household income in Snowville?
Median Household Income in Snowville is $68,750.
What is Income or Wage Gap in Snowville?
Income or Wage Gap in Snowville is 95.1%.
Women in Snowville earn 4.9 cents for every dollar earned by a man.
What is Inequality or Gini Index in Snowville?
Inequality or Gini Index in Snowville is 0.18.
What is the Total Population of Snowville?
Total Population of Snowville is 247.
What is the Total Male Population of Snowville?
Total Male Population of Snowville is 132.
What is the Total Female Population of Snowville?
Total Female Population of Snowville is 115.
What is the Ratio of Males per 100 Females in Snowville?
There are 114.78 Males per 100 Females in Snowville.
What is the Ratio of Females per 100 Males in Snowville?
There are 87.12 Females per 100 Males in Snowville.
What is the Median Population Age in Snowville?
Median Population Age in Snowville is 39.6 Years.
What is the Average Family Size in Snowville
Average Family Size in Snowville is 4.0 People.
What is the Average Household Size in Snowville
Average Household Size in Snowville is 3.8 People.
How Large is the Labor Force in Snowville?
There are 59 People in the Labor Forcein in Snowville.
What is the Percentage of People in the Labor Force in Snowville?
33.0% of People are in the Labor Force in Snowville.