Zip Codes with the Highest Percentage of Population with a Degree in Social Sciences in Sandy, UT

RELATED REPORTS & OPTIONS

Social Sciences
Population
Families and Households
Female Fertility
Female Fertility (Unmarried)
Race (Community Size)
Race (Percentage)
Ancestry (Community Size)
AfricanAmericanArabArgentineanArmenianAustralianAustrianBasqueBelgianBhutaneseBolivianBrazilianBritishBurmeseCanadianCentral AmericanCentral American IndianCherokeeChileanChippewaChoctawColombianCroatianCubanCzechCzechoslovakianDanishDutchEastern EuropeanEcuadorianEnglishEuropeanFilipinoFinnishFrenchFrench CanadianGermanGreekGuatemalanHungarianIcelanderIndian (Asian)IranianIraqiIrishItalianKoreanLebaneseLithuanianMalaysianMexicanMexican American IndianNative HawaiianNavajoNigerianNorthern EuropeanNorwegianPakistaniPalestinianPeruvianPolishPortuguesePuerto RicanRomanianRussianSalvadoranSamoanScandinavianScotch-IrishScottishSerbianSiouxSlavicSlovakSloveneSouth AfricanSouth AmericanSouth American IndianSpaniardSpanishSri LankanSubsaharan AfricanSwedishSwissThaiTonganUkrainianVenezuelanWelshYugoslavian
Ancestry (Percentage)
AfricanAmericanArabArgentineanArmenianAustralianAustrianBasqueBelgianBhutaneseBolivianBrazilianBritishBurmeseCanadianCentral AmericanCentral American IndianCherokeeChileanChippewaChoctawColombianCroatianCubanCzechCzechoslovakianDanishDutchEastern EuropeanEcuadorianEnglishEuropeanFilipinoFinnishFrenchFrench CanadianGermanGreekGuatemalanHungarianIcelanderIndian (Asian)IranianIraqiIrishItalianKoreanLebaneseLithuanianMalaysianMexicanMexican American IndianNative HawaiianNavajoNigerianNorthern EuropeanNorwegianPakistaniPalestinianPeruvianPolishPortuguesePuerto RicanRomanianRussianSalvadoranSamoanScandinavianScotch-IrishScottishSerbianSiouxSlavicSlovakSloveneSouth AfricanSouth AmericanSouth American IndianSpaniardSpanishSri LankanSubsaharan AfricanSwedishSwissThaiTonganUkrainianVenezuelanWelshYugoslavian
Immigrant Origin (Total)
Immigrant Origin (Percentage)
Income
Income (Families)
Income (Households)
Poverty
Poverty (Families)
Unemployment
Employment Occupations
Employment Industries
Employer Class
Commute Time
Commute Means
School Enrollment
Education by Degree Field
Occupancy
Finances
Physical Characteristics
Sandy
Compare Zip Codes
Comparison Subject

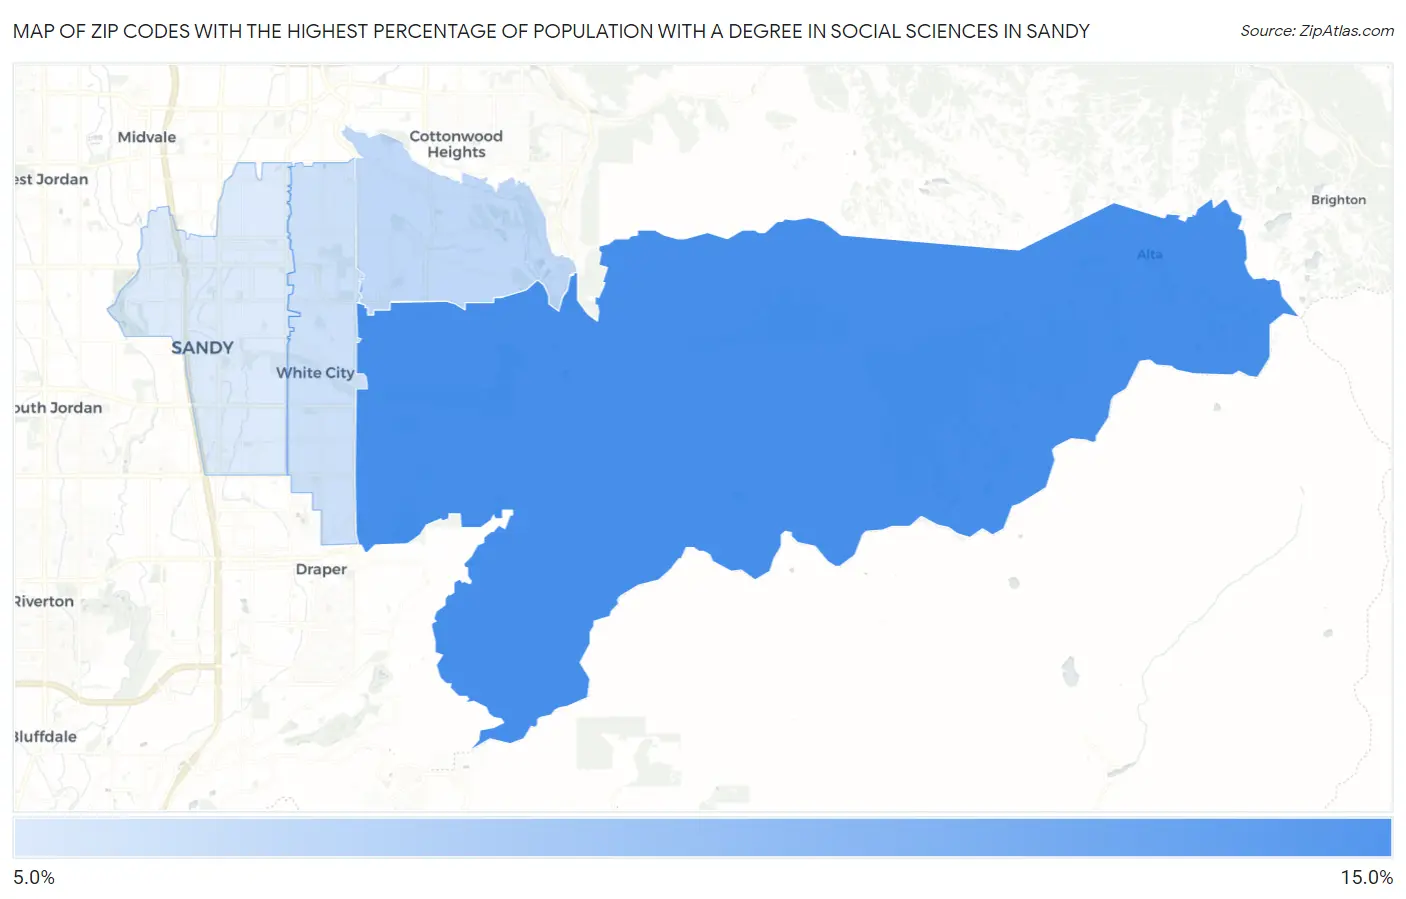
Map of Zip Codes with the Highest Percentage of Population with a Degree in Social Sciences in Sandy

0.0%
15.0%
Zip Codes with the Highest Percentage of Population with a Degree in Social Sciences in Sandy Map

Zip Codes with the Highest Percentage of Population with a Degree in Social Sciences in Sandy, UT

Zip Code % Graduates vs State vs National
1.8409211.2%7.4%(+3.82)#318.1%(+3.18)#4,129
2.840939.8%7.4%(+2.42)#468.1%(+1.77)#5,760
3.840949.7%7.4%(+2.27)#478.1%(+1.63)#5,944
4.840709.5%7.4%(+2.08)#548.1%(+1.43)#6,205

Common Questions

What are the Top 3 Zip Codes with the Highest Percentage of Population with a Degree in Social Sciences in Sandy, UT?
Top 3 Zip Codes with the Highest Percentage of Population with a Degree in Social Sciences in Sandy, UT are:
#1
11.2%
#2
9.8%
#3
9.7%
What zip code has the Highest Percentage of Population with a Degree in Social Sciences in Sandy, UT?
84092 has the Highest Percentage of Population with a Degree in Social Sciences in Sandy, UT with 11.2%.
What is the Percentage of Population with a Degree in Social Sciences in Sandy, UT?
Percentage of Population with a Degree in Social Sciences in Sandy is 10.0%.
What is the Percentage of Population with a Degree in Social Sciences in Utah?
Percentage of Population with a Degree in Social Sciences in Utah is 7.4%.
What is the Percentage of Population with a Degree in Social Sciences in the United States?
Percentage of Population with a Degree in Social Sciences in the United States is 8.1%.