Rush Valley, UT Map & Demographics
Rush Valley Map
Rush Valley Overview
$35,443
PER CAPITA INCOME
$106,563
AVG FAMILY INCOME
$82,000
AVG HOUSEHOLD INCOME
59.0%
WAGE / INCOME GAP [ % ]
41.0¢/ $1
WAGE / INCOME GAP [ $ ]
0.34
INEQUALITY / GINI INDEX
437
TOTAL POPULATION
224
MALE POPULATION
213
FEMALE POPULATION
105.16
MALES / 100 FEMALES
95.09
FEMALES / 100 MALES
44.2
MEDIAN AGE
3.4
AVG FAMILY SIZE
2.6
AVG HOUSEHOLD SIZE
185
LABOR FORCE [ PEOPLE ]
53.8%
PERCENT IN LABOR FORCE
1.6%
UNEMPLOYMENT RATE
Rush Valley Zip Codes
Rush Valley Area Codes
Income in Rush Valley
Income Overview in Rush Valley
Per Capita Income in Rush Valley is $35,443, while median incomes of families and households are $106,563 and $82,000 respectively.
| Characteristic | Number | Measure |
| Per Capita Income | 437 | $35,443 |
| Median Family Income | 109 | $106,563 |
| Mean Family Income | 109 | $105,778 |
| Median Household Income | 168 | $82,000 |
| Mean Household Income | 168 | $89,127 |
| Income Deficit | 109 | $0 |
| Wage / Income Gap (%) | 437 | 59.00% |
| Wage / Income Gap ($) | 437 | 41.00¢ per $1 |
| Gini / Inequality Index | 437 | 0.34 |
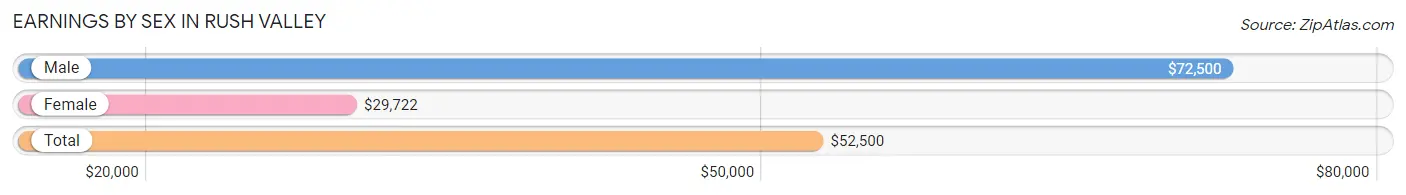
Earnings by Sex in Rush Valley
Average Earnings in Rush Valley are $52,500, $72,500 for men and $29,722 for women, a difference of 59.0%.
| Sex | Number | Average Earnings |
| Male | 106 (53.5%) | $72,500 |
| Female | 92 (46.5%) | $29,722 |
| Total | 198 (100.0%) | $52,500 |
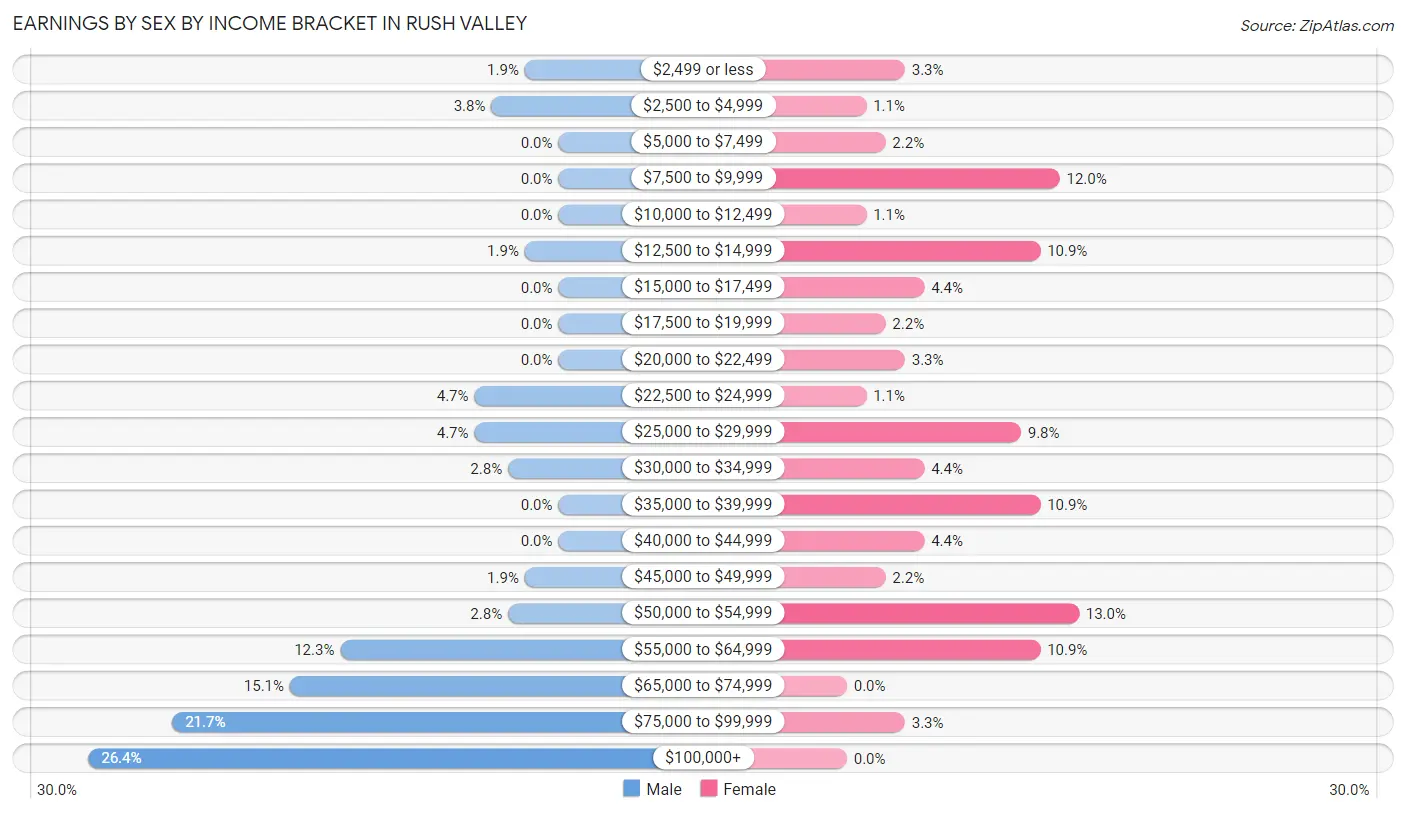
Earnings by Sex by Income Bracket in Rush Valley
The most common earnings brackets in Rush Valley are $100,000+ for men (28 | 26.4%) and $50,000 to $54,999 for women (12 | 13.0%).
| Income | Male | Female |
| $2,499 or less | 2 (1.9%) | 3 (3.3%) |
| $2,500 to $4,999 | 4 (3.8%) | 1 (1.1%) |
| $5,000 to $7,499 | 0 (0.0%) | 2 (2.2%) |
| $7,500 to $9,999 | 0 (0.0%) | 11 (12.0%) |
| $10,000 to $12,499 | 0 (0.0%) | 1 (1.1%) |
| $12,500 to $14,999 | 2 (1.9%) | 10 (10.9%) |
| $15,000 to $17,499 | 0 (0.0%) | 4 (4.3%) |
| $17,500 to $19,999 | 0 (0.0%) | 2 (2.2%) |
| $20,000 to $22,499 | 0 (0.0%) | 3 (3.3%) |
| $22,500 to $24,999 | 5 (4.7%) | 1 (1.1%) |
| $25,000 to $29,999 | 5 (4.7%) | 9 (9.8%) |
| $30,000 to $34,999 | 3 (2.8%) | 4 (4.3%) |
| $35,000 to $39,999 | 0 (0.0%) | 10 (10.9%) |
| $40,000 to $44,999 | 0 (0.0%) | 4 (4.3%) |
| $45,000 to $49,999 | 2 (1.9%) | 2 (2.2%) |
| $50,000 to $54,999 | 3 (2.8%) | 12 (13.0%) |
| $55,000 to $64,999 | 13 (12.3%) | 10 (10.9%) |
| $65,000 to $74,999 | 16 (15.1%) | 0 (0.0%) |
| $75,000 to $99,999 | 23 (21.7%) | 3 (3.3%) |
| $100,000+ | 28 (26.4%) | 0 (0.0%) |
| Total | 106 (100.0%) | 92 (100.0%) |
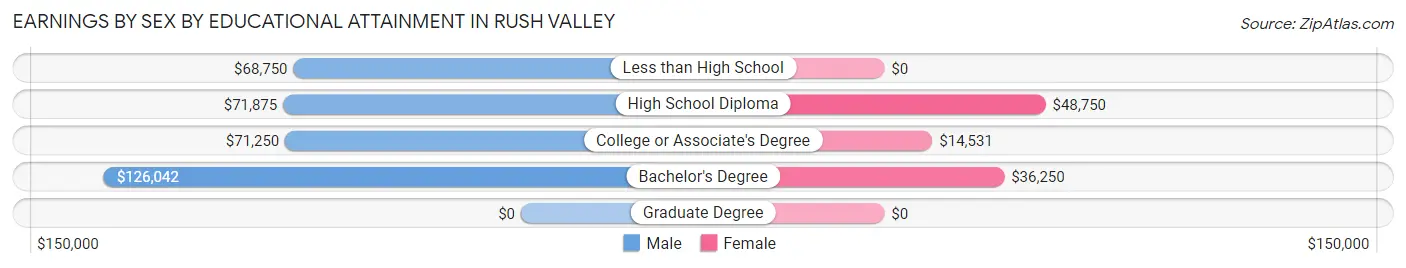
Earnings by Sex by Educational Attainment in Rush Valley
Average earnings in Rush Valley are $82,083 for men and $29,167 for women, a difference of 64.5%. Men with an educational attainment of bachelor's degree enjoy the highest average annual earnings of $126,042, while those with less than high school education earn the least with $68,750. Women with an educational attainment of high school diploma earn the most with the average annual earnings of $48,750, while those with college or associate's degree education have the smallest earnings of $14,531.
| Educational Attainment | Male Income | Female Income |
| Less than High School | $68,750 | $0 |
| High School Diploma | $71,875 | $48,750 |
| College or Associate's Degree | $71,250 | $14,531 |
| Bachelor's Degree | $126,042 | $36,250 |
| Graduate Degree | - | - |
| Total | $82,083 | $29,167 |
Family Income in Rush Valley
Family Income Brackets in Rush Valley
According to the Rush Valley family income data, there are 31 families falling into the $100,000 to $149,999 income range, which is the most common income bracket and makes up 28.4% of all families. Conversely, the $25,000 to $34,999 income bracket is the least frequent group with only 1 families (0.9%) belonging to this category.
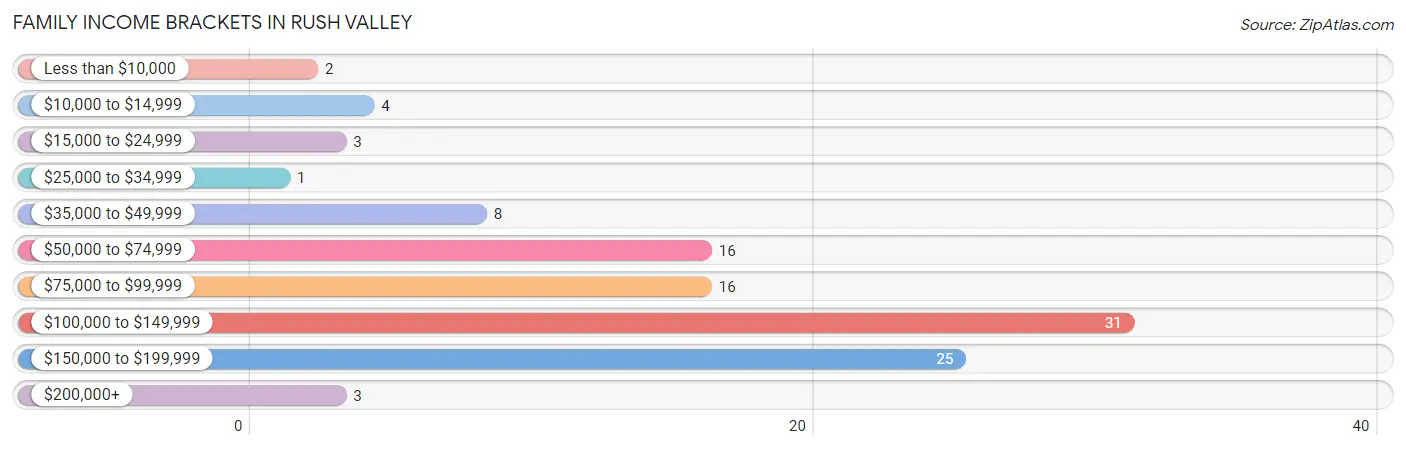
| Income Bracket | # Families | % Families |
| Less than $10,000 | 2 | 1.8% |
| $10,000 to $14,999 | 4 | 3.7% |
| $15,000 to $24,999 | 3 | 2.8% |
| $25,000 to $34,999 | 1 | 0.9% |
| $35,000 to $49,999 | 8 | 7.3% |
| $50,000 to $74,999 | 16 | 14.7% |
| $75,000 to $99,999 | 16 | 14.7% |
| $100,000 to $149,999 | 31 | 28.4% |
| $150,000 to $199,999 | 25 | 22.9% |
| $200,000+ | 3 | 2.8% |
Family Income by Famaliy Size in Rush Valley
4-person families (25 | 22.9%) account for the highest median family income in Rush Valley with $156,042 per family, while 2-person families (49 | 45.0%) have the highest median income of $50,312 per family member.
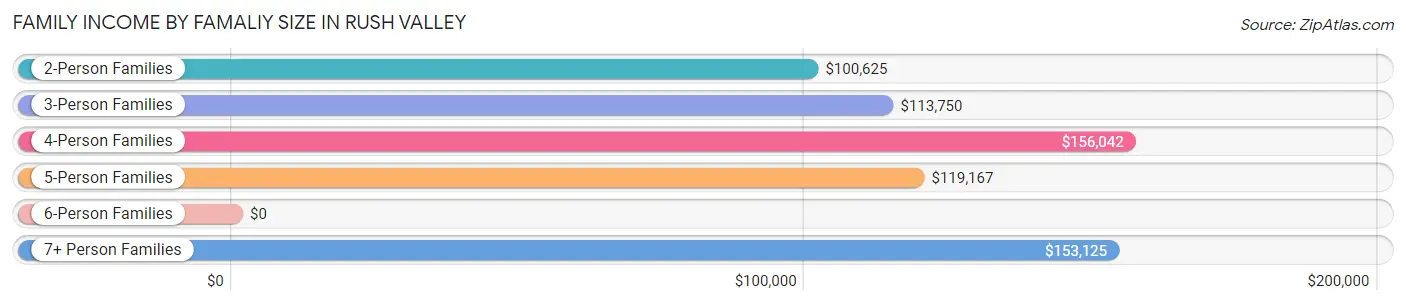
| Income Bracket | # Families | Median Income |
| 2-Person Families | 49 (45.0%) | $100,625 |
| 3-Person Families | 15 (13.8%) | $113,750 |
| 4-Person Families | 25 (22.9%) | $156,042 |
| 5-Person Families | 8 (7.3%) | $119,167 |
| 6-Person Families | 7 (6.4%) | $0 |
| 7+ Person Families | 5 (4.6%) | $153,125 |
| Total | 109 (100.0%) | $106,563 |
Family Income by Number of Earners in Rush Valley
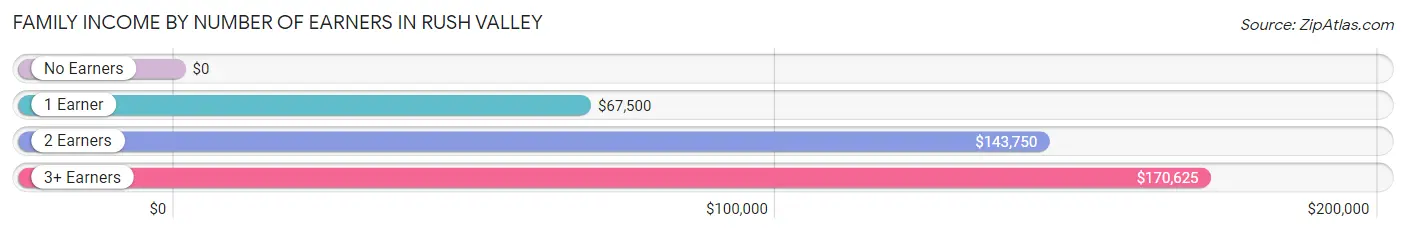
| Number of Earners | # Families | Median Income |
| No Earners | 21 (19.3%) | $0 |
| 1 Earner | 38 (34.9%) | $67,500 |
| 2 Earners | 42 (38.5%) | $143,750 |
| 3+ Earners | 8 (7.3%) | $170,625 |
| Total | 109 (100.0%) | $106,563 |
Household Income in Rush Valley
Household Income Brackets in Rush Valley
With 35 households falling in the category, the $100,000 to $149,999 income range is the most frequent in Rush Valley, accounting for 20.8% of all households. In contrast, only 3 households (1.8%) fall into the less than $10,000 income bracket, making it the least populous group.
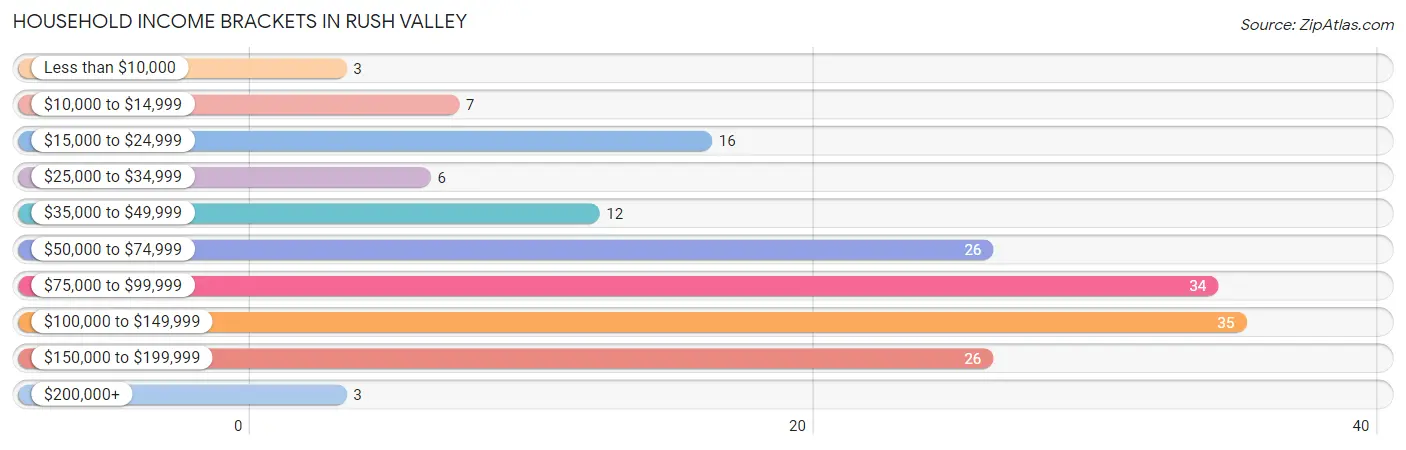
| Income Bracket | # Households | % Households |
| Less than $10,000 | 3 | 1.8% |
| $10,000 to $14,999 | 7 | 4.2% |
| $15,000 to $24,999 | 16 | 9.5% |
| $25,000 to $34,999 | 6 | 3.6% |
| $35,000 to $49,999 | 12 | 7.1% |
| $50,000 to $74,999 | 26 | 15.5% |
| $75,000 to $99,999 | 34 | 20.2% |
| $100,000 to $149,999 | 35 | 20.8% |
| $150,000 to $199,999 | 26 | 15.5% |
| $200,000+ | 3 | 1.8% |
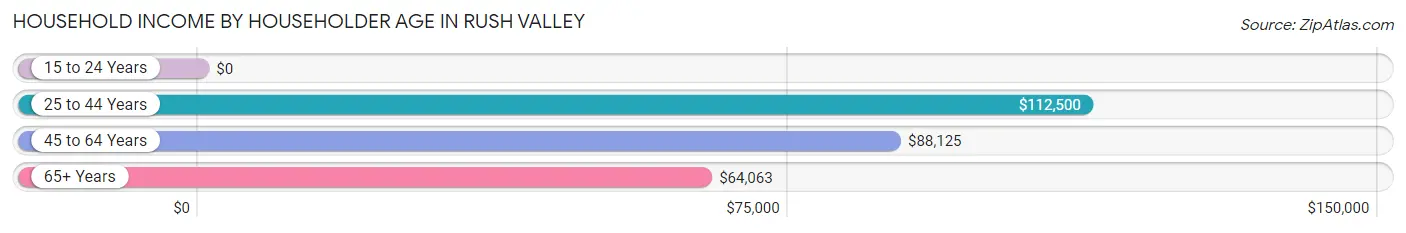
Household Income by Householder Age in Rush Valley
The median household income in Rush Valley is $82,000, with the highest median household income of $112,500 found in the 25 to 44 years age bracket for the primary householder. A total of 46 households (27.4%) fall into this category. Meanwhile, the 15 to 24 years age bracket for the primary householder has the lowest median household income of $0, with 6 households (3.6%) in this group.
| Income Bracket | # Households | Median Income |
| 15 to 24 Years | 6 (3.6%) | $0 |
| 25 to 44 Years | 46 (27.4%) | $112,500 |
| 45 to 64 Years | 53 (31.6%) | $88,125 |
| 65+ Years | 63 (37.5%) | $64,063 |
| Total | 168 (100.0%) | $82,000 |
Poverty in Rush Valley
Income Below Poverty by Sex and Age in Rush Valley
With 6.2% poverty level for males and 7.5% for females among the residents of Rush Valley, 12 to 14 year old males and under 5 year old females are the most vulnerable to poverty, with 3 males (18.8%) and 3 females (42.9%) in their respective age groups living below the poverty level.
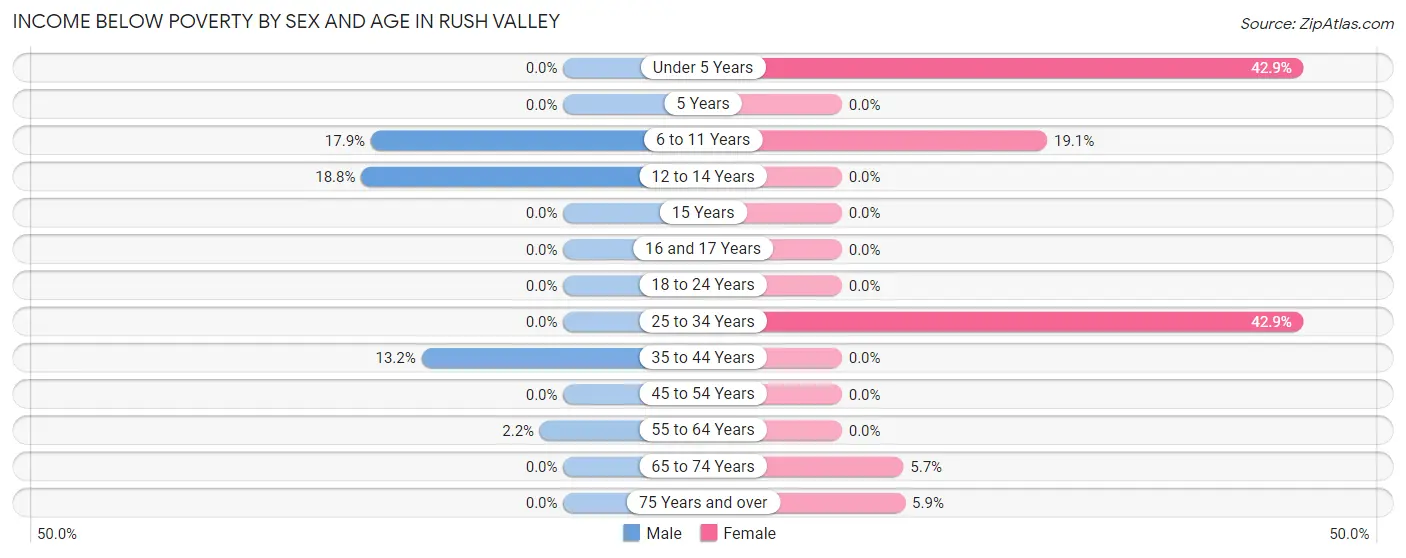
| Age Bracket | Male | Female |
| Under 5 Years | 0 (0.0%) | 3 (42.9%) |
| 5 Years | 0 (0.0%) | 0 (0.0%) |
| 6 to 11 Years | 5 (17.9%) | 4 (19.1%) |
| 12 to 14 Years | 3 (18.8%) | 0 (0.0%) |
| 15 Years | 0 (0.0%) | 0 (0.0%) |
| 16 and 17 Years | 0 (0.0%) | 0 (0.0%) |
| 18 to 24 Years | 0 (0.0%) | 0 (0.0%) |
| 25 to 34 Years | 0 (0.0%) | 6 (42.9%) |
| 35 to 44 Years | 5 (13.2%) | 0 (0.0%) |
| 45 to 54 Years | 0 (0.0%) | 0 (0.0%) |
| 55 to 64 Years | 1 (2.2%) | 0 (0.0%) |
| 65 to 74 Years | 0 (0.0%) | 2 (5.7%) |
| 75 Years and over | 0 (0.0%) | 1 (5.9%) |
| Total | 14 (6.2%) | 16 (7.5%) |
Income Above Poverty by Sex and Age in Rush Valley
According to the poverty statistics in Rush Valley, males aged under 5 years and females aged 5 years are the age groups that are most secure financially, with 100.0% of males and 100.0% of females in these age groups living above the poverty line.
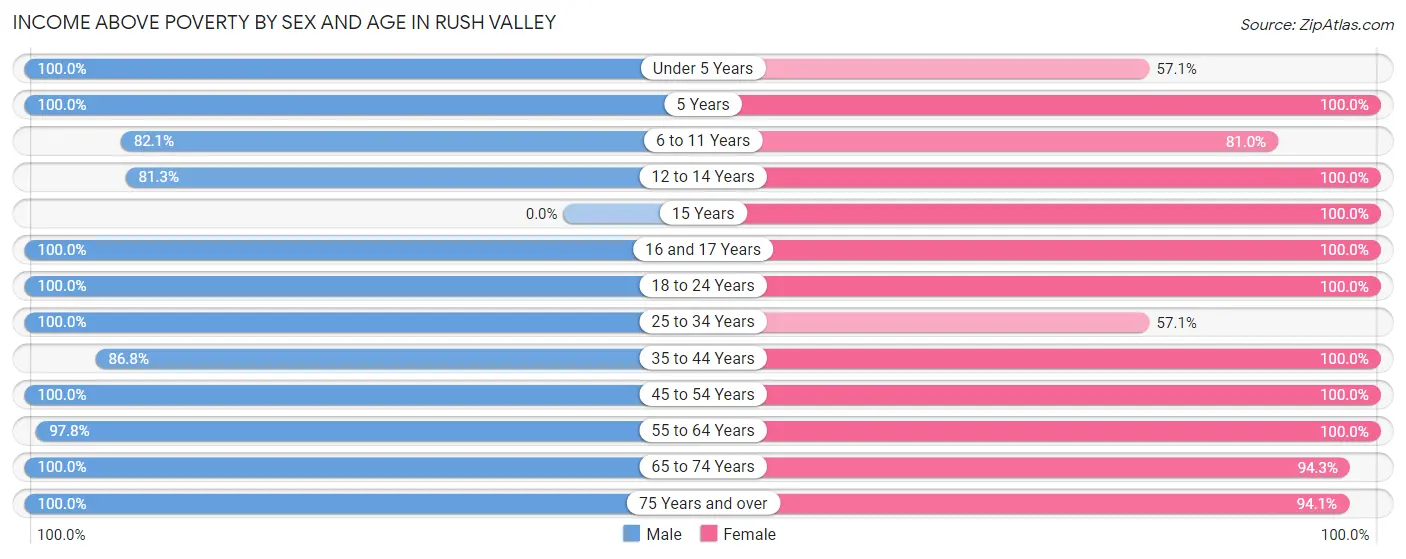
| Age Bracket | Male | Female |
| Under 5 Years | 4 (100.0%) | 4 (57.1%) |
| 5 Years | 2 (100.0%) | 2 (100.0%) |
| 6 to 11 Years | 23 (82.1%) | 17 (80.9%) |
| 12 to 14 Years | 13 (81.2%) | 10 (100.0%) |
| 15 Years | 0 (0.0%) | 3 (100.0%) |
| 16 and 17 Years | 9 (100.0%) | 7 (100.0%) |
| 18 to 24 Years | 6 (100.0%) | 24 (100.0%) |
| 25 to 34 Years | 13 (100.0%) | 8 (57.1%) |
| 35 to 44 Years | 33 (86.8%) | 23 (100.0%) |
| 45 to 54 Years | 17 (100.0%) | 23 (100.0%) |
| 55 to 64 Years | 45 (97.8%) | 27 (100.0%) |
| 65 to 74 Years | 35 (100.0%) | 33 (94.3%) |
| 75 Years and over | 10 (100.0%) | 16 (94.1%) |
| Total | 210 (93.8%) | 197 (92.5%) |
Income Below Poverty Among Married-Couple Families in Rush Valley
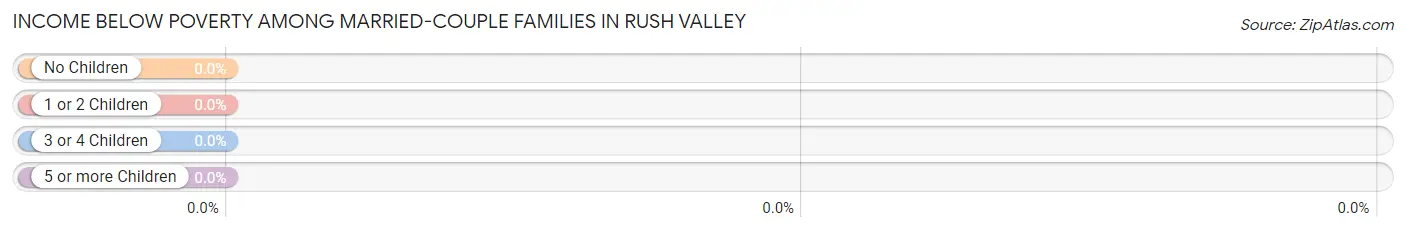
| Children | Above Poverty | Below Poverty |
| No Children | 53 (100.0%) | 0 (0.0%) |
| 1 or 2 Children | 26 (100.0%) | 0 (0.0%) |
| 3 or 4 Children | 11 (100.0%) | 0 (0.0%) |
| 5 or more Children | 4 (100.0%) | 0 (0.0%) |
| Total | 94 (100.0%) | 0 (0.0%) |
Income Below Poverty Among Single-Parent Households in Rush Valley
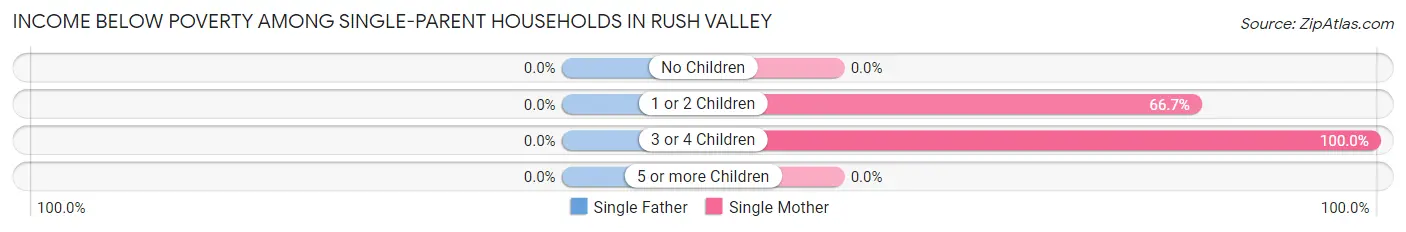
| Children | Single Father | Single Mother |
| No Children | 0 (0.0%) | 0 (0.0%) |
| 1 or 2 Children | 0 (0.0%) | 2 (66.7%) |
| 3 or 4 Children | 0 (0.0%) | 4 (100.0%) |
| 5 or more Children | 0 (0.0%) | 0 (0.0%) |
| Total | 0 (0.0%) | 6 (50.0%) |
Income Below Poverty Among Married-Couple vs Single-Parent Households in Rush Valley
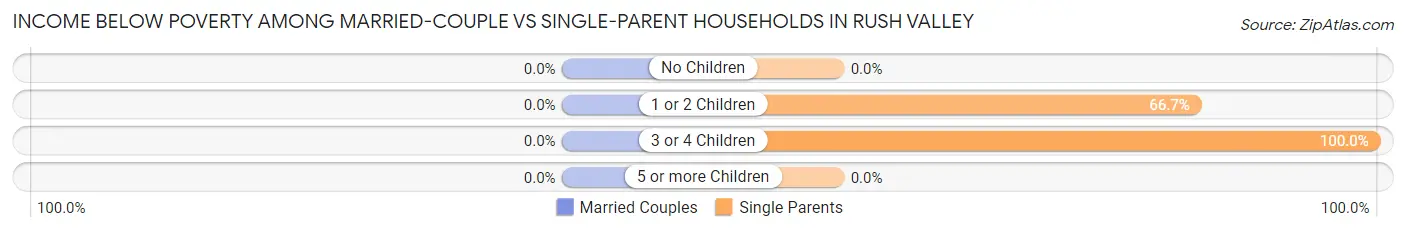
| Children | Married-Couple Families | Single-Parent Households |
| No Children | 0 (0.0%) | 0 (0.0%) |
| 1 or 2 Children | 0 (0.0%) | 2 (66.7%) |
| 3 or 4 Children | 0 (0.0%) | 4 (100.0%) |
| 5 or more Children | 0 (0.0%) | 0 (0.0%) |
| Total | 0 (0.0%) | 6 (40.0%) |
Race in Rush Valley
The most populous races in Rush Valley are White / Caucasian (409 | 93.6%), Two or more Races (14 | 3.2%), and Black / African American (6 | 1.4%).
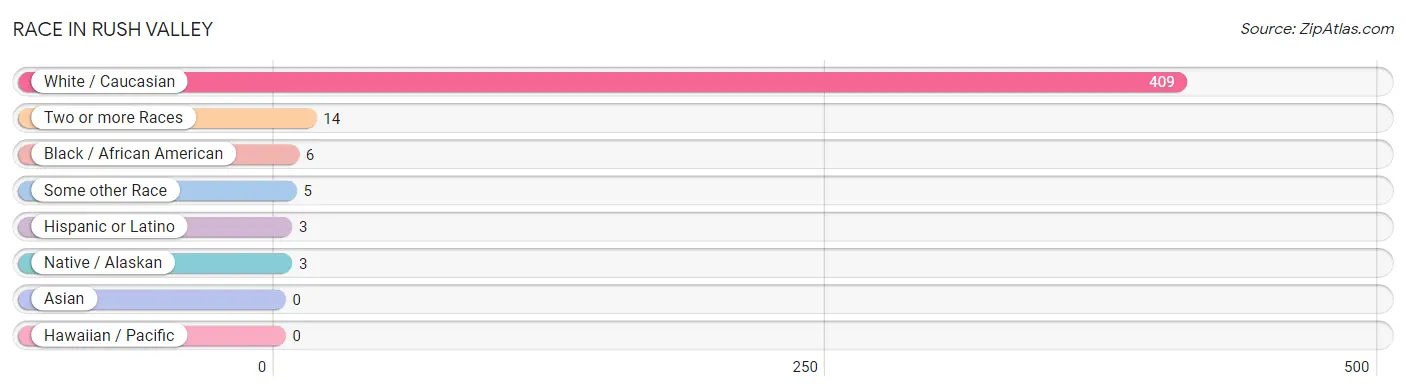
| Race | # Population | % Population |
| Asian | 0 | 0.0% |
| Black / African American | 6 | 1.4% |
| Hawaiian / Pacific | 0 | 0.0% |
| Hispanic or Latino | 3 | 0.7% |
| Native / Alaskan | 3 | 0.7% |
| White / Caucasian | 409 | 93.6% |
| Two or more Races | 14 | 3.2% |
| Some other Race | 5 | 1.1% |
| Total | 437 | 100.0% |
Ancestry in Rush Valley
The most populous ancestries reported in Rush Valley are English (120 | 27.5%), German (48 | 11.0%), Irish (46 | 10.5%), American (38 | 8.7%), and European (36 | 8.2%), together accounting for 65.9% of all Rush Valley residents.
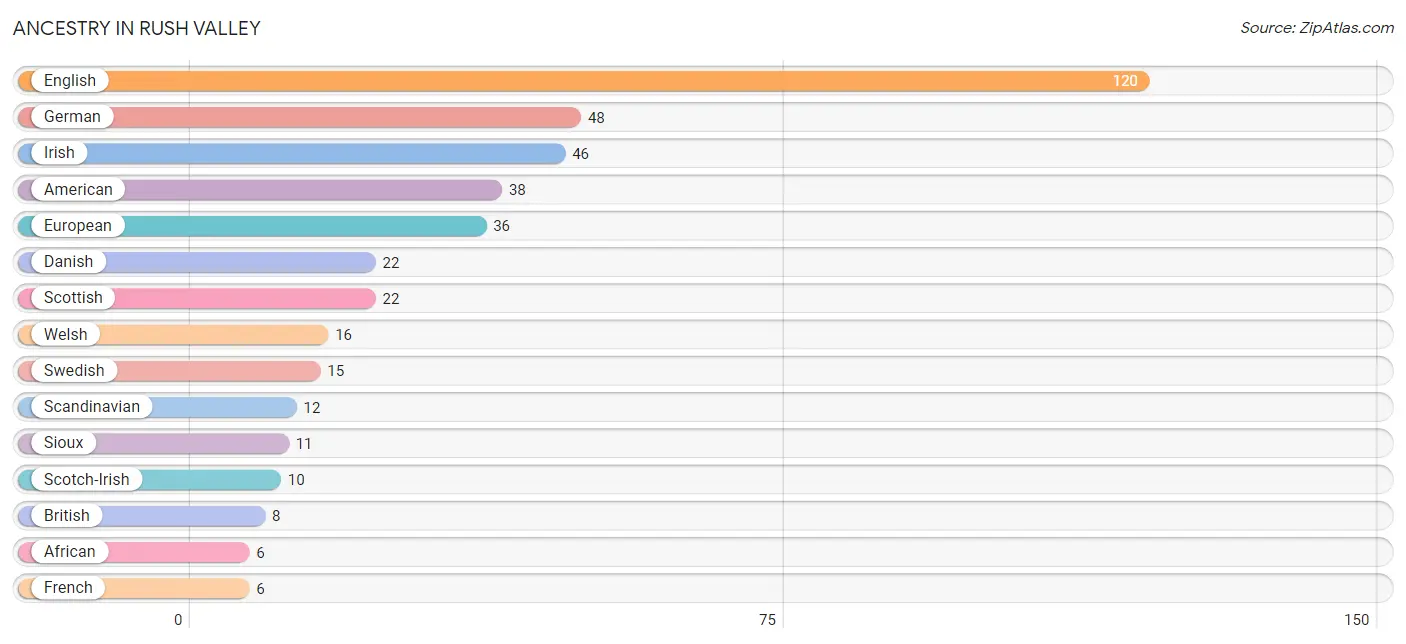
| Ancestry | # Population | % Population |
| African | 6 | 1.4% |
| American | 38 | 8.7% |
| Belgian | 1 | 0.2% |
| British | 8 | 1.8% |
| Danish | 22 | 5.0% |
| English | 120 | 27.5% |
| European | 36 | 8.2% |
| French | 6 | 1.4% |
| German | 48 | 11.0% |
| Irish | 46 | 10.5% |
| Italian | 6 | 1.4% |
| Mexican | 3 | 0.7% |
| Norwegian | 6 | 1.4% |
| Polish | 2 | 0.5% |
| Scandinavian | 12 | 2.8% |
| Scotch-Irish | 10 | 2.3% |
| Scottish | 22 | 5.0% |
| Sioux | 11 | 2.5% |
| Subsaharan African | 6 | 1.4% |
| Swedish | 15 | 3.4% |
| Swiss | 3 | 0.7% |
| Welsh | 16 | 3.7% |
| Yaqui | 1 | 0.2% |
| Yugoslavian | 4 | 0.9% | View All 24 Rows |
Immigrants in Rush Valley
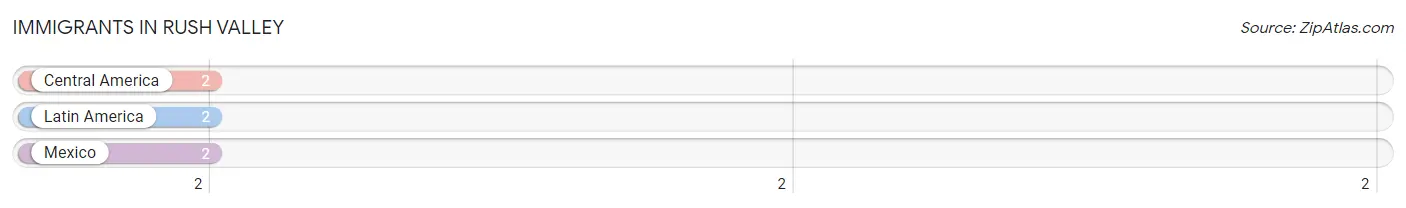
The most numerous immigrant groups reported in Rush Valley came from Central America (2 | 0.5%), Latin America (2 | 0.5%), and Mexico (2 | 0.5%), together accounting for 1.4% of all Rush Valley residents.
| Immigration Origin | # Population | % Population |
| Central America | 2 | 0.5% |
| Latin America | 2 | 0.5% |
| Mexico | 2 | 0.5% | View All 3 Rows |
Sex and Age in Rush Valley
Sex and Age in Rush Valley
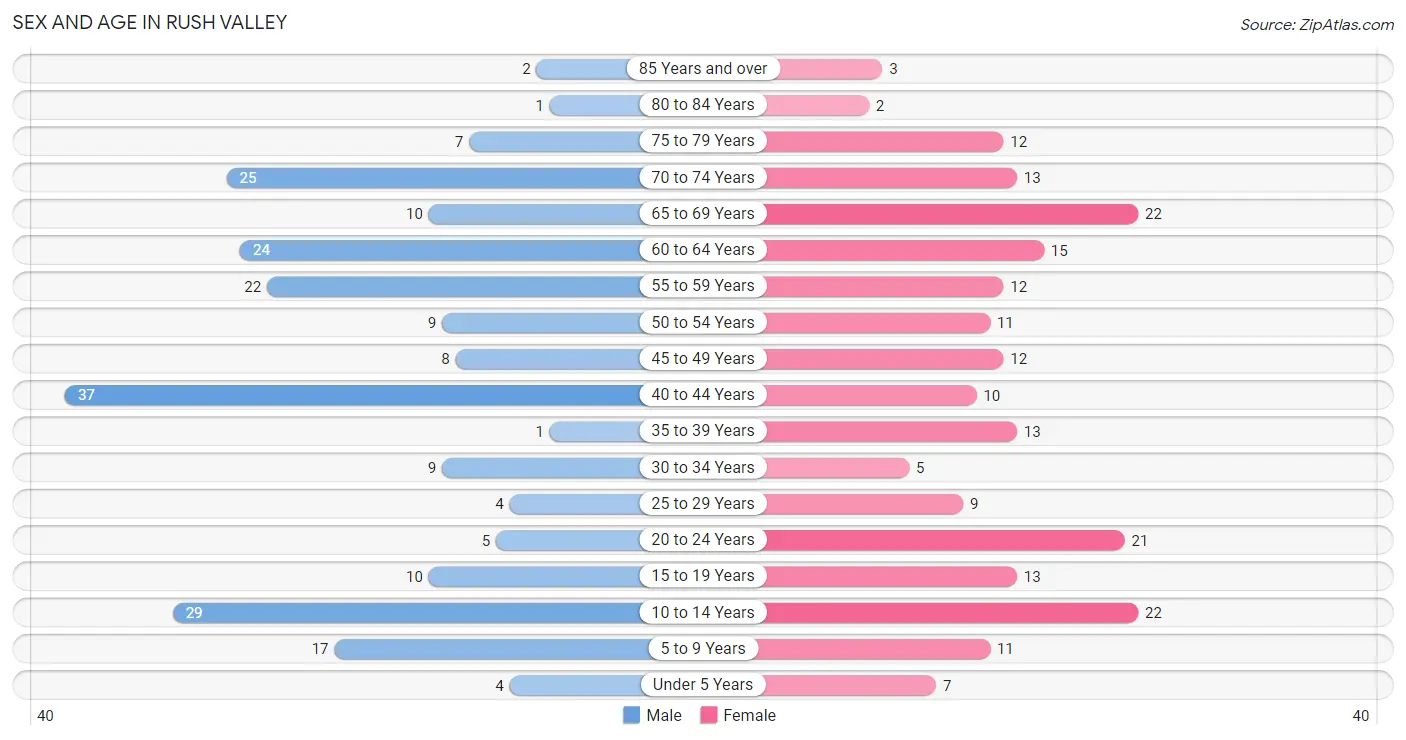
The most populous age groups in Rush Valley are 40 to 44 Years (37 | 16.5%) for men and 10 to 14 Years (22 | 10.3%) for women.
| Age Bracket | Male | Female |
| Under 5 Years | 4 (1.8%) | 7 (3.3%) |
| 5 to 9 Years | 17 (7.6%) | 11 (5.2%) |
| 10 to 14 Years | 29 (13.0%) | 22 (10.3%) |
| 15 to 19 Years | 10 (4.5%) | 13 (6.1%) |
| 20 to 24 Years | 5 (2.2%) | 21 (9.9%) |
| 25 to 29 Years | 4 (1.8%) | 9 (4.2%) |
| 30 to 34 Years | 9 (4.0%) | 5 (2.4%) |
| 35 to 39 Years | 1 (0.4%) | 13 (6.1%) |
| 40 to 44 Years | 37 (16.5%) | 10 (4.7%) |
| 45 to 49 Years | 8 (3.6%) | 12 (5.6%) |
| 50 to 54 Years | 9 (4.0%) | 11 (5.2%) |
| 55 to 59 Years | 22 (9.8%) | 12 (5.6%) |
| 60 to 64 Years | 24 (10.7%) | 15 (7.0%) |
| 65 to 69 Years | 10 (4.5%) | 22 (10.3%) |
| 70 to 74 Years | 25 (11.2%) | 13 (6.1%) |
| 75 to 79 Years | 7 (3.1%) | 12 (5.6%) |
| 80 to 84 Years | 1 (0.4%) | 2 (0.9%) |
| 85 Years and over | 2 (0.9%) | 3 (1.4%) |
| Total | 224 (100.0%) | 213 (100.0%) |
Families and Households in Rush Valley
Median Family Size in Rush Valley
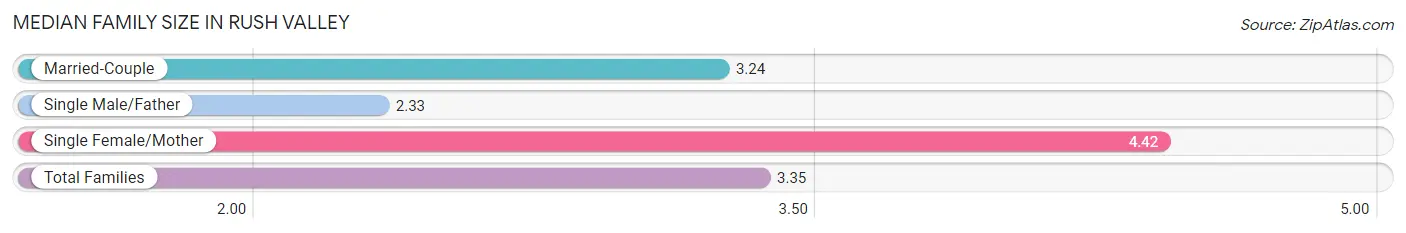
The median family size in Rush Valley is 3.35 persons per family, with single female/mother families (12 | 11.0%) accounting for the largest median family size of 4.42 persons per family. On the other hand, single male/father families (3 | 2.8%) represent the smallest median family size with 2.33 persons per family.
| Family Type | # Families | Family Size |
| Married-Couple | 94 (86.2%) | 3.24 |
| Single Male/Father | 3 (2.8%) | 2.33 |
| Single Female/Mother | 12 (11.0%) | 4.42 |
| Total Families | 109 (100.0%) | 3.35 |
Median Household Size in Rush Valley
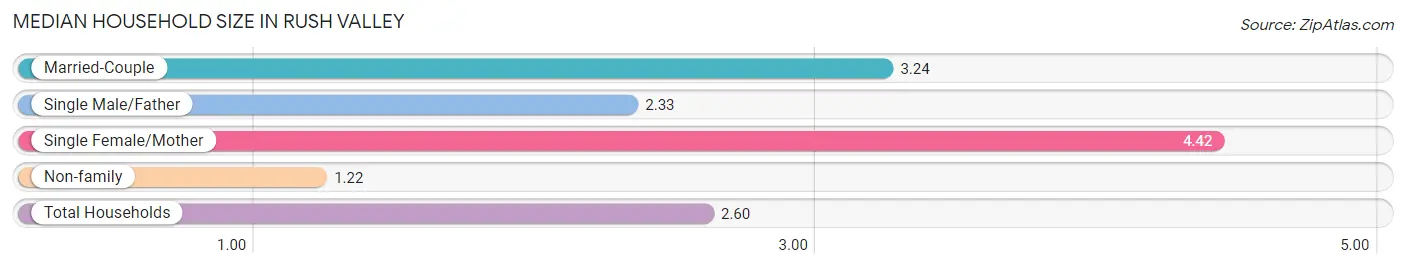
The median household size in Rush Valley is 2.60 persons per household, with single female/mother households (12 | 7.1%) accounting for the largest median household size of 4.42 persons per household. non-family households (59 | 35.1%) represent the smallest median household size with 1.22 persons per household.
| Household Type | # Households | Household Size |
| Married-Couple | 94 (55.9%) | 3.24 |
| Single Male/Father | 3 (1.8%) | 2.33 |
| Single Female/Mother | 12 (7.1%) | 4.42 |
| Non-family | 59 (35.1%) | 1.22 |
| Total Households | 168 (100.0%) | 2.60 |
Household Size by Marriage Status in Rush Valley
Out of a total of 168 households in Rush Valley, 109 (64.9%) are family households, while 59 (35.1%) are nonfamily households. The most numerous type of family households are 2-person households, comprising 49, and the most common type of nonfamily households are 1-person households, comprising 48.
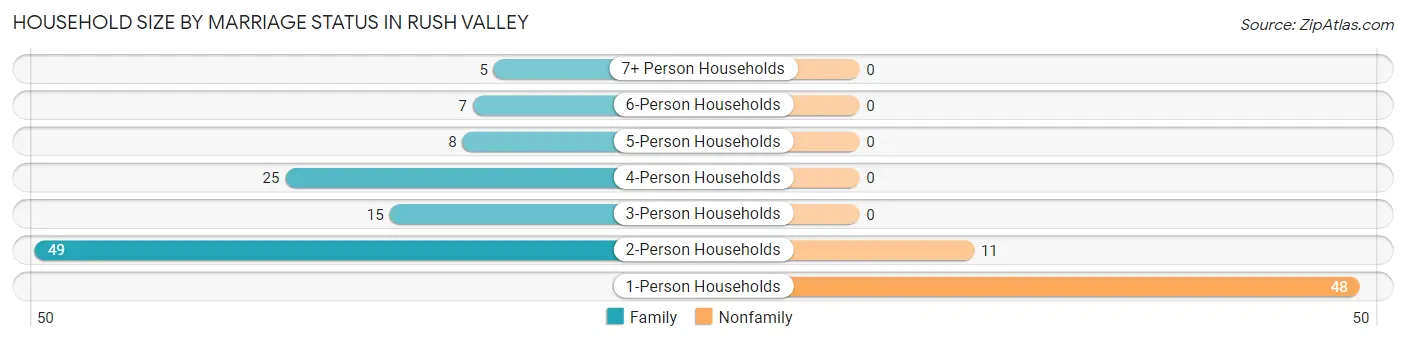
| Household Size | Family Households | Nonfamily Households |
| 1-Person Households | - | 48 (28.6%) |
| 2-Person Households | 49 (29.2%) | 11 (6.6%) |
| 3-Person Households | 15 (8.9%) | 0 (0.0%) |
| 4-Person Households | 25 (14.9%) | 0 (0.0%) |
| 5-Person Households | 8 (4.8%) | 0 (0.0%) |
| 6-Person Households | 7 (4.2%) | 0 (0.0%) |
| 7+ Person Households | 5 (3.0%) | 0 (0.0%) |
| Total | 109 (64.9%) | 59 (35.1%) |
Female Fertility in Rush Valley
Fertility by Age in Rush Valley
Average fertility rate in Rush Valley is 12.0 births per 1,000 women. Women in the age bracket of 35 to 50 years have the highest fertility rate with 28.0 births per 1,000 women. Women in the age bracket of 35 to 50 years acount for 100.0% of all women with births.
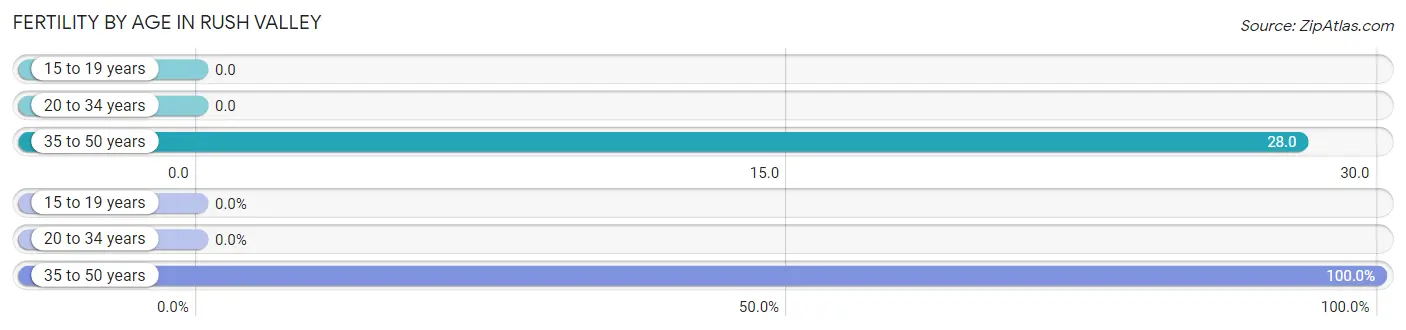
| Age Bracket | Women with Births | Births / 1,000 Women |
| 15 to 19 years | 0 (0.0%) | 0.0 |
| 20 to 34 years | 0 (0.0%) | 0.0 |
| 35 to 50 years | 1 (100.0%) | 28.0 |
| Total | 1 (100.0%) | 12.0 |
Fertility by Age by Marriage Status in Rush Valley
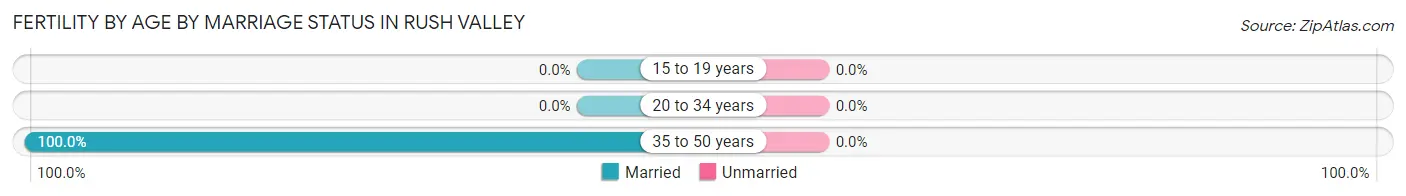
| Age Bracket | Married | Unmarried |
| 15 to 19 years | 0 (0.0%) | 0 (0.0%) |
| 20 to 34 years | 0 (0.0%) | 0 (0.0%) |
| 35 to 50 years | 1 (100.0%) | 0 (0.0%) |
| Total | 1 (100.0%) | 0 (0.0%) |
Fertility by Education in Rush Valley
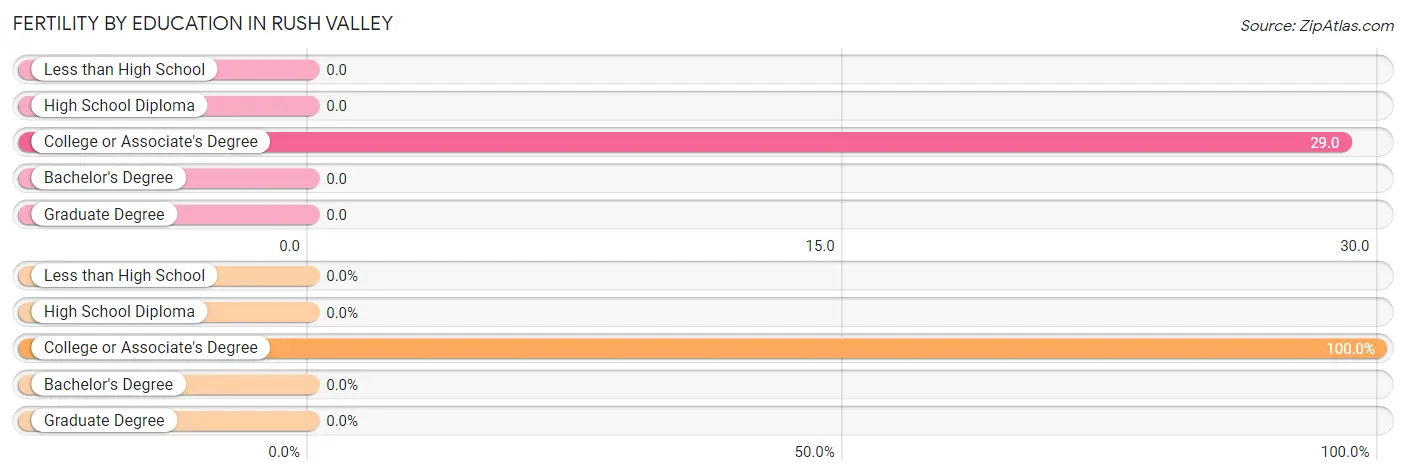
| Educational Attainment | Women with Births | Births / 1,000 Women |
| Less than High School | 0 (0.0%) | 0.0 |
| High School Diploma | 0 (0.0%) | 0.0 |
| College or Associate's Degree | 1 (100.0%) | 29.0 |
| Bachelor's Degree | 0 (0.0%) | 0.0 |
| Graduate Degree | 0 (0.0%) | 0.0 |
| Total | 1 (100.0%) | 12.0 |
Fertility by Education by Marriage Status in Rush Valley
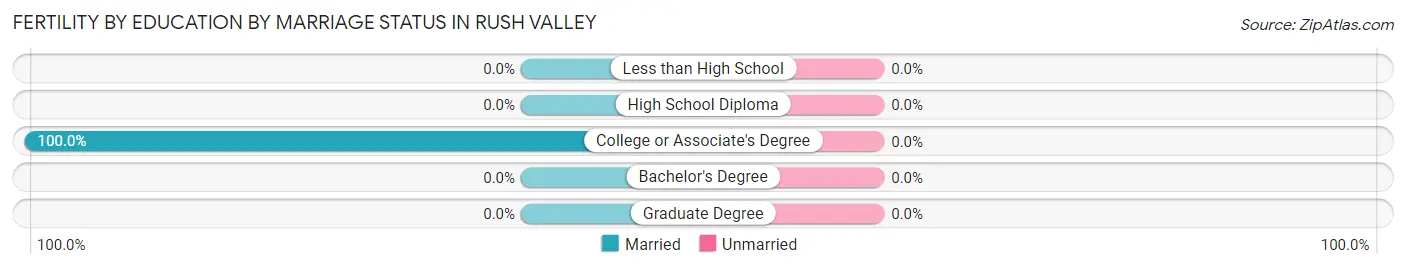
| Educational Attainment | Married | Unmarried |
| Less than High School | 0 (0.0%) | 0 (0.0%) |
| High School Diploma | 0 (0.0%) | 0 (0.0%) |
| College or Associate's Degree | 1 (100.0%) | 0 (0.0%) |
| Bachelor's Degree | 0 (0.0%) | 0 (0.0%) |
| Graduate Degree | 0 (0.0%) | 0 (0.0%) |
| Total | 1 (100.0%) | 0 (0.0%) |
Employment Characteristics in Rush Valley
Employment by Class of Employer in Rush Valley
Among the 180 employed individuals in Rush Valley, private company employees (130 | 72.2%), federal government employees (18 | 10.0%), and self-employed (not incorporated) (16 | 8.9%) make up the most common classes of employment.
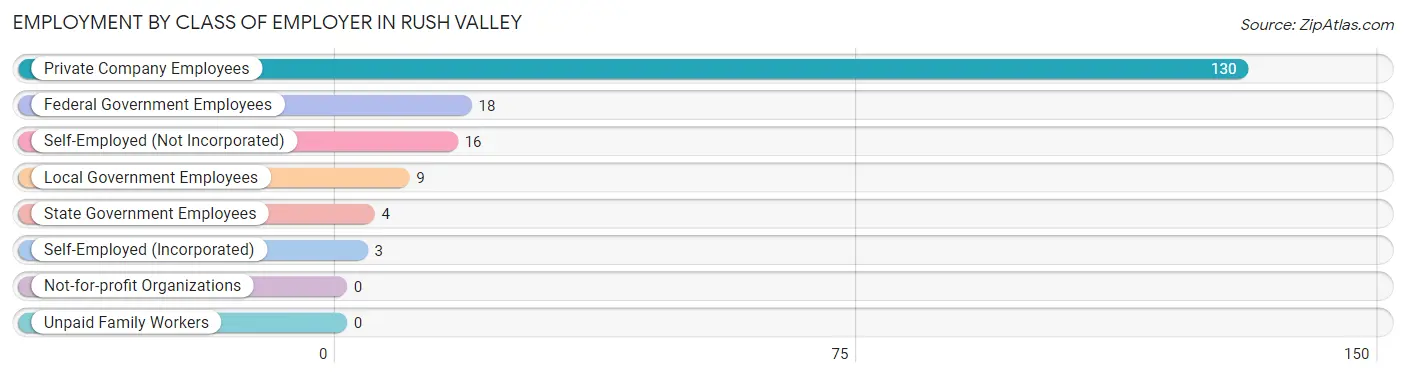
| Employer Class | # Employees | % Employees |
| Private Company Employees | 130 | 72.2% |
| Self-Employed (Incorporated) | 3 | 1.7% |
| Self-Employed (Not Incorporated) | 16 | 8.9% |
| Not-for-profit Organizations | 0 | 0.0% |
| Local Government Employees | 9 | 5.0% |
| State Government Employees | 4 | 2.2% |
| Federal Government Employees | 18 | 10.0% |
| Unpaid Family Workers | 0 | 0.0% |
| Total | 180 | 100.0% |
Employment Status by Age in Rush Valley
According to the labor force statistics for Rush Valley, out of the total population over 16 years of age (344), 53.8% or 185 individuals are in the labor force, with 1.6% or 3 of them unemployed. The age group with the highest labor force participation rate is 25 to 29 years, with 100.0% or 13 individuals in the labor force. Within the labor force, the 16 to 19 years age range has the highest percentage of unemployed individuals, with 100.0% or 1 of them being unemployed.
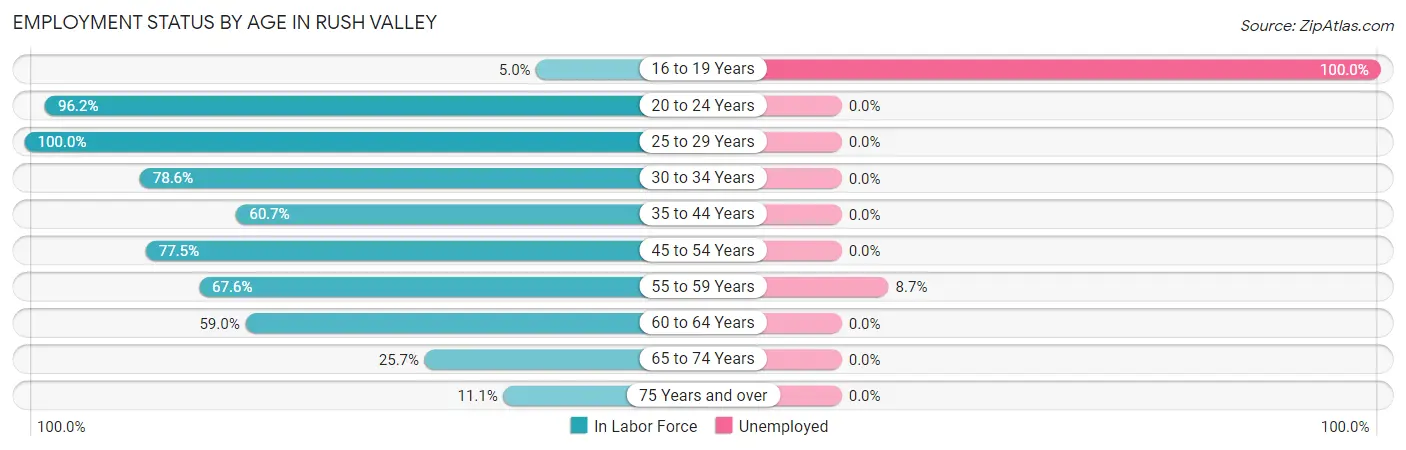
| Age Bracket | In Labor Force | Unemployed |
| 16 to 19 Years | 1 (5.0%) | 1 (100.0%) |
| 20 to 24 Years | 25 (96.2%) | 0 (0.0%) |
| 25 to 29 Years | 13 (100.0%) | 0 (0.0%) |
| 30 to 34 Years | 11 (78.6%) | 0 (0.0%) |
| 35 to 44 Years | 37 (60.7%) | 0 (0.0%) |
| 45 to 54 Years | 31 (77.5%) | 0 (0.0%) |
| 55 to 59 Years | 23 (67.6%) | 2 (8.7%) |
| 60 to 64 Years | 23 (59.0%) | 0 (0.0%) |
| 65 to 74 Years | 18 (25.7%) | 0 (0.0%) |
| 75 Years and over | 3 (11.1%) | 0 (0.0%) |
| Total | 185 (53.8%) | 3 (1.6%) |
Employment Status by Educational Attainment in Rush Valley
According to labor force statistics for Rush Valley, 68.7% of individuals (138) out of the total population between 25 and 64 years of age (201) are in the labor force, with 1.4% or 2 of them being unemployed. The group with the highest labor force participation rate are those with the educational attainment of less than high school, with 80.0% or 4 individuals in the labor force. Within the labor force, individuals with bachelor's degree or higher education have the highest percentage of unemployment, with 8.7% or 2 of them being unemployed.
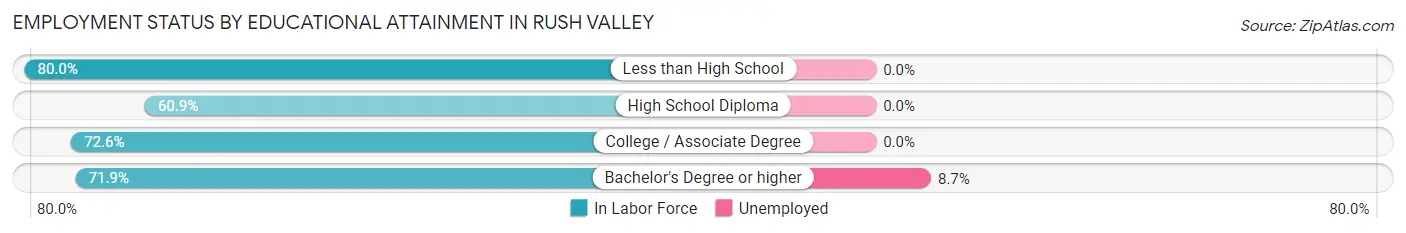
| Educational Attainment | In Labor Force | Unemployed |
| Less than High School | 4 (80.0%) | 0 (0.0%) |
| High School Diploma | 42 (60.9%) | 0 (0.0%) |
| College / Associate Degree | 69 (72.6%) | 0 (0.0%) |
| Bachelor's Degree or higher | 23 (71.9%) | 3 (8.7%) |
| Total | 138 (68.7%) | 3 (1.4%) |
Employment Occupations by Sex in Rush Valley
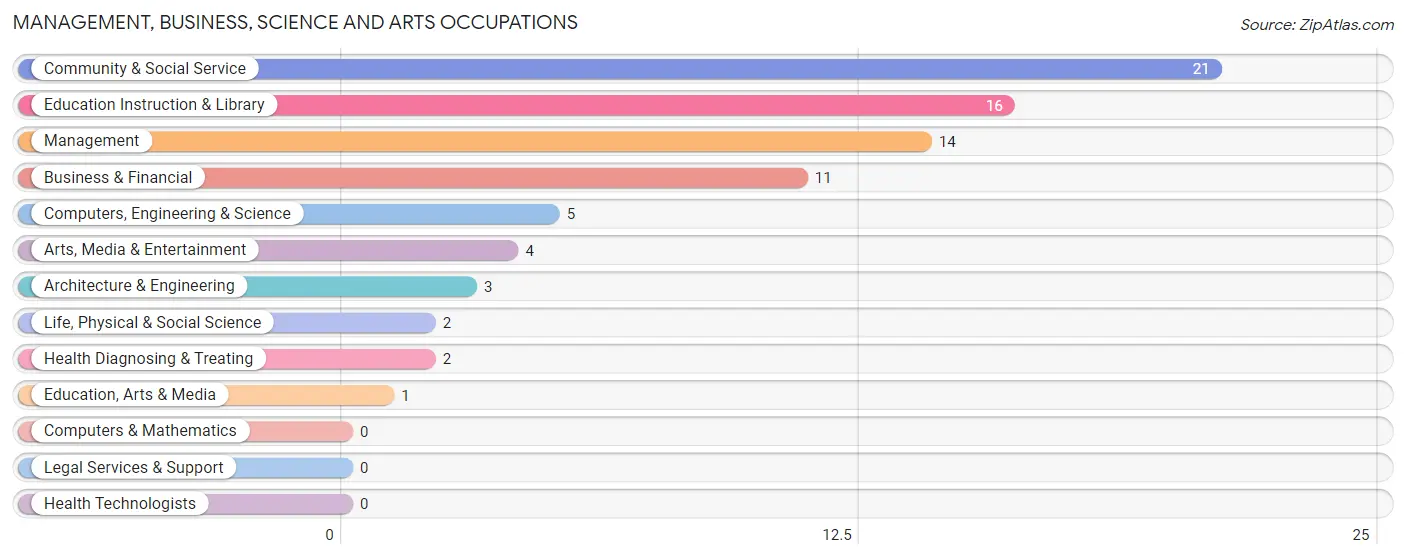
Management, Business, Science and Arts Occupations
The most common Management, Business, Science and Arts occupations in Rush Valley are Community & Social Service (21 | 11.5%), Education Instruction & Library (16 | 8.8%), Management (14 | 7.7%), Business & Financial (11 | 6.0%), and Computers, Engineering & Science (5 | 2.8%).
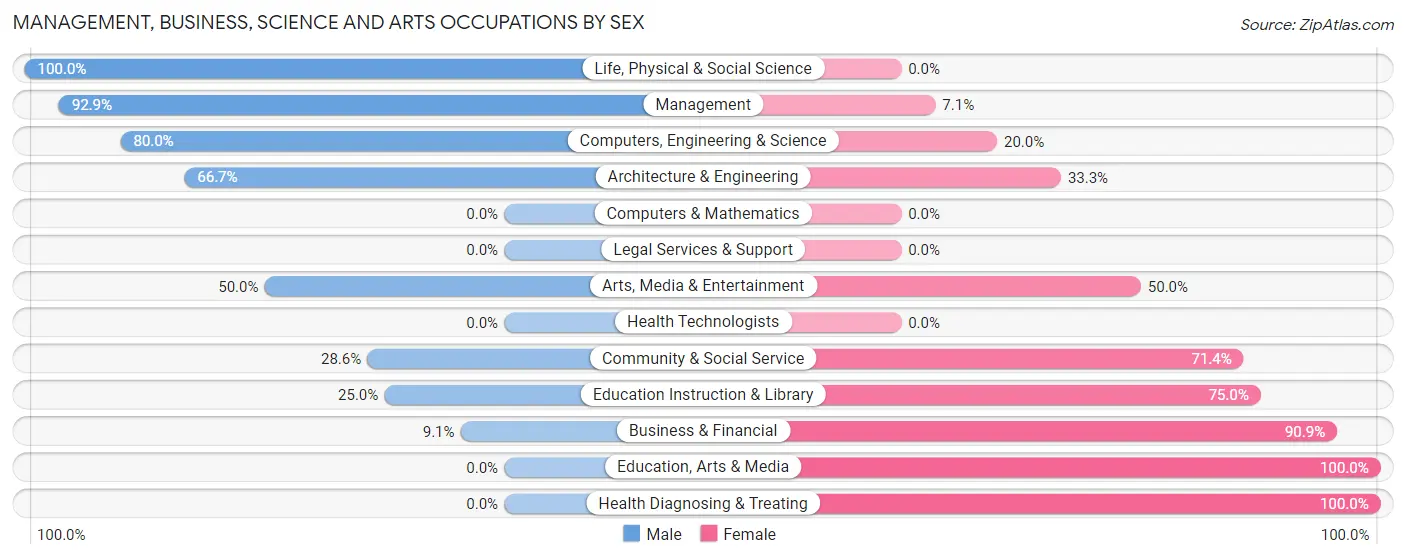
Management, Business, Science and Arts Occupations by Sex
Within the Management, Business, Science and Arts occupations in Rush Valley, the most male-oriented occupations are Life, Physical & Social Science (100.0%), Management (92.9%), and Computers, Engineering & Science (80.0%), while the most female-oriented occupations are Education, Arts & Media (100.0%), Health Diagnosing & Treating (100.0%), and Business & Financial (90.9%).
| Occupation | Male | Female |
| Management | 13 (92.9%) | 1 (7.1%) |
| Business & Financial | 1 (9.1%) | 10 (90.9%) |
| Computers, Engineering & Science | 4 (80.0%) | 1 (20.0%) |
| Computers & Mathematics | 0 (0.0%) | 0 (0.0%) |
| Architecture & Engineering | 2 (66.7%) | 1 (33.3%) |
| Life, Physical & Social Science | 2 (100.0%) | 0 (0.0%) |
| Community & Social Service | 6 (28.6%) | 15 (71.4%) |
| Education, Arts & Media | 0 (0.0%) | 1 (100.0%) |
| Legal Services & Support | 0 (0.0%) | 0 (0.0%) |
| Education Instruction & Library | 4 (25.0%) | 12 (75.0%) |
| Arts, Media & Entertainment | 2 (50.0%) | 2 (50.0%) |
| Health Diagnosing & Treating | 0 (0.0%) | 2 (100.0%) |
| Health Technologists | 0 (0.0%) | 0 (0.0%) |
| Total (Category) | 24 (45.3%) | 29 (54.7%) |
| Total (Overall) | 100 (54.9%) | 82 (45.1%) |
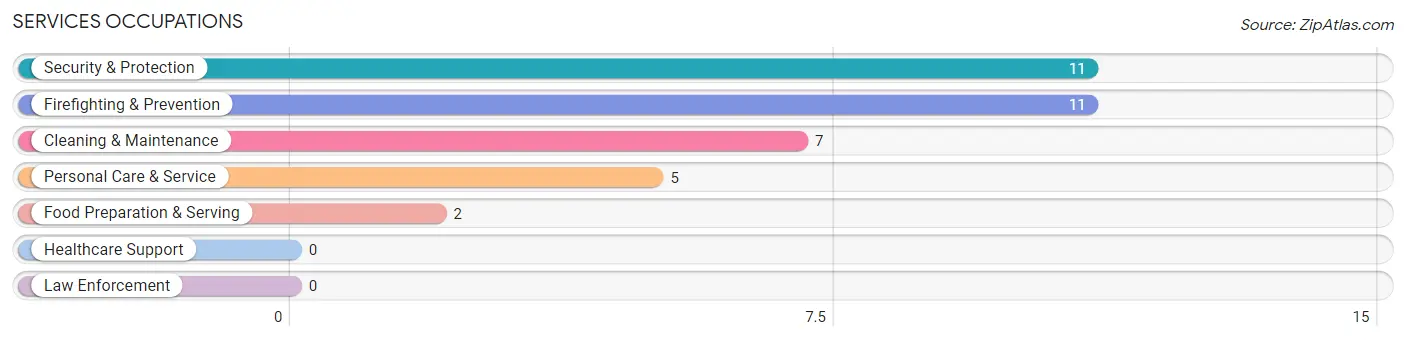
Services Occupations
The most common Services occupations in Rush Valley are Security & Protection (11 | 6.0%), Firefighting & Prevention (11 | 6.0%), Cleaning & Maintenance (7 | 3.8%), Personal Care & Service (5 | 2.8%), and Food Preparation & Serving (2 | 1.1%).
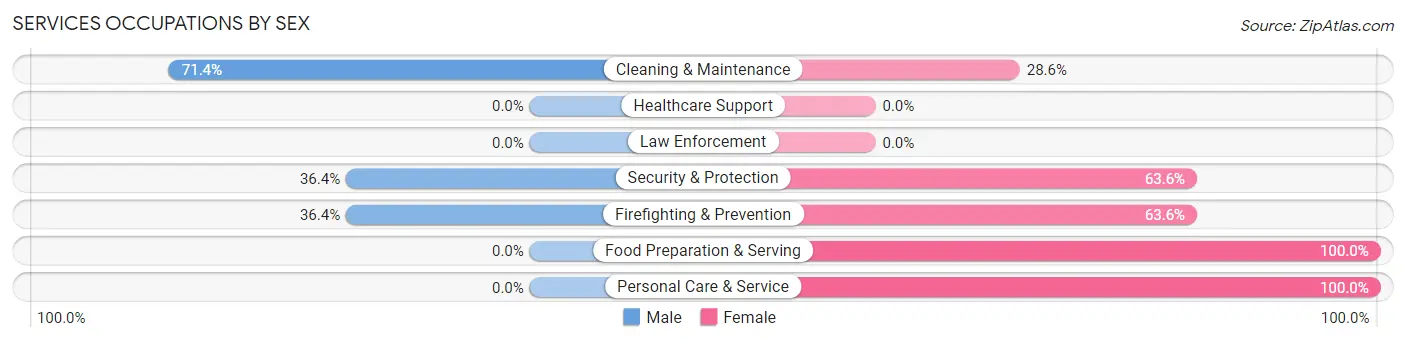
Services Occupations by Sex
Within the Services occupations in Rush Valley, the most male-oriented occupations are Cleaning & Maintenance (71.4%), Security & Protection (36.4%), and Firefighting & Prevention (36.4%), while the most female-oriented occupations are Food Preparation & Serving (100.0%), Personal Care & Service (100.0%), and Security & Protection (63.6%).
| Occupation | Male | Female |
| Healthcare Support | 0 (0.0%) | 0 (0.0%) |
| Security & Protection | 4 (36.4%) | 7 (63.6%) |
| Firefighting & Prevention | 4 (36.4%) | 7 (63.6%) |
| Law Enforcement | 0 (0.0%) | 0 (0.0%) |
| Food Preparation & Serving | 0 (0.0%) | 2 (100.0%) |
| Cleaning & Maintenance | 5 (71.4%) | 2 (28.6%) |
| Personal Care & Service | 0 (0.0%) | 5 (100.0%) |
| Total (Category) | 9 (36.0%) | 16 (64.0%) |
| Total (Overall) | 100 (54.9%) | 82 (45.1%) |
Sales and Office Occupations
The most common Sales and Office occupations in Rush Valley are Office & Administration (30 | 16.5%), and Sales & Related (15 | 8.2%).
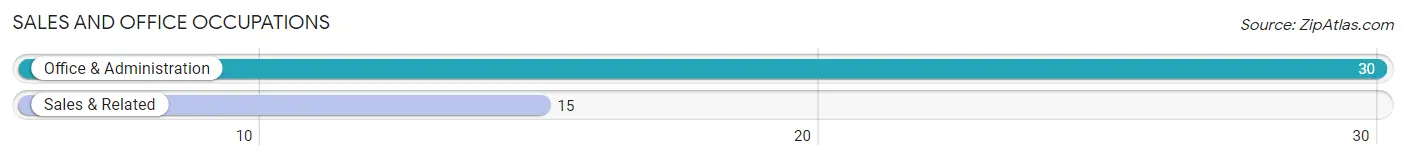
Sales and Office Occupations by Sex
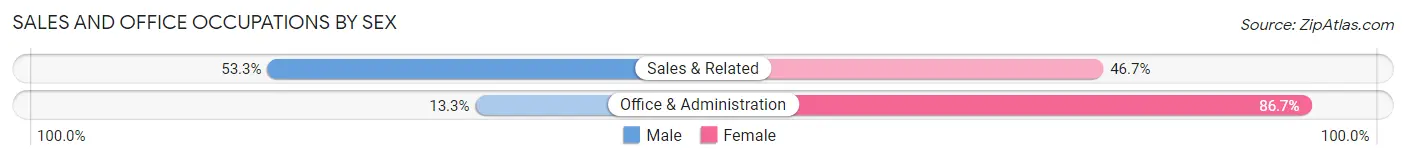
| Occupation | Male | Female |
| Sales & Related | 8 (53.3%) | 7 (46.7%) |
| Office & Administration | 4 (13.3%) | 26 (86.7%) |
| Total (Category) | 12 (26.7%) | 33 (73.3%) |
| Total (Overall) | 100 (54.9%) | 82 (45.1%) |
Natural Resources, Construction and Maintenance Occupations
The most common Natural Resources, Construction and Maintenance occupations in Rush Valley are Construction & Extraction (22 | 12.1%), Installation, Maintenance & Repair (15 | 8.2%), and Farming, Fishing & Forestry (2 | 1.1%).
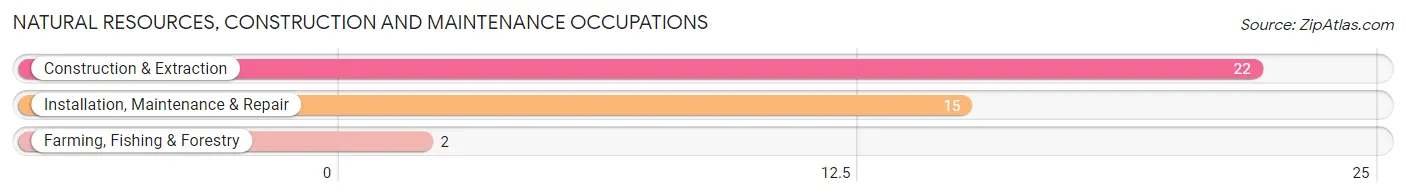
Natural Resources, Construction and Maintenance Occupations by Sex
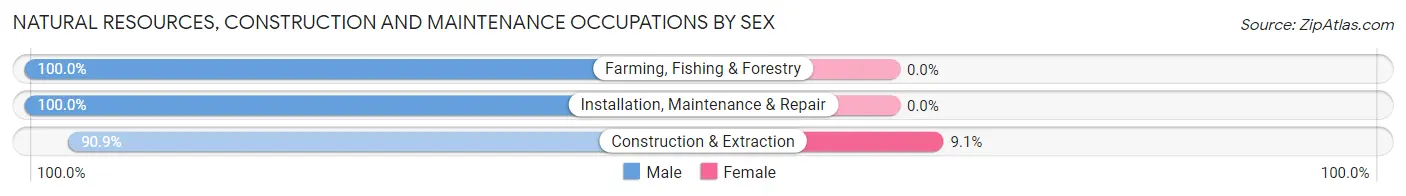
| Occupation | Male | Female |
| Farming, Fishing & Forestry | 2 (100.0%) | 0 (0.0%) |
| Construction & Extraction | 20 (90.9%) | 2 (9.1%) |
| Installation, Maintenance & Repair | 15 (100.0%) | 0 (0.0%) |
| Total (Category) | 37 (94.9%) | 2 (5.1%) |
| Total (Overall) | 100 (54.9%) | 82 (45.1%) |
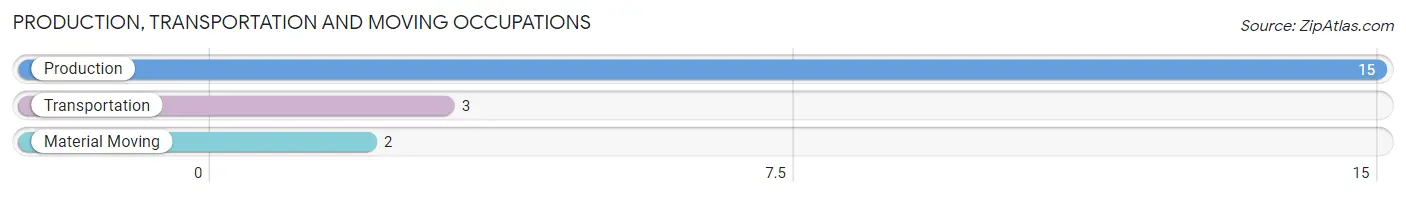
Production, Transportation and Moving Occupations
The most common Production, Transportation and Moving occupations in Rush Valley are Production (15 | 8.2%), Transportation (3 | 1.7%), and Material Moving (2 | 1.1%).
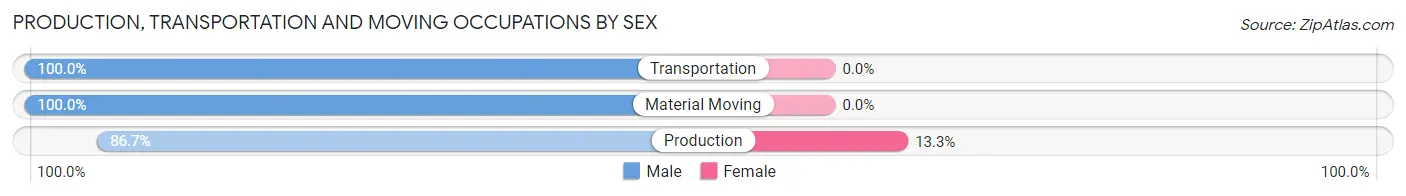
Production, Transportation and Moving Occupations by Sex
| Occupation | Male | Female |
| Production | 13 (86.7%) | 2 (13.3%) |
| Transportation | 3 (100.0%) | 0 (0.0%) |
| Material Moving | 2 (100.0%) | 0 (0.0%) |
| Total (Category) | 18 (90.0%) | 2 (10.0%) |
| Total (Overall) | 100 (54.9%) | 82 (45.1%) |
Employment Industries by Sex in Rush Valley
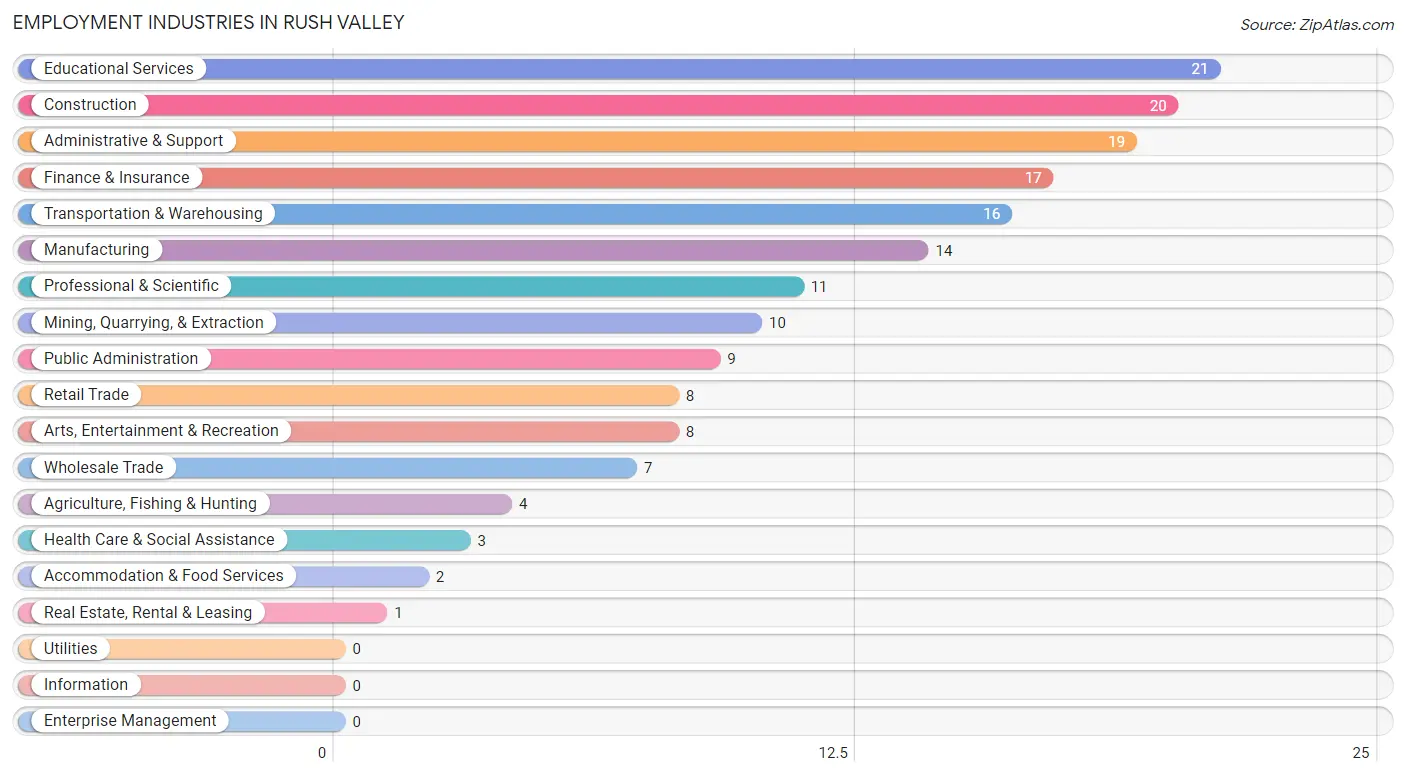
Employment Industries in Rush Valley
The major employment industries in Rush Valley include Educational Services (21 | 11.5%), Construction (20 | 11.0%), Administrative & Support (19 | 10.4%), Finance & Insurance (17 | 9.3%), and Transportation & Warehousing (16 | 8.8%).
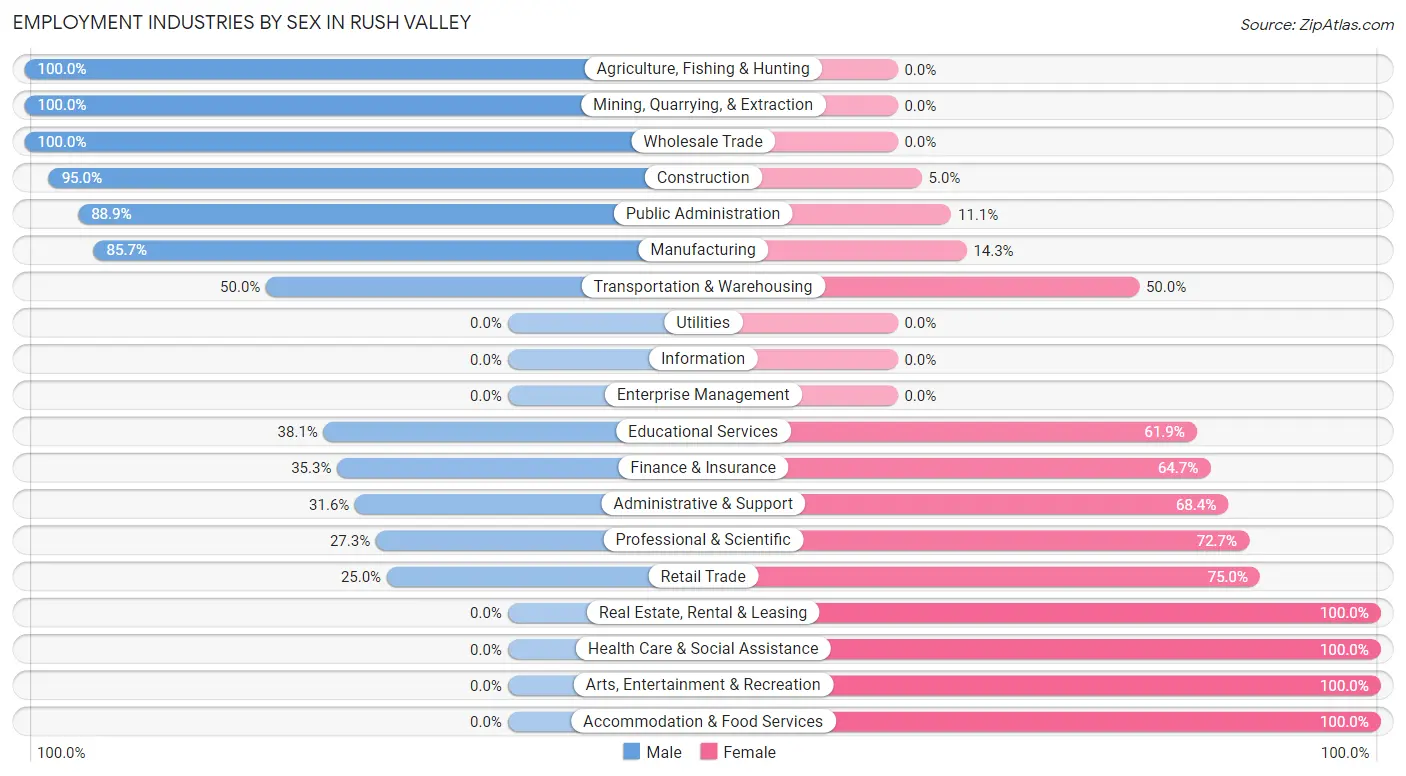
Employment Industries by Sex in Rush Valley
The Rush Valley industries that see more men than women are Agriculture, Fishing & Hunting (100.0%), Mining, Quarrying, & Extraction (100.0%), and Wholesale Trade (100.0%), whereas the industries that tend to have a higher number of women are Real Estate, Rental & Leasing (100.0%), Health Care & Social Assistance (100.0%), and Arts, Entertainment & Recreation (100.0%).
| Industry | Male | Female |
| Agriculture, Fishing & Hunting | 4 (100.0%) | 0 (0.0%) |
| Mining, Quarrying, & Extraction | 10 (100.0%) | 0 (0.0%) |
| Construction | 19 (95.0%) | 1 (5.0%) |
| Manufacturing | 12 (85.7%) | 2 (14.3%) |
| Wholesale Trade | 7 (100.0%) | 0 (0.0%) |
| Retail Trade | 2 (25.0%) | 6 (75.0%) |
| Transportation & Warehousing | 8 (50.0%) | 8 (50.0%) |
| Utilities | 0 (0.0%) | 0 (0.0%) |
| Information | 0 (0.0%) | 0 (0.0%) |
| Finance & Insurance | 6 (35.3%) | 11 (64.7%) |
| Real Estate, Rental & Leasing | 0 (0.0%) | 1 (100.0%) |
| Professional & Scientific | 3 (27.3%) | 8 (72.7%) |
| Enterprise Management | 0 (0.0%) | 0 (0.0%) |
| Administrative & Support | 6 (31.6%) | 13 (68.4%) |
| Educational Services | 8 (38.1%) | 13 (61.9%) |
| Health Care & Social Assistance | 0 (0.0%) | 3 (100.0%) |
| Arts, Entertainment & Recreation | 0 (0.0%) | 8 (100.0%) |
| Accommodation & Food Services | 0 (0.0%) | 2 (100.0%) |
| Public Administration | 8 (88.9%) | 1 (11.1%) |
| Total | 100 (54.9%) | 82 (45.1%) |
Education in Rush Valley
School Enrollment in Rush Valley
The most common levels of schooling among the 114 students in Rush Valley are middle school (41 | 36.0%), elementary school (25 | 21.9%), and high school (24 | 21.0%).
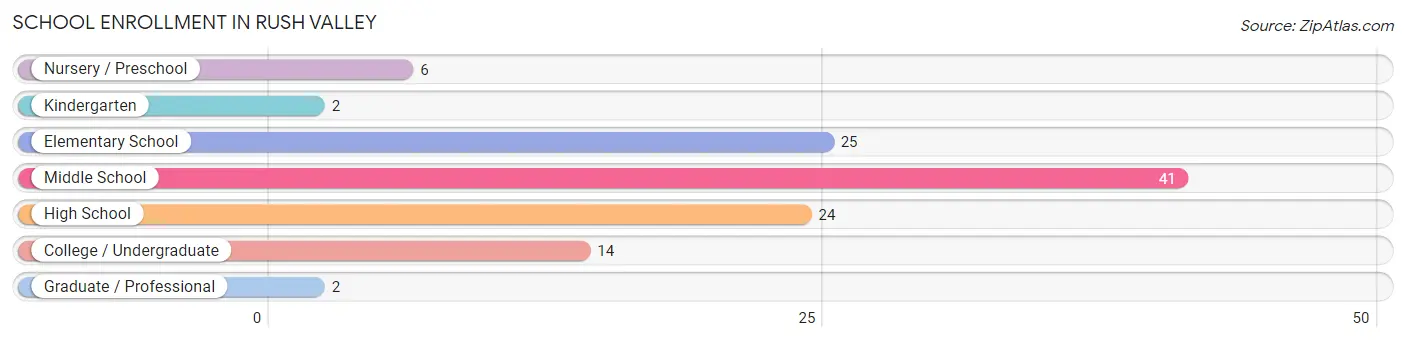
| School Level | # Students | % Students |
| Nursery / Preschool | 6 | 5.3% |
| Kindergarten | 2 | 1.8% |
| Elementary School | 25 | 21.9% |
| Middle School | 41 | 36.0% |
| High School | 24 | 21.0% |
| College / Undergraduate | 14 | 12.3% |
| Graduate / Professional | 2 | 1.8% |
| Total | 114 | 100.0% |
School Enrollment by Age by Funding Source in Rush Valley
Out of a total of 114 students who are enrolled in schools in Rush Valley, 11 (9.6%) attend a private institution, while the remaining 103 (90.4%) are enrolled in public schools. The age group of 3 to 4 year olds has the highest likelihood of being enrolled in private schools, with 1 (25.0% in the age bracket) enrolled. Conversely, the age group of 15 to 17 year olds has the lowest likelihood of being enrolled in a private school, with 19 (100.0% in the age bracket) attending a public institution.
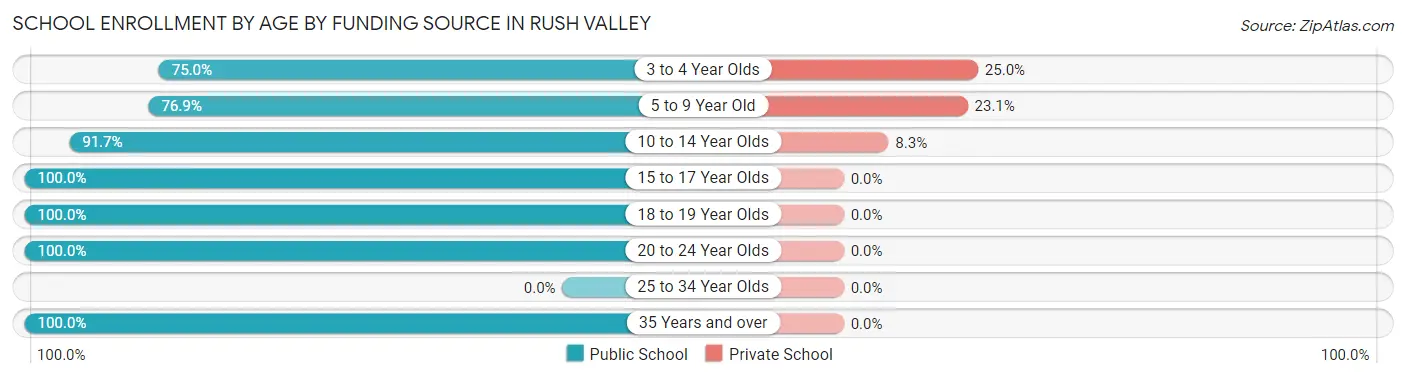
| Age Bracket | Public School | Private School |
| 3 to 4 Year Olds | 3 (75.0%) | 1 (25.0%) |
| 5 to 9 Year Old | 20 (76.9%) | 6 (23.1%) |
| 10 to 14 Year Olds | 44 (91.7%) | 4 (8.3%) |
| 15 to 17 Year Olds | 19 (100.0%) | 0 (0.0%) |
| 18 to 19 Year Olds | 4 (100.0%) | 0 (0.0%) |
| 20 to 24 Year Olds | 5 (100.0%) | 0 (0.0%) |
| 25 to 34 Year Olds | 0 (0.0%) | 0 (0.0%) |
| 35 Years and over | 8 (100.0%) | 0 (0.0%) |
| Total | 103 (90.4%) | 11 (9.6%) |
Educational Attainment by Field of Study in Rush Valley
Arts & humanities (12 | 26.7%), business (7 | 15.6%), psychology (6 | 13.3%), science & technology (3 | 6.7%), and education (3 | 6.7%) are the most common fields of study among 45 individuals in Rush Valley who have obtained a bachelor's degree or higher.
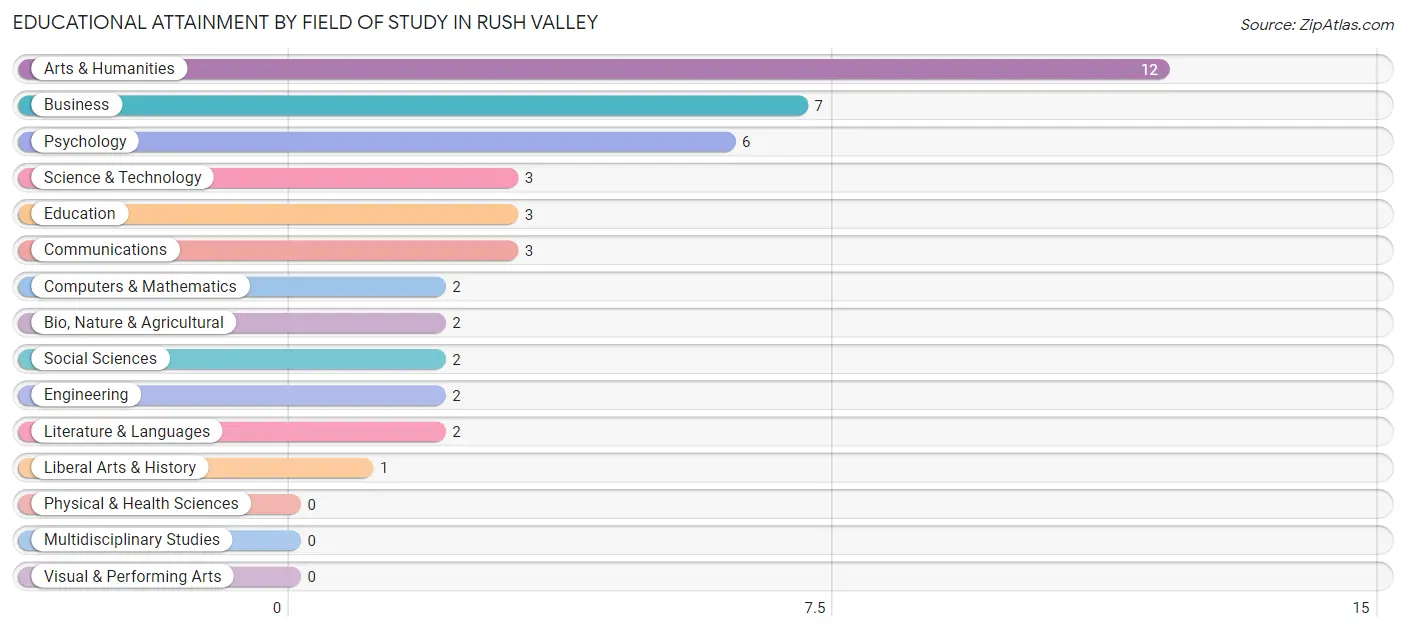
| Field of Study | # Graduates | % Graduates |
| Computers & Mathematics | 2 | 4.4% |
| Bio, Nature & Agricultural | 2 | 4.4% |
| Physical & Health Sciences | 0 | 0.0% |
| Psychology | 6 | 13.3% |
| Social Sciences | 2 | 4.4% |
| Engineering | 2 | 4.4% |
| Multidisciplinary Studies | 0 | 0.0% |
| Science & Technology | 3 | 6.7% |
| Business | 7 | 15.6% |
| Education | 3 | 6.7% |
| Literature & Languages | 2 | 4.4% |
| Liberal Arts & History | 1 | 2.2% |
| Visual & Performing Arts | 0 | 0.0% |
| Communications | 3 | 6.7% |
| Arts & Humanities | 12 | 26.7% |
| Total | 45 | 100.0% |
Transportation & Commute in Rush Valley
Vehicle Availability by Sex in Rush Valley
The most prevalent vehicle ownership categories in Rush Valley are males with 3 vehicles (29, accounting for 29.0%) and females with 3 vehicles (25, making up 36.2%).
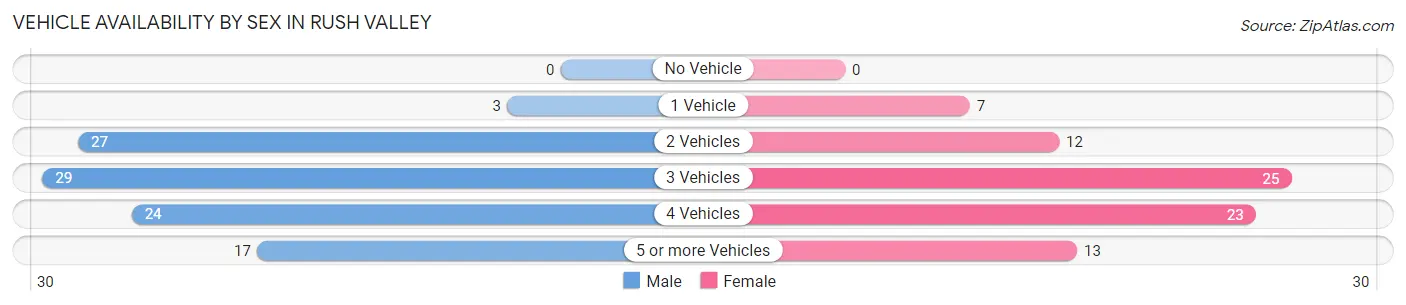
| Vehicles Available | Male | Female |
| No Vehicle | 0 (0.0%) | 0 (0.0%) |
| 1 Vehicle | 3 (3.0%) | 7 (8.7%) |
| 2 Vehicles | 27 (27.0%) | 12 (15.0%) |
| 3 Vehicles | 29 (29.0%) | 25 (31.2%) |
| 4 Vehicles | 24 (24.0%) | 23 (28.7%) |
| 5 or more Vehicles | 17 (17.0%) | 13 (16.3%) |
| Total | 100 (100.0%) | 80 (100.0%) |
Commute Time in Rush Valley
The most frequently occuring commute durations in Rush Valley are 60 to 89 minutes (46 commuters, 26.9%), 30 to 34 minutes (38 commuters, 22.2%), and 45 to 59 minutes (25 commuters, 14.6%).
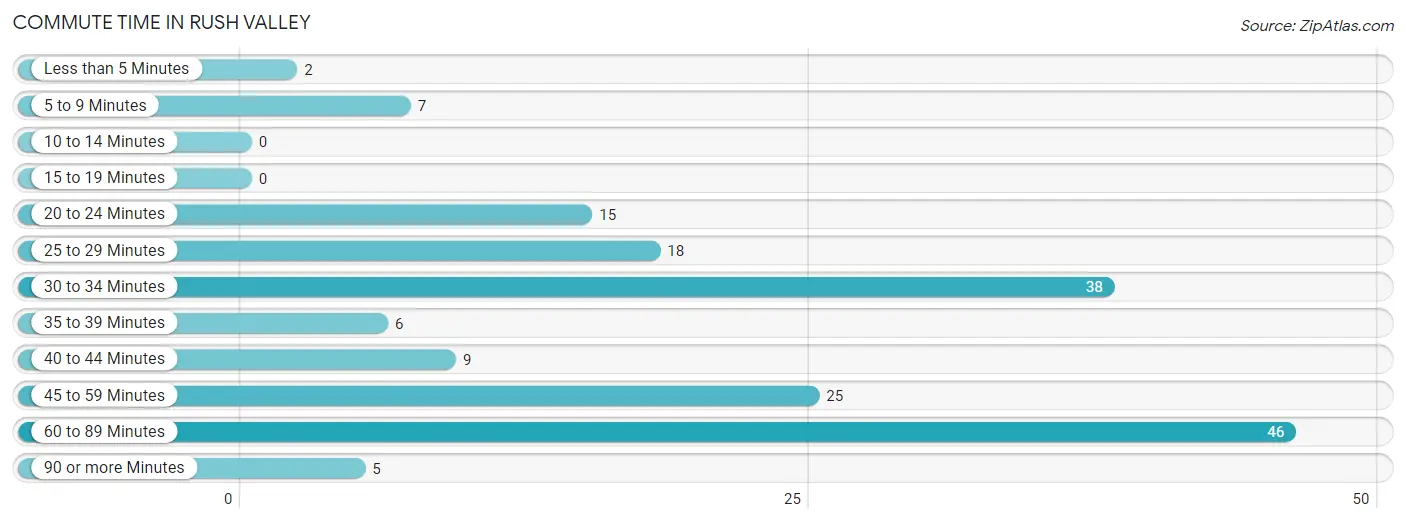
| Commute Time | # Commuters | % Commuters |
| Less than 5 Minutes | 2 | 1.2% |
| 5 to 9 Minutes | 7 | 4.1% |
| 10 to 14 Minutes | 0 | 0.0% |
| 15 to 19 Minutes | 0 | 0.0% |
| 20 to 24 Minutes | 15 | 8.8% |
| 25 to 29 Minutes | 18 | 10.5% |
| 30 to 34 Minutes | 38 | 22.2% |
| 35 to 39 Minutes | 6 | 3.5% |
| 40 to 44 Minutes | 9 | 5.3% |
| 45 to 59 Minutes | 25 | 14.6% |
| 60 to 89 Minutes | 46 | 26.9% |
| 90 or more Minutes | 5 | 2.9% |
Commute Time by Sex in Rush Valley
The most common commute times in Rush Valley are 60 to 89 minutes (32 commuters, 33.0%) for males and 30 to 34 minutes (25 commuters, 33.8%) for females.
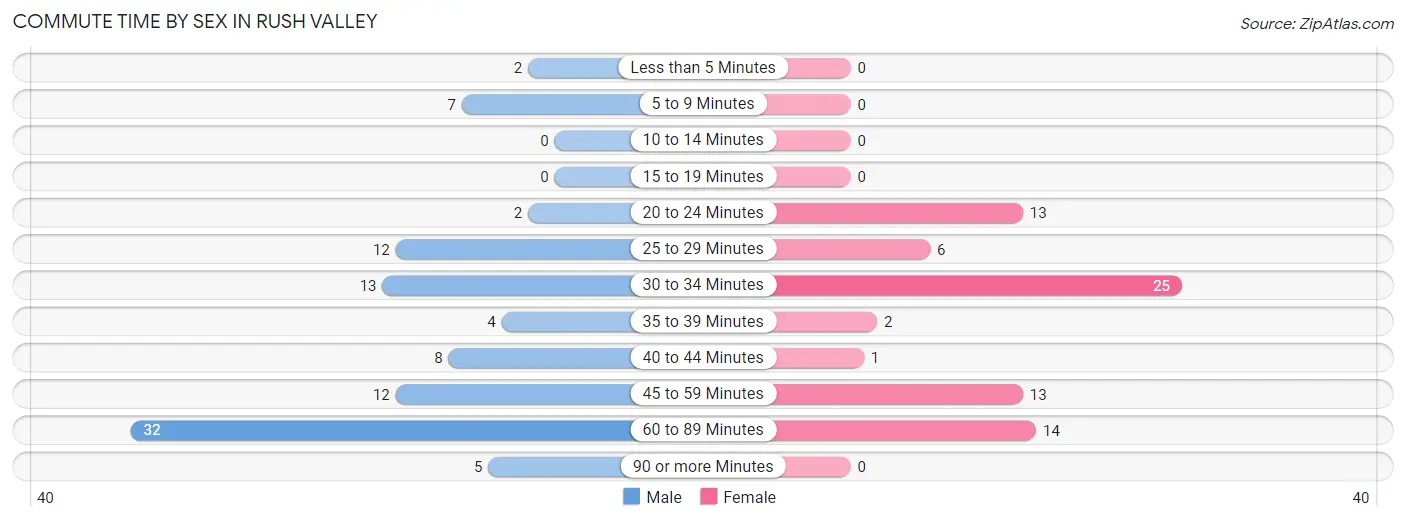
| Commute Time | Male | Female |
| Less than 5 Minutes | 2 (2.1%) | 0 (0.0%) |
| 5 to 9 Minutes | 7 (7.2%) | 0 (0.0%) |
| 10 to 14 Minutes | 0 (0.0%) | 0 (0.0%) |
| 15 to 19 Minutes | 0 (0.0%) | 0 (0.0%) |
| 20 to 24 Minutes | 2 (2.1%) | 13 (17.6%) |
| 25 to 29 Minutes | 12 (12.4%) | 6 (8.1%) |
| 30 to 34 Minutes | 13 (13.4%) | 25 (33.8%) |
| 35 to 39 Minutes | 4 (4.1%) | 2 (2.7%) |
| 40 to 44 Minutes | 8 (8.3%) | 1 (1.3%) |
| 45 to 59 Minutes | 12 (12.4%) | 13 (17.6%) |
| 60 to 89 Minutes | 32 (33.0%) | 14 (18.9%) |
| 90 or more Minutes | 5 (5.1%) | 0 (0.0%) |
Time of Departure to Work by Sex in Rush Valley
The most frequent times of departure to work in Rush Valley are 5:30 AM to 5:59 AM (20, 20.6%) for males and 7:00 AM to 7:29 AM (28, 37.8%) for females.
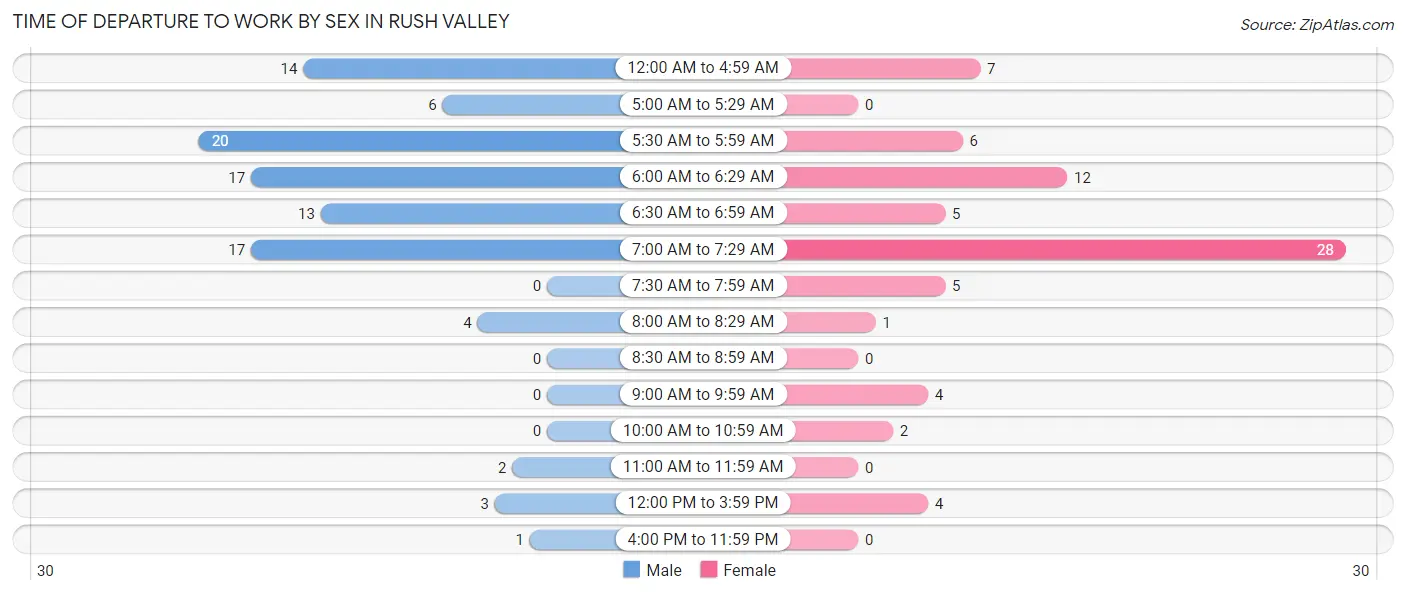
| Time of Departure | Male | Female |
| 12:00 AM to 4:59 AM | 14 (14.4%) | 7 (9.5%) |
| 5:00 AM to 5:29 AM | 6 (6.2%) | 0 (0.0%) |
| 5:30 AM to 5:59 AM | 20 (20.6%) | 6 (8.1%) |
| 6:00 AM to 6:29 AM | 17 (17.5%) | 12 (16.2%) |
| 6:30 AM to 6:59 AM | 13 (13.4%) | 5 (6.8%) |
| 7:00 AM to 7:29 AM | 17 (17.5%) | 28 (37.8%) |
| 7:30 AM to 7:59 AM | 0 (0.0%) | 5 (6.8%) |
| 8:00 AM to 8:29 AM | 4 (4.1%) | 1 (1.3%) |
| 8:30 AM to 8:59 AM | 0 (0.0%) | 0 (0.0%) |
| 9:00 AM to 9:59 AM | 0 (0.0%) | 4 (5.4%) |
| 10:00 AM to 10:59 AM | 0 (0.0%) | 2 (2.7%) |
| 11:00 AM to 11:59 AM | 2 (2.1%) | 0 (0.0%) |
| 12:00 PM to 3:59 PM | 3 (3.1%) | 4 (5.4%) |
| 4:00 PM to 11:59 PM | 1 (1.0%) | 0 (0.0%) |
| Total | 97 (100.0%) | 74 (100.0%) |
Housing Occupancy in Rush Valley
Occupancy by Ownership in Rush Valley
Of the total 168 dwellings in Rush Valley, owner-occupied units account for 135 (80.4%), while renter-occupied units make up 33 (19.6%).
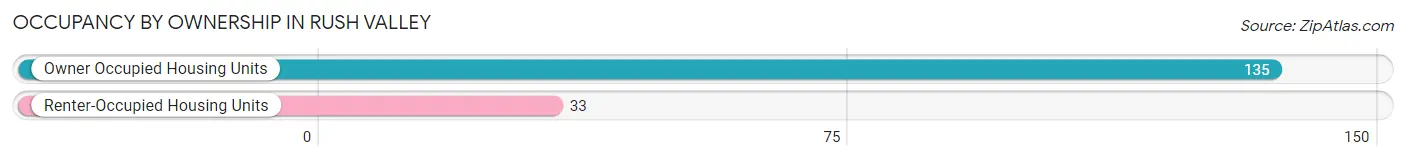
| Occupancy | # Housing Units | % Housing Units |
| Owner Occupied Housing Units | 135 | 80.4% |
| Renter-Occupied Housing Units | 33 | 19.6% |
| Total Occupied Housing Units | 168 | 100.0% |
Occupancy by Household Size in Rush Valley
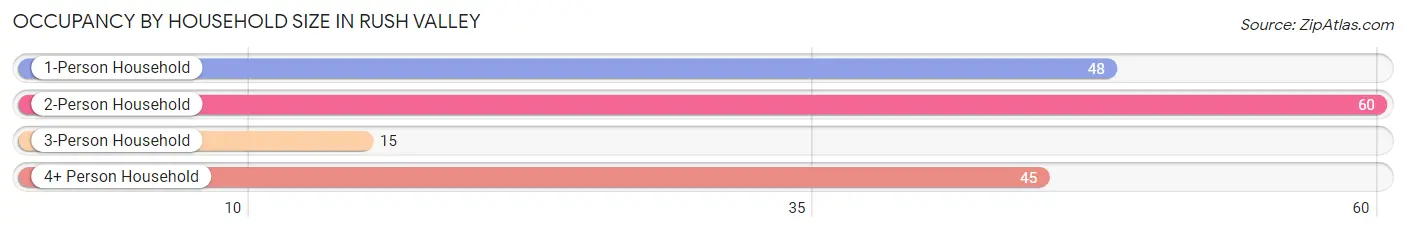
| Household Size | # Housing Units | % Housing Units |
| 1-Person Household | 48 | 28.6% |
| 2-Person Household | 60 | 35.7% |
| 3-Person Household | 15 | 8.9% |
| 4+ Person Household | 45 | 26.8% |
| Total Housing Units | 168 | 100.0% |
Occupancy by Ownership by Household Size in Rush Valley
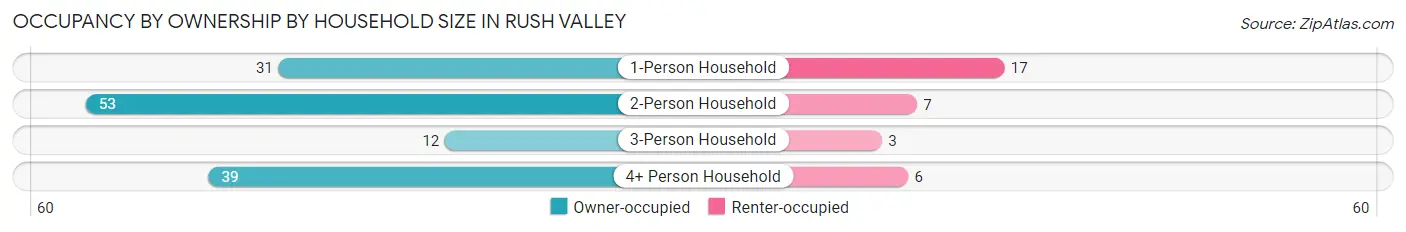
| Household Size | Owner-occupied | Renter-occupied |
| 1-Person Household | 31 (64.6%) | 17 (35.4%) |
| 2-Person Household | 53 (88.3%) | 7 (11.7%) |
| 3-Person Household | 12 (80.0%) | 3 (20.0%) |
| 4+ Person Household | 39 (86.7%) | 6 (13.3%) |
| Total Housing Units | 135 (80.4%) | 33 (19.6%) |
Occupancy by Educational Attainment in Rush Valley

| Household Size | Owner-occupied | Renter-occupied |
| Less than High School | 5 (83.3%) | 1 (16.7%) |
| High School Diploma | 38 (86.4%) | 6 (13.6%) |
| College/Associate Degree | 72 (82.8%) | 15 (17.2%) |
| Bachelor's Degree or higher | 20 (64.5%) | 11 (35.5%) |
Occupancy by Age of Householder in Rush Valley
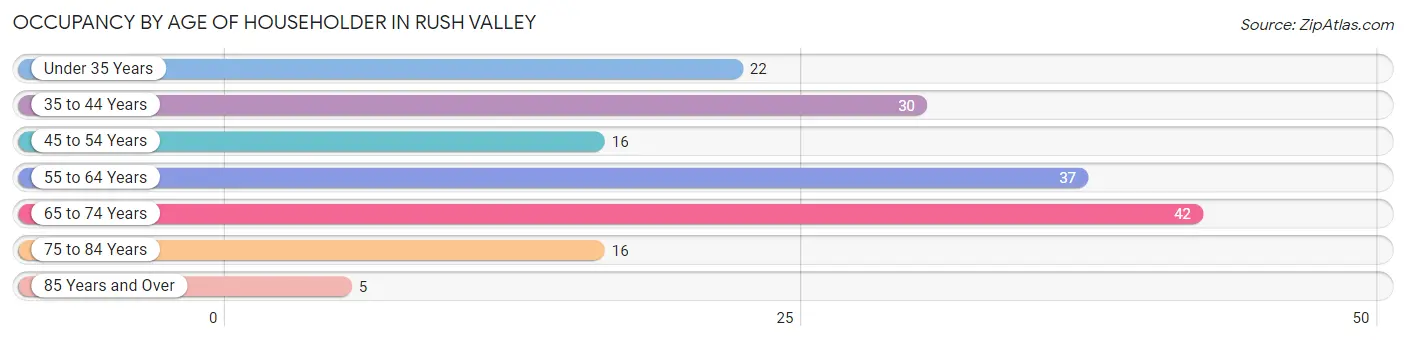
| Age Bracket | # Households | % Households |
| Under 35 Years | 22 | 13.1% |
| 35 to 44 Years | 30 | 17.9% |
| 45 to 54 Years | 16 | 9.5% |
| 55 to 64 Years | 37 | 22.0% |
| 65 to 74 Years | 42 | 25.0% |
| 75 to 84 Years | 16 | 9.5% |
| 85 Years and Over | 5 | 3.0% |
| Total | 168 | 100.0% |
Housing Finances in Rush Valley
Median Income by Occupancy in Rush Valley
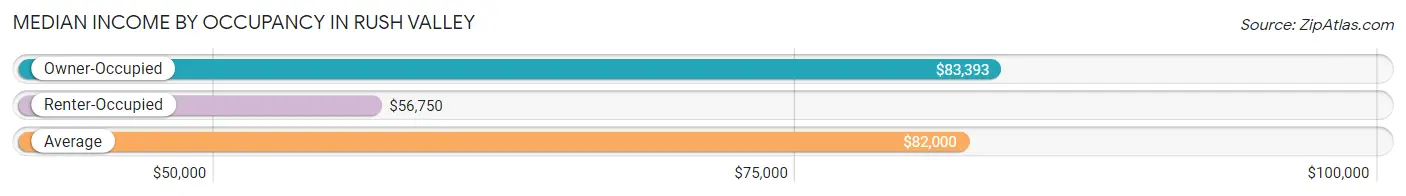
| Occupancy Type | # Households | Median Income |
| Owner-Occupied | 135 (80.4%) | $83,393 |
| Renter-Occupied | 33 (19.6%) | $56,750 |
| Average | 168 (100.0%) | $82,000 |
Occupancy by Householder Income Bracket in Rush Valley
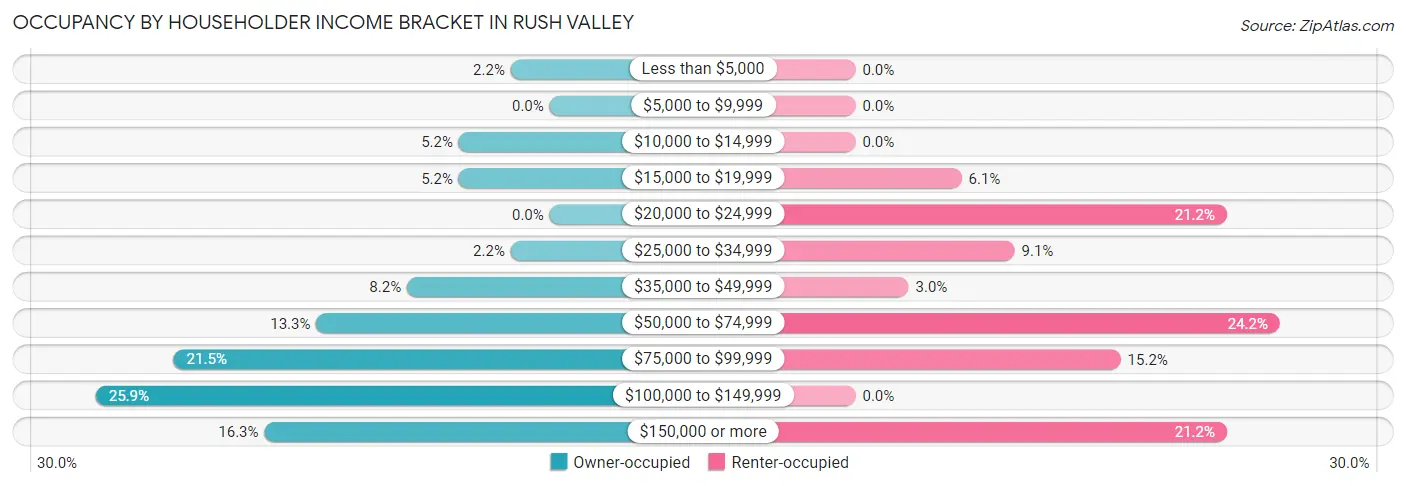
| Income Bracket | Owner-occupied | Renter-occupied |
| Less than $5,000 | 3 (2.2%) | 0 (0.0%) |
| $5,000 to $9,999 | 0 (0.0%) | 0 (0.0%) |
| $10,000 to $14,999 | 7 (5.2%) | 0 (0.0%) |
| $15,000 to $19,999 | 7 (5.2%) | 2 (6.1%) |
| $20,000 to $24,999 | 0 (0.0%) | 7 (21.2%) |
| $25,000 to $34,999 | 3 (2.2%) | 3 (9.1%) |
| $35,000 to $49,999 | 11 (8.2%) | 1 (3.0%) |
| $50,000 to $74,999 | 18 (13.3%) | 8 (24.2%) |
| $75,000 to $99,999 | 29 (21.5%) | 5 (15.1%) |
| $100,000 to $149,999 | 35 (25.9%) | 0 (0.0%) |
| $150,000 or more | 22 (16.3%) | 7 (21.2%) |
| Total | 135 (100.0%) | 33 (100.0%) |
Monthly Housing Cost Tiers in Rush Valley
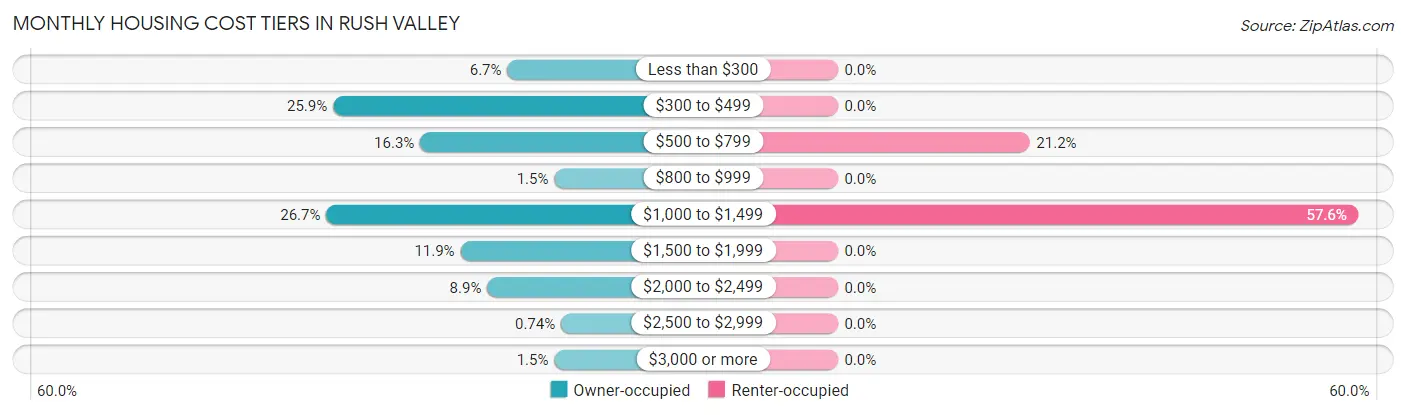
| Monthly Cost | Owner-occupied | Renter-occupied |
| Less than $300 | 9 (6.7%) | 0 (0.0%) |
| $300 to $499 | 35 (25.9%) | 0 (0.0%) |
| $500 to $799 | 22 (16.3%) | 7 (21.2%) |
| $800 to $999 | 2 (1.5%) | 0 (0.0%) |
| $1,000 to $1,499 | 36 (26.7%) | 19 (57.6%) |
| $1,500 to $1,999 | 16 (11.8%) | 0 (0.0%) |
| $2,000 to $2,499 | 12 (8.9%) | 0 (0.0%) |
| $2,500 to $2,999 | 1 (0.7%) | 0 (0.0%) |
| $3,000 or more | 2 (1.5%) | 0 (0.0%) |
| Total | 135 (100.0%) | 33 (100.0%) |
Physical Housing Characteristics in Rush Valley
Housing Structures in Rush Valley
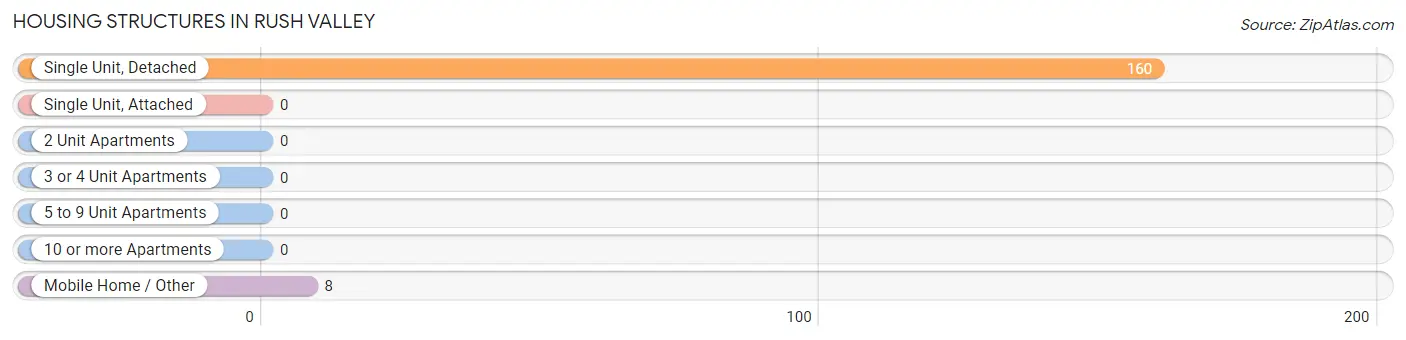
| Structure Type | # Housing Units | % Housing Units |
| Single Unit, Detached | 160 | 95.2% |
| Single Unit, Attached | 0 | 0.0% |
| 2 Unit Apartments | 0 | 0.0% |
| 3 or 4 Unit Apartments | 0 | 0.0% |
| 5 to 9 Unit Apartments | 0 | 0.0% |
| 10 or more Apartments | 0 | 0.0% |
| Mobile Home / Other | 8 | 4.8% |
| Total | 168 | 100.0% |
Housing Structures by Occupancy in Rush Valley
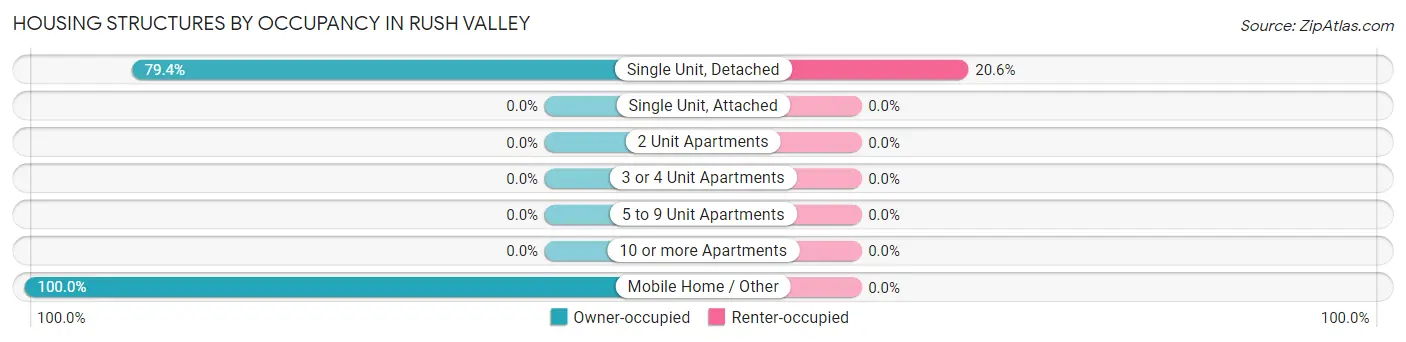
| Structure Type | Owner-occupied | Renter-occupied |
| Single Unit, Detached | 127 (79.4%) | 33 (20.6%) |
| Single Unit, Attached | 0 (0.0%) | 0 (0.0%) |
| 2 Unit Apartments | 0 (0.0%) | 0 (0.0%) |
| 3 or 4 Unit Apartments | 0 (0.0%) | 0 (0.0%) |
| 5 to 9 Unit Apartments | 0 (0.0%) | 0 (0.0%) |
| 10 or more Apartments | 0 (0.0%) | 0 (0.0%) |
| Mobile Home / Other | 8 (100.0%) | 0 (0.0%) |
| Total | 135 (80.4%) | 33 (19.6%) |
Housing Structures by Number of Rooms in Rush Valley
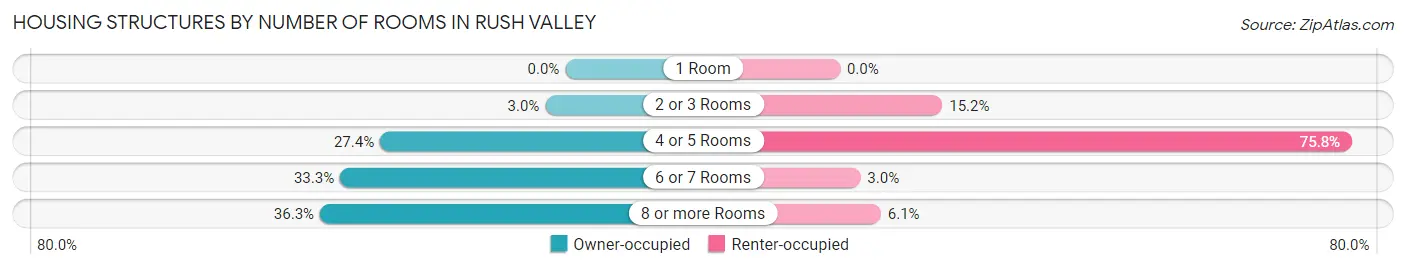
| Number of Rooms | Owner-occupied | Renter-occupied |
| 1 Room | 0 (0.0%) | 0 (0.0%) |
| 2 or 3 Rooms | 4 (3.0%) | 5 (15.1%) |
| 4 or 5 Rooms | 37 (27.4%) | 25 (75.8%) |
| 6 or 7 Rooms | 45 (33.3%) | 1 (3.0%) |
| 8 or more Rooms | 49 (36.3%) | 2 (6.1%) |
| Total | 135 (100.0%) | 33 (100.0%) |
Housing Structure by Heating Type in Rush Valley
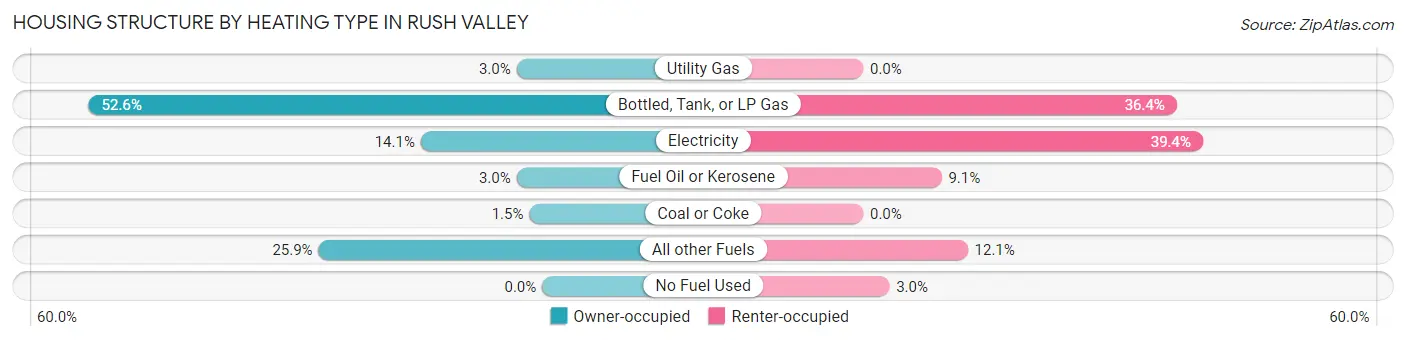
| Heating Type | Owner-occupied | Renter-occupied |
| Utility Gas | 4 (3.0%) | 0 (0.0%) |
| Bottled, Tank, or LP Gas | 71 (52.6%) | 12 (36.4%) |
| Electricity | 19 (14.1%) | 13 (39.4%) |
| Fuel Oil or Kerosene | 4 (3.0%) | 3 (9.1%) |
| Coal or Coke | 2 (1.5%) | 0 (0.0%) |
| All other Fuels | 35 (25.9%) | 4 (12.1%) |
| No Fuel Used | 0 (0.0%) | 1 (3.0%) |
| Total | 135 (100.0%) | 33 (100.0%) |
Household Vehicle Usage in Rush Valley
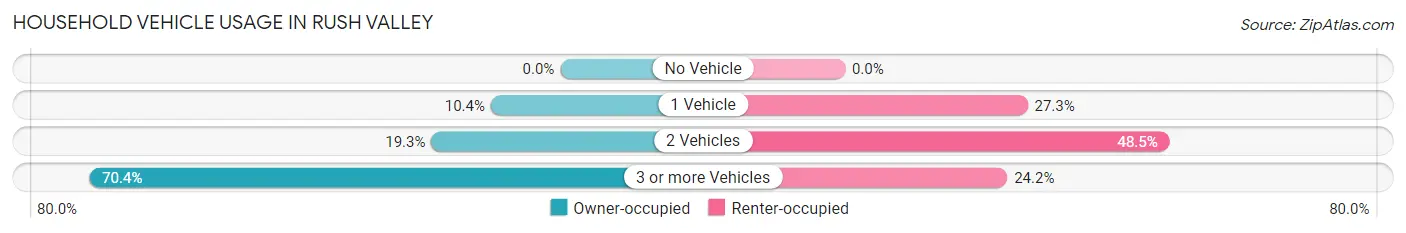
| Vehicles per Household | Owner-occupied | Renter-occupied |
| No Vehicle | 0 (0.0%) | 0 (0.0%) |
| 1 Vehicle | 14 (10.4%) | 9 (27.3%) |
| 2 Vehicles | 26 (19.3%) | 16 (48.5%) |
| 3 or more Vehicles | 95 (70.4%) | 8 (24.2%) |
| Total | 135 (100.0%) | 33 (100.0%) |
Real Estate & Mortgages in Rush Valley
Real Estate and Mortgage Overview in Rush Valley
| Characteristic | Without Mortgage | With Mortgage |
| Housing Units | 74 | 61 |
| Median Property Value | $363,200 | $330,400 |
| Median Household Income | $81,875 | $11 |
| Monthly Housing Costs | $463 | $2 |
| Real Estate Taxes | $2,037 | $1 |
Property Value by Mortgage Status in Rush Valley
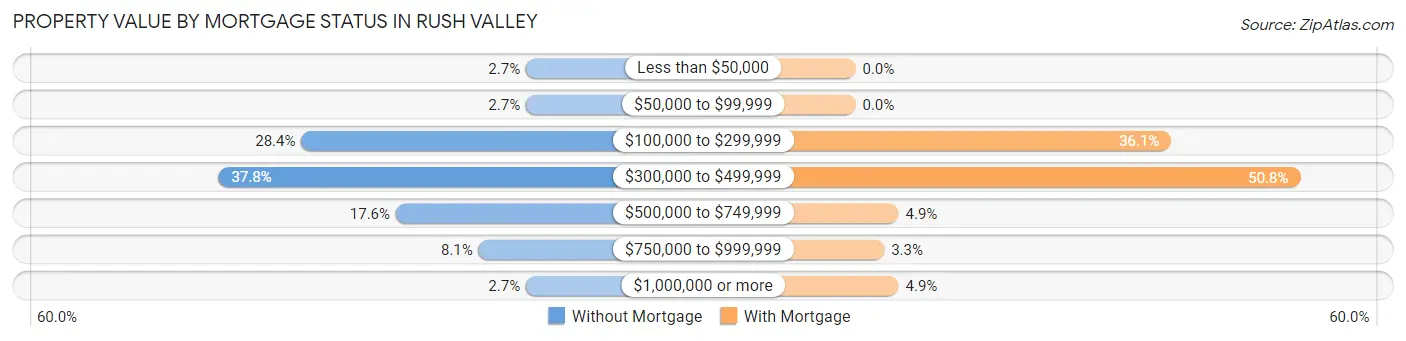
| Property Value | Without Mortgage | With Mortgage |
| Less than $50,000 | 2 (2.7%) | 0 (0.0%) |
| $50,000 to $99,999 | 2 (2.7%) | 0 (0.0%) |
| $100,000 to $299,999 | 21 (28.4%) | 22 (36.1%) |
| $300,000 to $499,999 | 28 (37.8%) | 31 (50.8%) |
| $500,000 to $749,999 | 13 (17.6%) | 3 (4.9%) |
| $750,000 to $999,999 | 6 (8.1%) | 2 (3.3%) |
| $1,000,000 or more | 2 (2.7%) | 3 (4.9%) |
| Total | 74 (100.0%) | 61 (100.0%) |
Household Income by Mortgage Status in Rush Valley
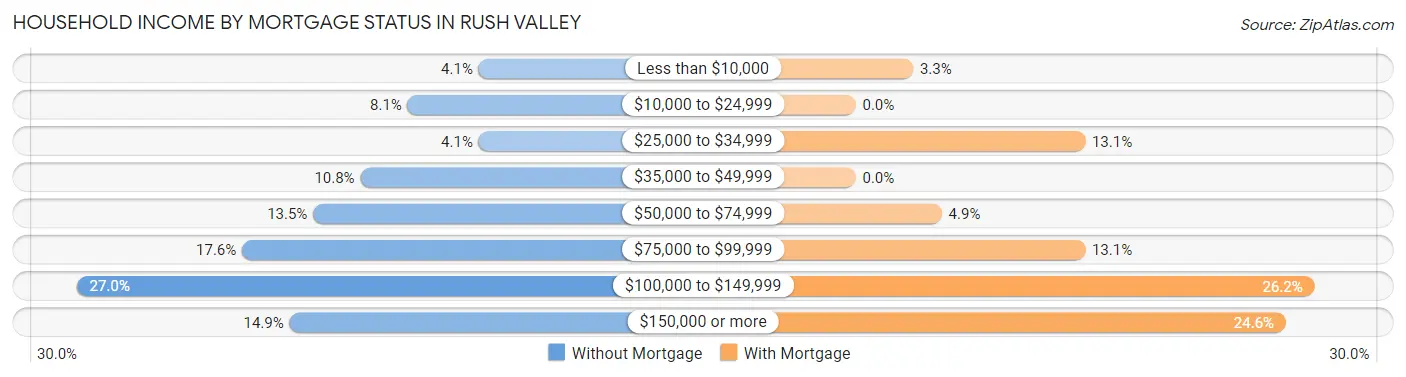
| Household Income | Without Mortgage | With Mortgage |
| Less than $10,000 | 3 (4.1%) | 2 (3.3%) |
| $10,000 to $24,999 | 6 (8.1%) | 0 (0.0%) |
| $25,000 to $34,999 | 3 (4.1%) | 8 (13.1%) |
| $35,000 to $49,999 | 8 (10.8%) | 0 (0.0%) |
| $50,000 to $74,999 | 10 (13.5%) | 3 (4.9%) |
| $75,000 to $99,999 | 13 (17.6%) | 8 (13.1%) |
| $100,000 to $149,999 | 20 (27.0%) | 16 (26.2%) |
| $150,000 or more | 11 (14.9%) | 15 (24.6%) |
| Total | 74 (100.0%) | 61 (100.0%) |
Property Value to Household Income Ratio in Rush Valley
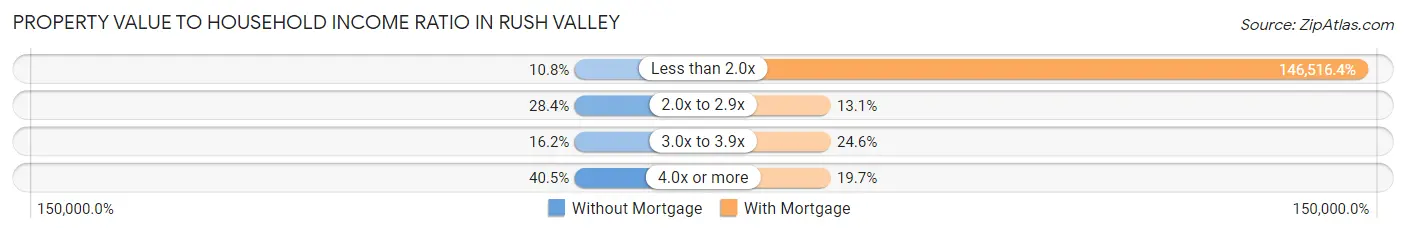
| Value-to-Income Ratio | Without Mortgage | With Mortgage |
| Less than 2.0x | 8 (10.8%) | 89,375 (146,516.4%) |
| 2.0x to 2.9x | 21 (28.4%) | 8 (13.1%) |
| 3.0x to 3.9x | 12 (16.2%) | 15 (24.6%) |
| 4.0x or more | 30 (40.5%) | 12 (19.7%) |
| Total | 74 (100.0%) | 61 (100.0%) |
Real Estate Taxes by Mortgage Status in Rush Valley
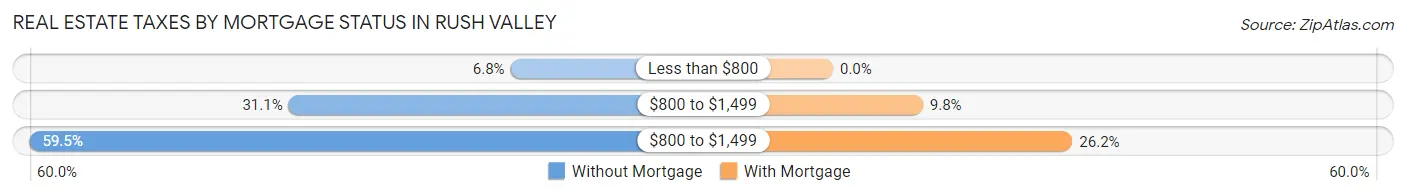
| Property Taxes | Without Mortgage | With Mortgage |
| Less than $800 | 5 (6.8%) | 0 (0.0%) |
| $800 to $1,499 | 23 (31.1%) | 6 (9.8%) |
| $800 to $1,499 | 44 (59.5%) | 16 (26.2%) |
| Total | 74 (100.0%) | 61 (100.0%) |
Health & Disability in Rush Valley
Health Insurance Coverage by Age in Rush Valley
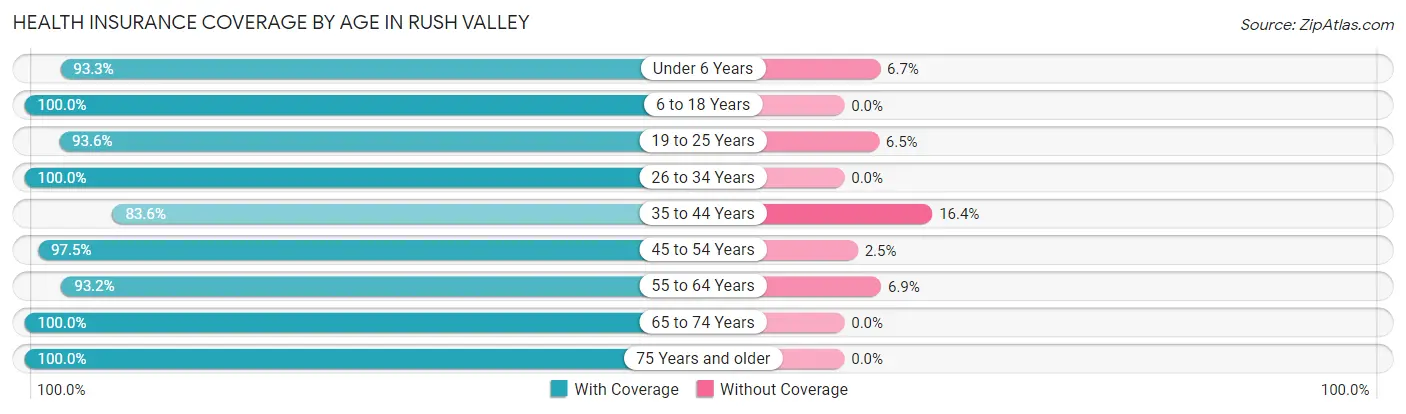
| Age Bracket | With Coverage | Without Coverage |
| Under 6 Years | 14 (93.3%) | 1 (6.7%) |
| 6 to 18 Years | 98 (100.0%) | 0 (0.0%) |
| 19 to 25 Years | 29 (93.5%) | 2 (6.5%) |
| 26 to 34 Years | 22 (100.0%) | 0 (0.0%) |
| 35 to 44 Years | 51 (83.6%) | 10 (16.4%) |
| 45 to 54 Years | 39 (97.5%) | 1 (2.5%) |
| 55 to 64 Years | 68 (93.1%) | 5 (6.9%) |
| 65 to 74 Years | 70 (100.0%) | 0 (0.0%) |
| 75 Years and older | 27 (100.0%) | 0 (0.0%) |
| Total | 418 (95.7%) | 19 (4.3%) |
Health Insurance Coverage by Citizenship Status in Rush Valley
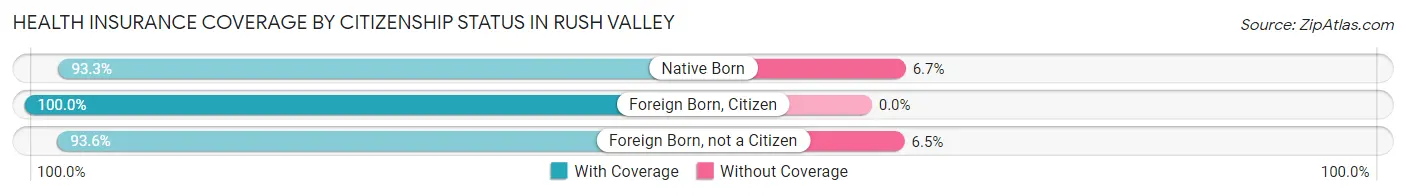
| Citizenship Status | With Coverage | Without Coverage |
| Native Born | 14 (93.3%) | 1 (6.7%) |
| Foreign Born, Citizen | 98 (100.0%) | 0 (0.0%) |
| Foreign Born, not a Citizen | 29 (93.5%) | 2 (6.5%) |
Health Insurance Coverage by Household Income in Rush Valley
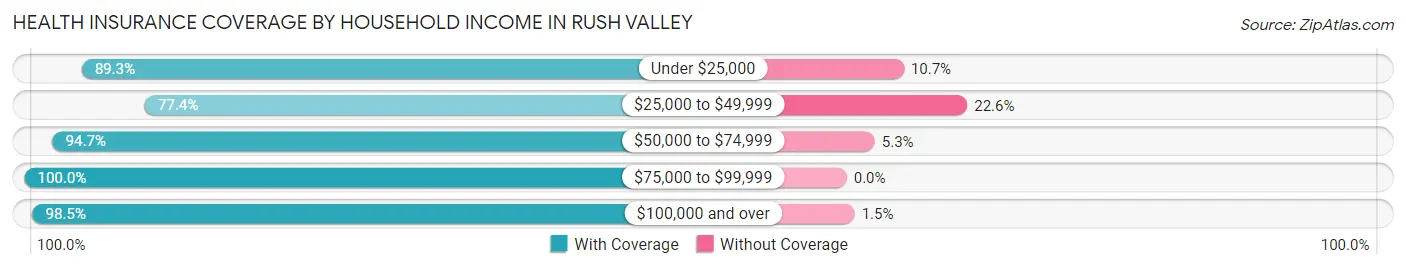
| Household Income | With Coverage | Without Coverage |
| Under $25,000 | 50 (89.3%) | 6 (10.7%) |
| $25,000 to $49,999 | 24 (77.4%) | 7 (22.6%) |
| $50,000 to $74,999 | 54 (94.7%) | 3 (5.3%) |
| $75,000 to $99,999 | 92 (100.0%) | 0 (0.0%) |
| $100,000 and over | 198 (98.5%) | 3 (1.5%) |
Public vs Private Health Insurance Coverage by Age in Rush Valley
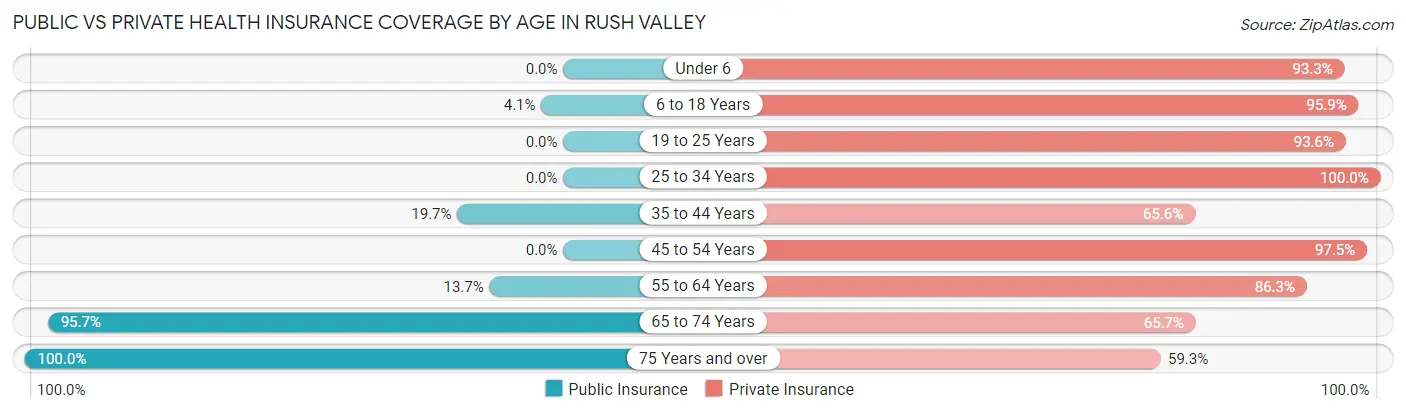
| Age Bracket | Public Insurance | Private Insurance |
| Under 6 | 0 (0.0%) | 14 (93.3%) |
| 6 to 18 Years | 4 (4.1%) | 94 (95.9%) |
| 19 to 25 Years | 0 (0.0%) | 29 (93.5%) |
| 25 to 34 Years | 0 (0.0%) | 22 (100.0%) |
| 35 to 44 Years | 12 (19.7%) | 40 (65.6%) |
| 45 to 54 Years | 0 (0.0%) | 39 (97.5%) |
| 55 to 64 Years | 10 (13.7%) | 63 (86.3%) |
| 65 to 74 Years | 67 (95.7%) | 46 (65.7%) |
| 75 Years and over | 27 (100.0%) | 16 (59.3%) |
| Total | 120 (27.5%) | 363 (83.1%) |
Disability Status by Sex by Age in Rush Valley
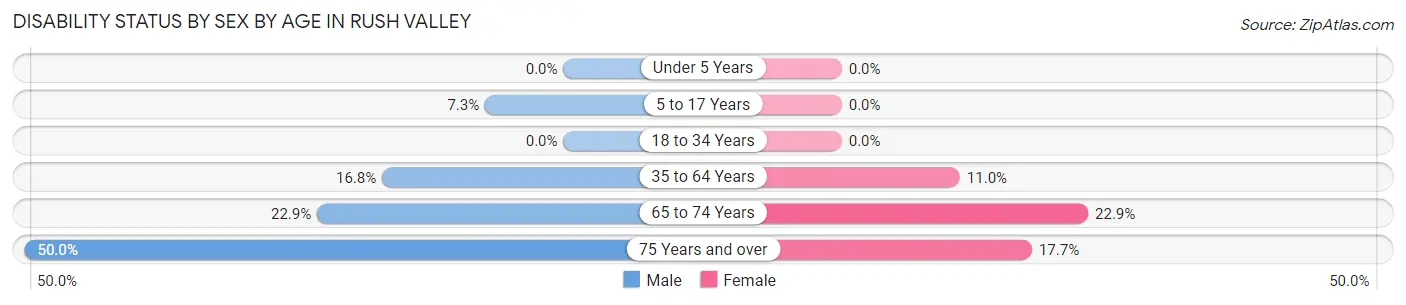
| Age Bracket | Male | Female |
| Under 5 Years | 0 (0.0%) | 0 (0.0%) |
| 5 to 17 Years | 4 (7.3%) | 0 (0.0%) |
| 18 to 34 Years | 0 (0.0%) | 0 (0.0%) |
| 35 to 64 Years | 17 (16.8%) | 8 (11.0%) |
| 65 to 74 Years | 8 (22.9%) | 8 (22.9%) |
| 75 Years and over | 5 (50.0%) | 3 (17.6%) |
Disability Class by Sex by Age in Rush Valley
Disability Class: Hearing Difficulty
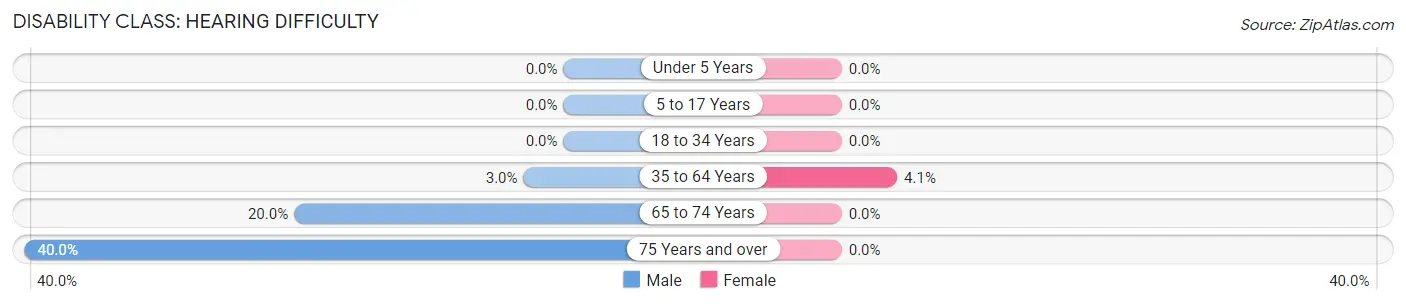
| Age Bracket | Male | Female |
| Under 5 Years | 0 (0.0%) | 0 (0.0%) |
| 5 to 17 Years | 0 (0.0%) | 0 (0.0%) |
| 18 to 34 Years | 0 (0.0%) | 0 (0.0%) |
| 35 to 64 Years | 3 (3.0%) | 3 (4.1%) |
| 65 to 74 Years | 7 (20.0%) | 0 (0.0%) |
| 75 Years and over | 4 (40.0%) | 0 (0.0%) |
Disability Class: Vision Difficulty
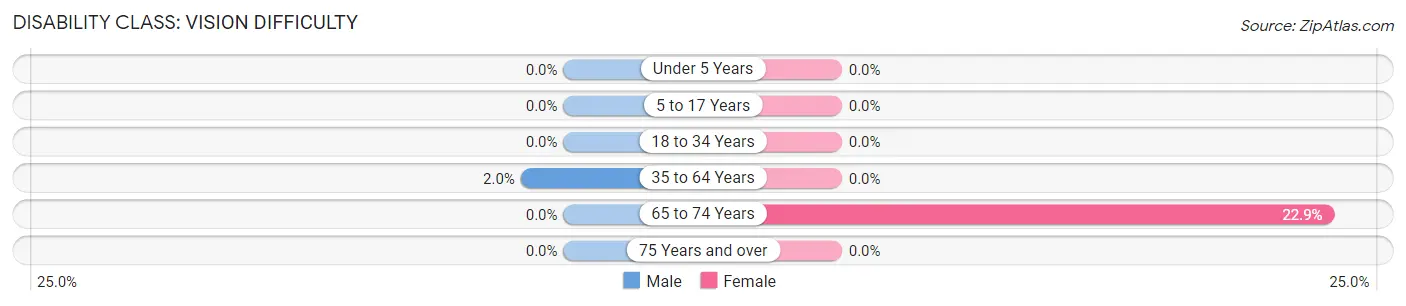
| Age Bracket | Male | Female |
| Under 5 Years | 0 (0.0%) | 0 (0.0%) |
| 5 to 17 Years | 0 (0.0%) | 0 (0.0%) |
| 18 to 34 Years | 0 (0.0%) | 0 (0.0%) |
| 35 to 64 Years | 2 (2.0%) | 0 (0.0%) |
| 65 to 74 Years | 0 (0.0%) | 8 (22.9%) |
| 75 Years and over | 0 (0.0%) | 0 (0.0%) |
Disability Class: Cognitive Difficulty
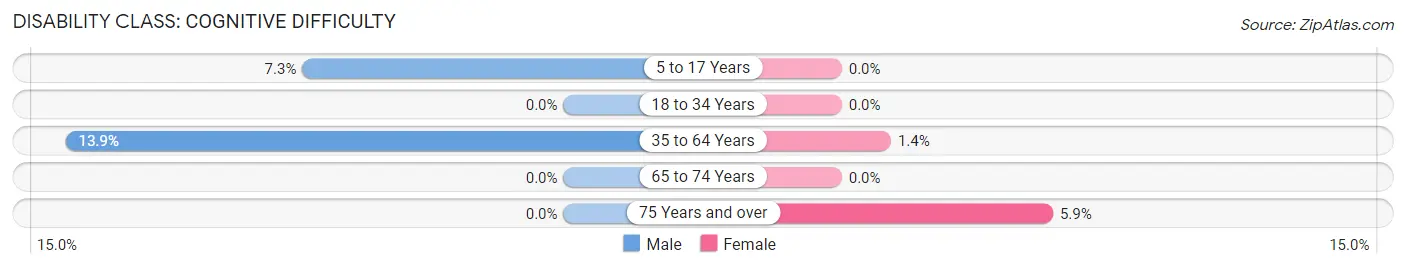
| Age Bracket | Male | Female |
| 5 to 17 Years | 4 (7.3%) | 0 (0.0%) |
| 18 to 34 Years | 0 (0.0%) | 0 (0.0%) |
| 35 to 64 Years | 14 (13.9%) | 1 (1.4%) |
| 65 to 74 Years | 0 (0.0%) | 0 (0.0%) |
| 75 Years and over | 0 (0.0%) | 1 (5.9%) |
Disability Class: Ambulatory Difficulty
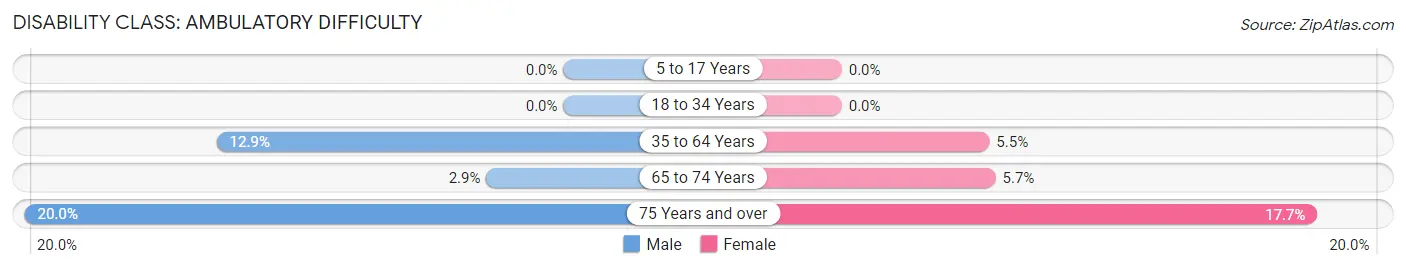
| Age Bracket | Male | Female |
| 5 to 17 Years | 0 (0.0%) | 0 (0.0%) |
| 18 to 34 Years | 0 (0.0%) | 0 (0.0%) |
| 35 to 64 Years | 13 (12.9%) | 4 (5.5%) |
| 65 to 74 Years | 1 (2.9%) | 2 (5.7%) |
| 75 Years and over | 2 (20.0%) | 3 (17.6%) |
Disability Class: Self-Care Difficulty
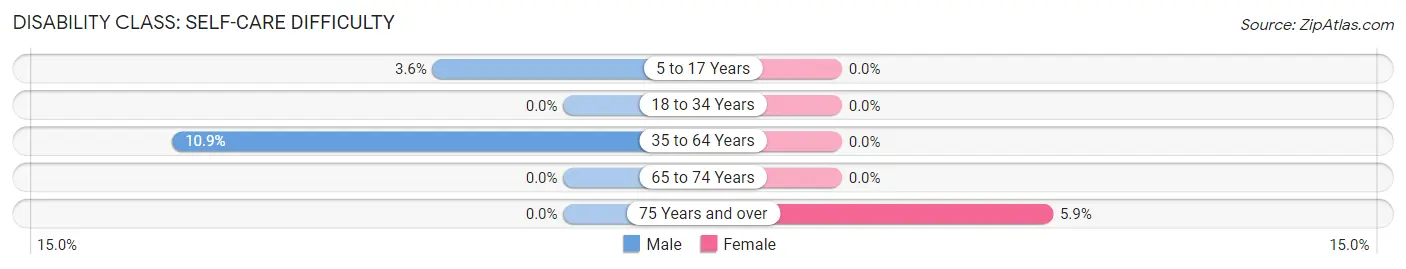
| Age Bracket | Male | Female |
| 5 to 17 Years | 2 (3.6%) | 0 (0.0%) |
| 18 to 34 Years | 0 (0.0%) | 0 (0.0%) |
| 35 to 64 Years | 11 (10.9%) | 0 (0.0%) |
| 65 to 74 Years | 0 (0.0%) | 0 (0.0%) |
| 75 Years and over | 0 (0.0%) | 1 (5.9%) |
Technology Access in Rush Valley
Computing Device Access in Rush Valley
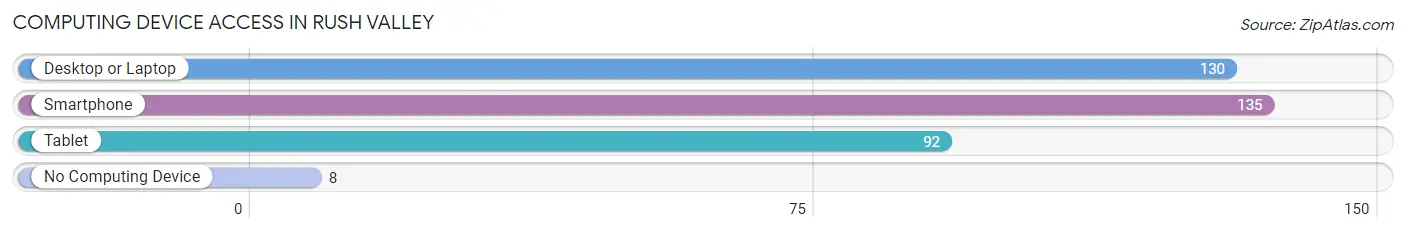
| Device Type | # Households | % Households |
| Desktop or Laptop | 130 | 77.4% |
| Smartphone | 135 | 80.4% |
| Tablet | 92 | 54.8% |
| No Computing Device | 8 | 4.8% |
| Total | 168 | 100.0% |
Internet Access in Rush Valley
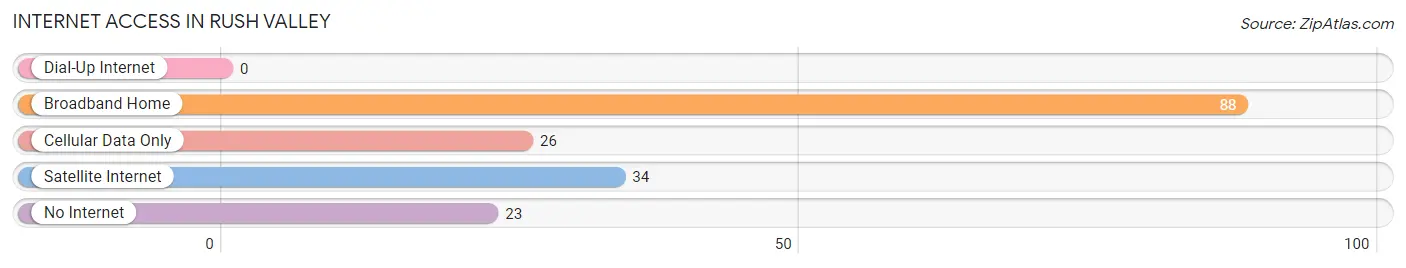
| Internet Type | # Households | % Households |
| Dial-Up Internet | 0 | 0.0% |
| Broadband Home | 88 | 52.4% |
| Cellular Data Only | 26 | 15.5% |
| Satellite Internet | 34 | 20.2% |
| No Internet | 23 | 13.7% |
| Total | 168 | 100.0% |
Rush Valley Summary
Valley History
Rush Valley is a small town located in Tooele County, Utah. It was first settled in 1848 by a group of Mormon pioneers led by John Rush. The town was named after Rush, who was a prominent leader in the Church of Jesus Christ of Latter-day Saints. The town was originally a farming community, but it soon became a mining town when gold and silver were discovered in the area. The town grew rapidly and by the late 1800s, it had become a bustling mining town with a population of over 1,000 people.
The town was home to several mines, including the Rush Valley Mine, which was the largest and most successful. The mine produced gold, silver, lead, and zinc, and it was one of the most profitable mines in the area. The town also had several other businesses, including a hotel, a general store, a blacksmith shop, and a saloon.
The town was also home to a number of churches, including the Church of Jesus Christ of Latter-day Saints, the Methodist Episcopal Church, and the Catholic Church. The town also had a school, which was attended by both children and adults.
The town experienced a period of decline in the early 1900s, as the mines began to close and the population began to dwindle. By the 1950s, the population had dropped to just over 200 people. However, the town experienced a resurgence in the late 1970s, when the population began to grow again. Today, the population of Rush Valley is around 500 people.
Geography
Rush Valley is located in the western part of Tooele County, Utah. It is situated in the Oquirrh Mountains, which are part of the Wasatch Range. The town is located at an elevation of 4,890 feet above sea level.
The town is surrounded by mountains and hills, and it is located in a valley. The town is located near the Great Salt Lake, which is the largest saltwater lake in the western hemisphere. The lake is located about 25 miles to the west of Rush Valley.
The climate in Rush Valley is semi-arid, with hot summers and cold winters. The average temperature in the summer is around 80 degrees Fahrenheit, and the average temperature in the winter is around 30 degrees Fahrenheit.
Economy
The economy of Rush Valley is largely based on agriculture and tourism. The town is home to several farms, which produce a variety of crops, including hay, wheat, corn, and alfalfa. The town is also home to several tourist attractions, including the Great Salt Lake, the Oquirrh Mountains, and the Rush Valley Mine.
The town is also home to several businesses, including a general store, a hotel, a restaurant, and a gas station. The town also has a post office and a library.
Demographics
As of the 2010 census, the population of Rush Valley was 498 people. The racial makeup of the town was 97.2% White, 0.2% African American, 0.4% Native American, 0.2% Asian, 0.2% Pacific Islander, 0.6% from other races, and 1.2% from two or more races. Hispanic or Latino of any race were 1.2% of the population.
The median income for a household in the town was $41,250, and the median income for a family was $45,833. The per capita income for the town was $17,945. About 8.3% of families and 10.2% of the population were below the poverty line, including 11.3% of those under age 18 and 8.3% of those age 65 or over.
Conclusion
Rush Valley is a small town located in Tooele County, Utah. It was first settled in 1848 by a group of Mormon pioneers led by John Rush. The town was originally a farming community, but it soon became a mining town when gold and silver were discovered in the area. The town experienced a period of decline in the early 1900s, but it has since experienced a resurgence in the late 1970s. Today, the population of Rush Valley is around 500 people. The economy of Rush Valley is largely based on agriculture and tourism. The town is home to several farms, businesses, and tourist attractions. The racial makeup of the town is mostly White, with a small percentage of other races. The median income for a household in the town is $41,250, and the per capita income is $17,945.
Common Questions
What is Per Capita Income in Rush Valley?
Per Capita income in Rush Valley is $35,443.
What is the Median Family Income in Rush Valley?
Median Family Income in Rush Valley is $106,563.
What is the Median Household income in Rush Valley?
Median Household Income in Rush Valley is $82,000.
What is Income or Wage Gap in Rush Valley?
Income or Wage Gap in Rush Valley is 59.0%.
Women in Rush Valley earn 41.0 cents for every dollar earned by a man.
What is Inequality or Gini Index in Rush Valley?
Inequality or Gini Index in Rush Valley is 0.34.
What is the Total Population of Rush Valley?
Total Population of Rush Valley is 437.
What is the Total Male Population of Rush Valley?
Total Male Population of Rush Valley is 224.
What is the Total Female Population of Rush Valley?
Total Female Population of Rush Valley is 213.
What is the Ratio of Males per 100 Females in Rush Valley?
There are 105.16 Males per 100 Females in Rush Valley.
What is the Ratio of Females per 100 Males in Rush Valley?
There are 95.09 Females per 100 Males in Rush Valley.
What is the Median Population Age in Rush Valley?
Median Population Age in Rush Valley is 44.2 Years.
What is the Average Family Size in Rush Valley
Average Family Size in Rush Valley is 3.4 People.
What is the Average Household Size in Rush Valley
Average Household Size in Rush Valley is 2.6 People.
How Large is the Labor Force in Rush Valley?
There are 185 People in the Labor Forcein in Rush Valley.
What is the Percentage of People in the Labor Force in Rush Valley?
53.8% of People are in the Labor Force in Rush Valley.
What is the Unemployment Rate in Rush Valley?
Unemployment Rate in Rush Valley is 1.6%.