Orangeville, UT Map & Demographics
Orangeville Map
Orangeville Overview
$34,255
PER CAPITA INCOME
$100,893
AVG FAMILY INCOME
$83,438
AVG HOUSEHOLD INCOME
56.5%
WAGE / INCOME GAP [ % ]
43.5¢/ $1
WAGE / INCOME GAP [ $ ]
0.32
INEQUALITY / GINI INDEX
1,340
TOTAL POPULATION
667
MALE POPULATION
673
FEMALE POPULATION
99.11
MALES / 100 FEMALES
100.90
FEMALES / 100 MALES
36.5
MEDIAN AGE
3.1
AVG FAMILY SIZE
2.8
AVG HOUSEHOLD SIZE
620
LABOR FORCE [ PEOPLE ]
62.3%
PERCENT IN LABOR FORCE
Orangeville Zip Codes
Orangeville Area Codes
Income in Orangeville
Income Overview in Orangeville
Per Capita Income in Orangeville is $34,255, while median incomes of families and households are $100,893 and $83,438 respectively.
| Characteristic | Number | Measure |
| Per Capita Income | 1,340 | $34,255 |
| Median Family Income | 391 | $100,893 |
| Mean Family Income | 391 | $106,162 |
| Median Household Income | 485 | $83,438 |
| Mean Household Income | 485 | $94,920 |
| Income Deficit | 391 | $0 |
| Wage / Income Gap (%) | 1,340 | 56.50% |
| Wage / Income Gap ($) | 1,340 | 43.50¢ per $1 |
| Gini / Inequality Index | 1,340 | 0.32 |
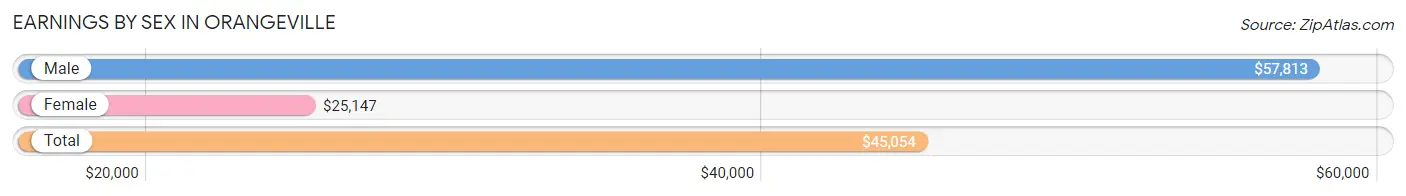
Earnings by Sex in Orangeville
Average Earnings in Orangeville are $45,054, $57,813 for men and $25,147 for women, a difference of 56.5%.
| Sex | Number | Average Earnings |
| Male | 331 (51.3%) | $57,813 |
| Female | 314 (48.7%) | $25,147 |
| Total | 645 (100.0%) | $45,054 |
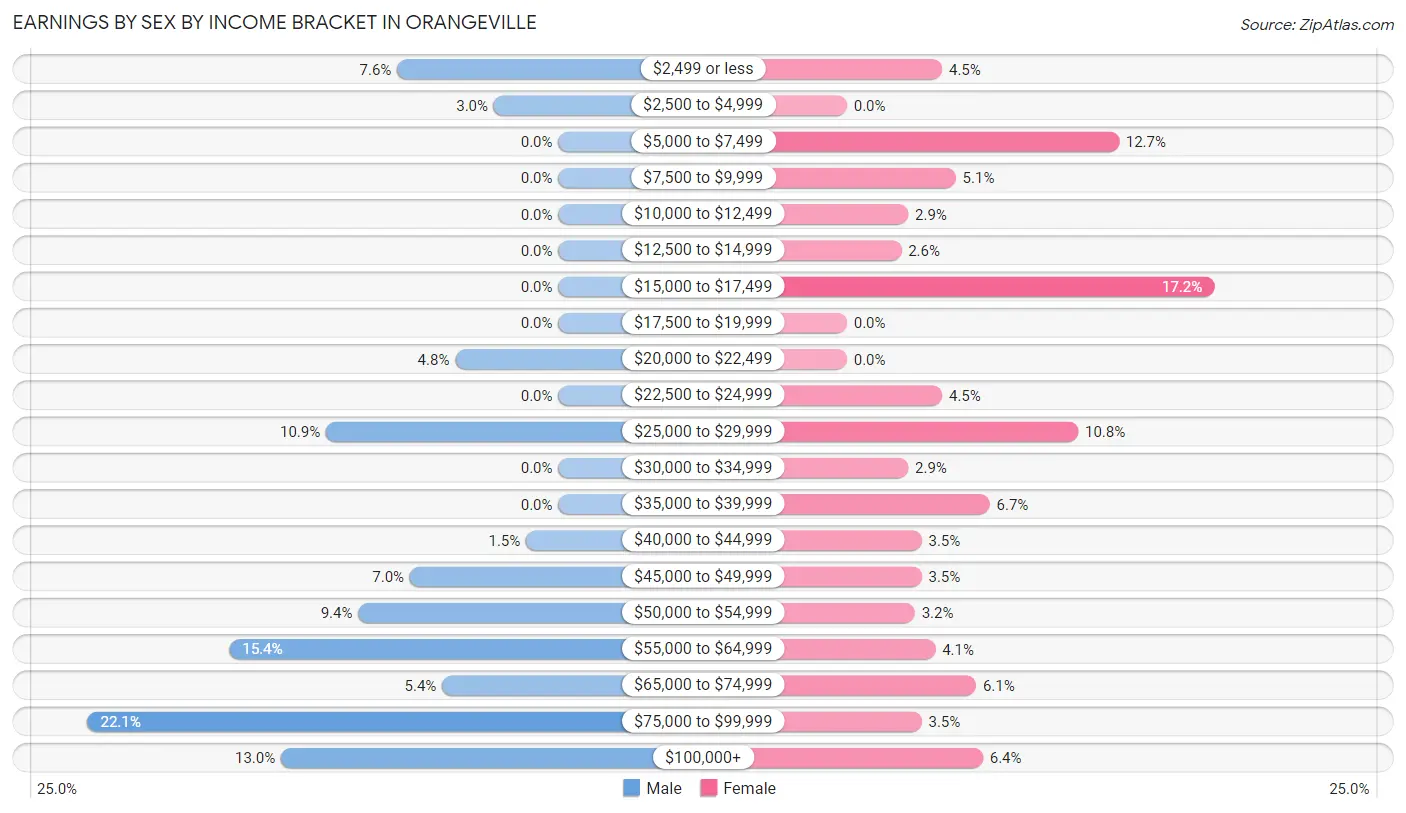
Earnings by Sex by Income Bracket in Orangeville
The most common earnings brackets in Orangeville are $75,000 to $99,999 for men (73 | 22.1%) and $15,000 to $17,499 for women (54 | 17.2%).
| Income | Male | Female |
| $2,499 or less | 25 (7.5%) | 14 (4.5%) |
| $2,500 to $4,999 | 10 (3.0%) | 0 (0.0%) |
| $5,000 to $7,499 | 0 (0.0%) | 40 (12.7%) |
| $7,500 to $9,999 | 0 (0.0%) | 16 (5.1%) |
| $10,000 to $12,499 | 0 (0.0%) | 9 (2.9%) |
| $12,500 to $14,999 | 0 (0.0%) | 8 (2.5%) |
| $15,000 to $17,499 | 0 (0.0%) | 54 (17.2%) |
| $17,500 to $19,999 | 0 (0.0%) | 0 (0.0%) |
| $20,000 to $22,499 | 16 (4.8%) | 0 (0.0%) |
| $22,500 to $24,999 | 0 (0.0%) | 14 (4.5%) |
| $25,000 to $29,999 | 36 (10.9%) | 34 (10.8%) |
| $30,000 to $34,999 | 0 (0.0%) | 9 (2.9%) |
| $35,000 to $39,999 | 0 (0.0%) | 21 (6.7%) |
| $40,000 to $44,999 | 5 (1.5%) | 11 (3.5%) |
| $45,000 to $49,999 | 23 (7.0%) | 11 (3.5%) |
| $50,000 to $54,999 | 31 (9.4%) | 10 (3.2%) |
| $55,000 to $64,999 | 51 (15.4%) | 13 (4.1%) |
| $65,000 to $74,999 | 18 (5.4%) | 19 (6.0%) |
| $75,000 to $99,999 | 73 (22.1%) | 11 (3.5%) |
| $100,000+ | 43 (13.0%) | 20 (6.4%) |
| Total | 331 (100.0%) | 314 (100.0%) |
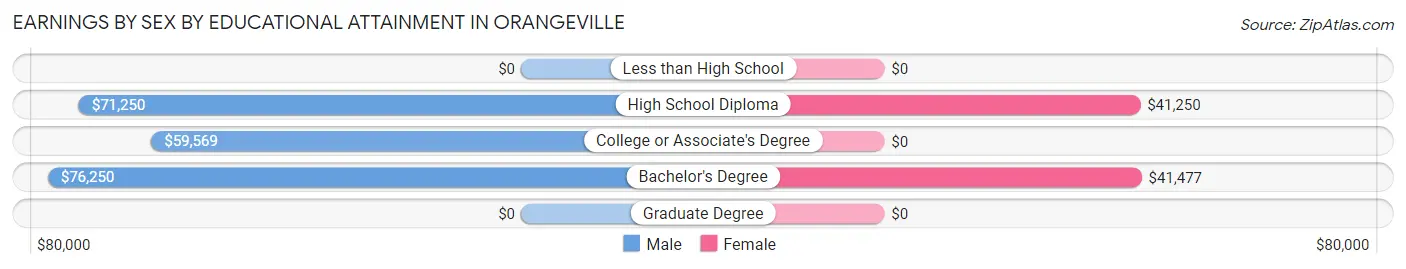
Earnings by Sex by Educational Attainment in Orangeville
Average earnings in Orangeville are $69,432 for men and $26,397 for women, a difference of 62.0%. Men with an educational attainment of bachelor's degree enjoy the highest average annual earnings of $76,250, while those with college or associate's degree education earn the least with $59,569. Women with an educational attainment of bachelor's degree earn the most with the average annual earnings of $41,477, while those with high school diploma education have the smallest earnings of $41,250.
| Educational Attainment | Male Income | Female Income |
| Less than High School | - | - |
| High School Diploma | $71,250 | $41,250 |
| College or Associate's Degree | $59,569 | $0 |
| Bachelor's Degree | $76,250 | $41,477 |
| Graduate Degree | - | - |
| Total | $69,432 | $26,397 |
Family Income in Orangeville
Family Income Brackets in Orangeville
According to the Orangeville family income data, there are 120 families falling into the $50,000 to $74,999 income range, which is the most common income bracket and makes up 30.7% of all families.
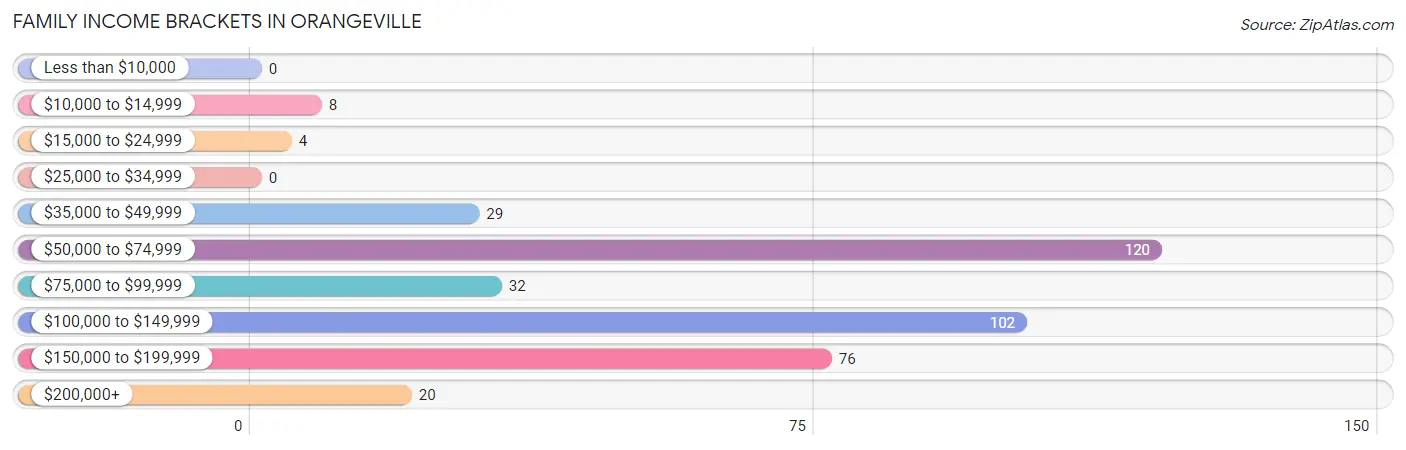
| Income Bracket | # Families | % Families |
| Less than $10,000 | 0 | 0.0% |
| $10,000 to $14,999 | 8 | 2.0% |
| $15,000 to $24,999 | 4 | 1.0% |
| $25,000 to $34,999 | 0 | 0.0% |
| $35,000 to $49,999 | 29 | 7.4% |
| $50,000 to $74,999 | 120 | 30.7% |
| $75,000 to $99,999 | 32 | 8.2% |
| $100,000 to $149,999 | 102 | 26.1% |
| $150,000 to $199,999 | 76 | 19.4% |
| $200,000+ | 20 | 5.1% |
Family Income by Famaliy Size in Orangeville
5-person families (36 | 9.2%) account for the highest median family income in Orangeville with $202,750 per family, while 3-person families (96 | 24.5%) have the highest median income of $51,198 per family member.
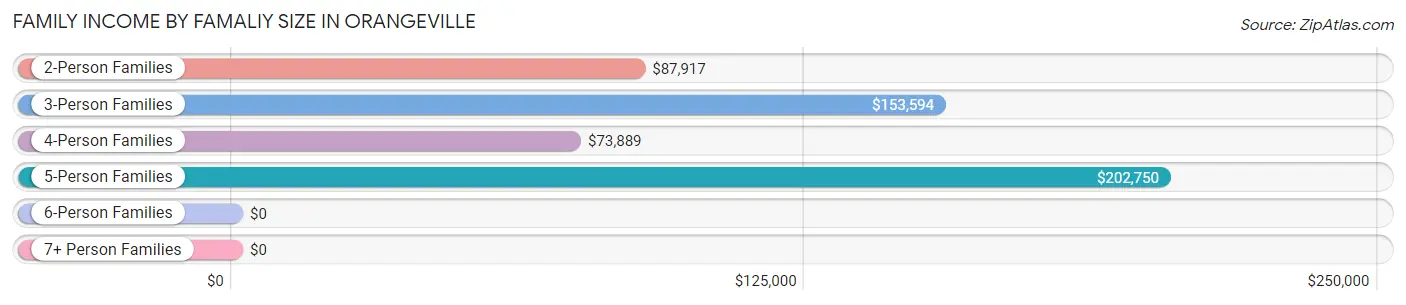
| Income Bracket | # Families | Median Income |
| 2-Person Families | 181 (46.3%) | $87,917 |
| 3-Person Families | 96 (24.5%) | $153,594 |
| 4-Person Families | 56 (14.3%) | $73,889 |
| 5-Person Families | 36 (9.2%) | $202,750 |
| 6-Person Families | 7 (1.8%) | $0 |
| 7+ Person Families | 15 (3.8%) | $0 |
| Total | 391 (100.0%) | $100,893 |
Family Income by Number of Earners in Orangeville
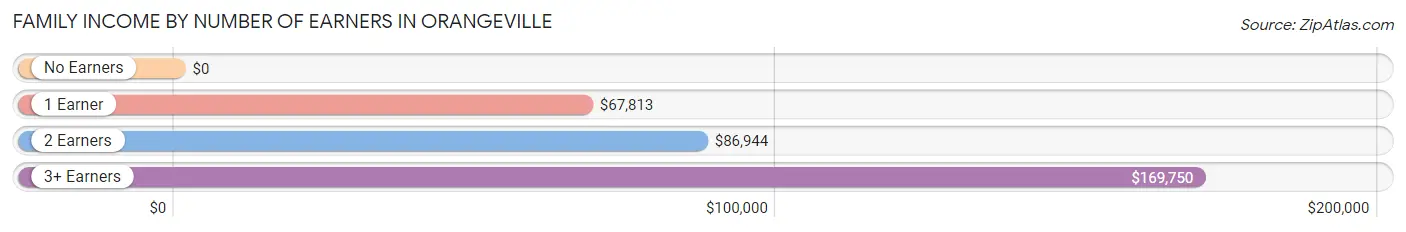
| Number of Earners | # Families | Median Income |
| No Earners | 70 (17.9%) | $0 |
| 1 Earner | 148 (37.9%) | $67,813 |
| 2 Earners | 132 (33.8%) | $86,944 |
| 3+ Earners | 41 (10.5%) | $169,750 |
| Total | 391 (100.0%) | $100,893 |
Household Income in Orangeville
Household Income Brackets in Orangeville
With 139 households falling in the category, the $50,000 to $74,999 income range is the most frequent in Orangeville, accounting for 28.7% of all households.
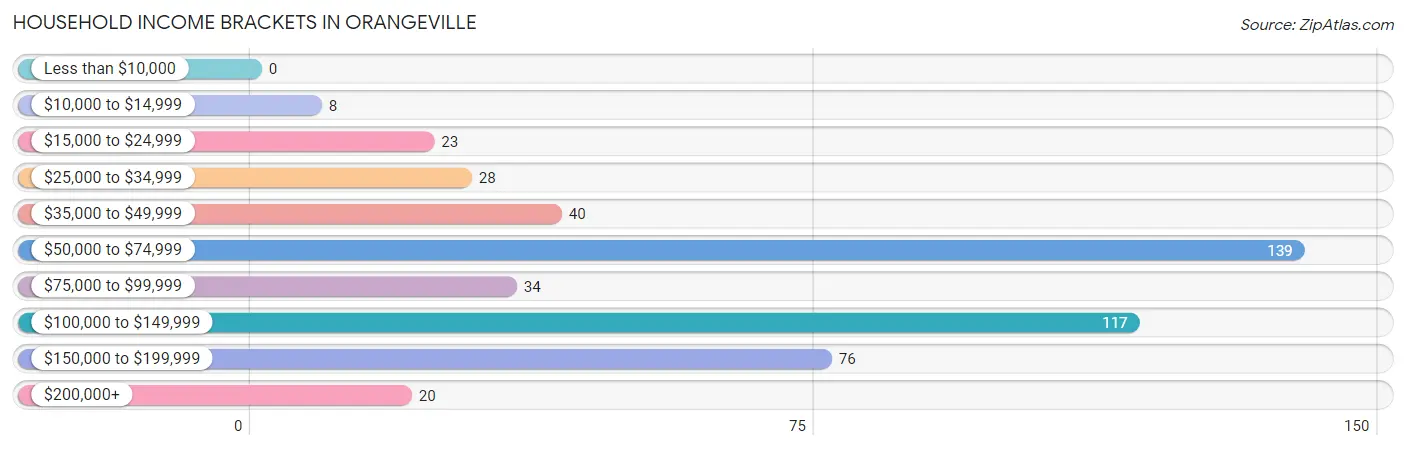
| Income Bracket | # Households | % Households |
| Less than $10,000 | 0 | 0.0% |
| $10,000 to $14,999 | 8 | 1.6% |
| $15,000 to $24,999 | 23 | 4.7% |
| $25,000 to $34,999 | 28 | 5.8% |
| $35,000 to $49,999 | 40 | 8.2% |
| $50,000 to $74,999 | 139 | 28.7% |
| $75,000 to $99,999 | 34 | 7.0% |
| $100,000 to $149,999 | 117 | 24.1% |
| $150,000 to $199,999 | 76 | 15.7% |
| $200,000+ | 20 | 4.1% |
Household Income by Householder Age in Orangeville
The median household income in Orangeville is $83,438, with the highest median household income of $120,714 found in the 45 to 64 years age bracket for the primary householder. A total of 208 households (42.9%) fall into this category. Meanwhile, the 15 to 24 years age bracket for the primary householder has the lowest median household income of $0, with 47 households (9.7%) in this group.
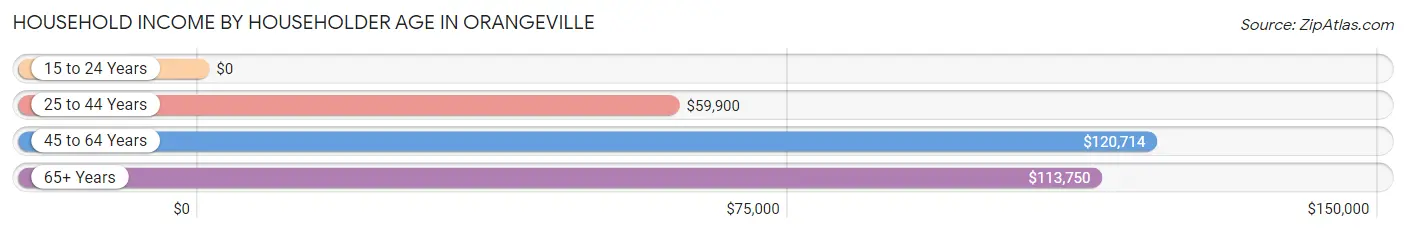
| Income Bracket | # Households | Median Income |
| 15 to 24 Years | 47 (9.7%) | $0 |
| 25 to 44 Years | 118 (24.3%) | $59,900 |
| 45 to 64 Years | 208 (42.9%) | $120,714 |
| 65+ Years | 112 (23.1%) | $113,750 |
| Total | 485 (100.0%) | $83,438 |
Poverty in Orangeville
Income Below Poverty by Sex and Age in Orangeville
With 5.6% poverty level for males and 11.2% for females among the residents of Orangeville, 12 to 14 year old males and 16 and 17 year old females are the most vulnerable to poverty, with 15 males (38.5%) and 20 females (100.0%) in their respective age groups living below the poverty level.
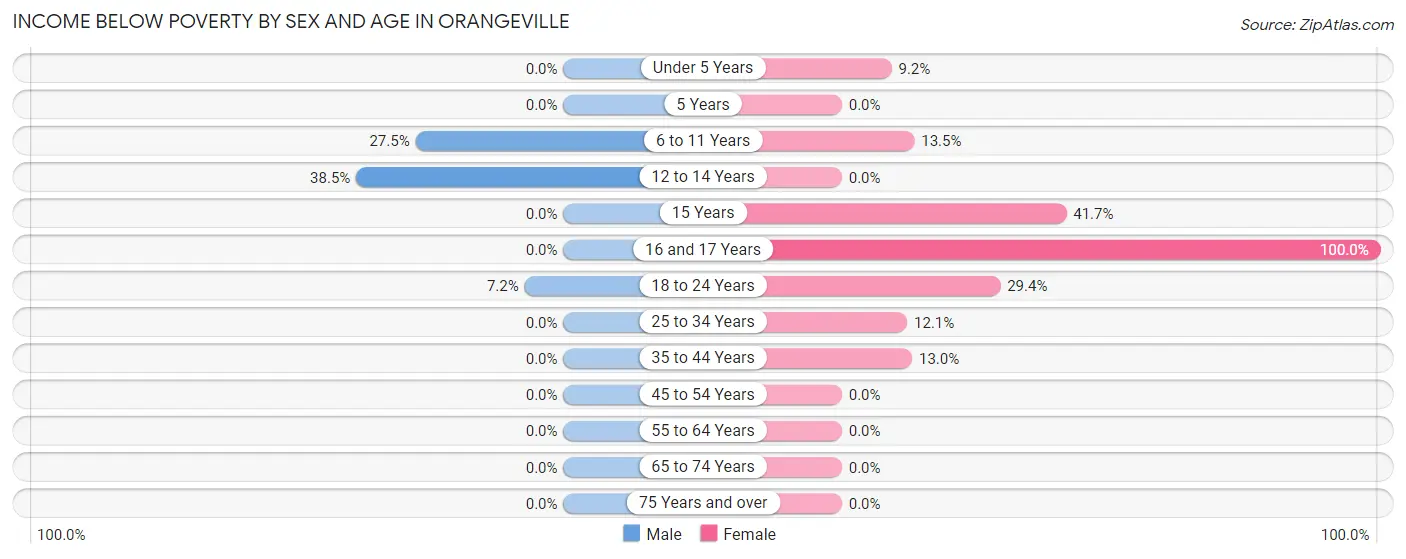
| Age Bracket | Male | Female |
| Under 5 Years | 0 (0.0%) | 6 (9.2%) |
| 5 Years | 0 (0.0%) | 0 (0.0%) |
| 6 to 11 Years | 14 (27.5%) | 7 (13.5%) |
| 12 to 14 Years | 15 (38.5%) | 0 (0.0%) |
| 15 Years | 0 (0.0%) | 10 (41.7%) |
| 16 and 17 Years | 0 (0.0%) | 20 (100.0%) |
| 18 to 24 Years | 8 (7.2%) | 15 (29.4%) |
| 25 to 34 Years | 0 (0.0%) | 8 (12.1%) |
| 35 to 44 Years | 0 (0.0%) | 9 (13.0%) |
| 45 to 54 Years | 0 (0.0%) | 0 (0.0%) |
| 55 to 64 Years | 0 (0.0%) | 0 (0.0%) |
| 65 to 74 Years | 0 (0.0%) | 0 (0.0%) |
| 75 Years and over | 0 (0.0%) | 0 (0.0%) |
| Total | 37 (5.6%) | 75 (11.2%) |
Income Above Poverty by Sex and Age in Orangeville
According to the poverty statistics in Orangeville, males aged under 5 years and females aged 5 years are the age groups that are most secure financially, with 100.0% of males and 100.0% of females in these age groups living above the poverty line.
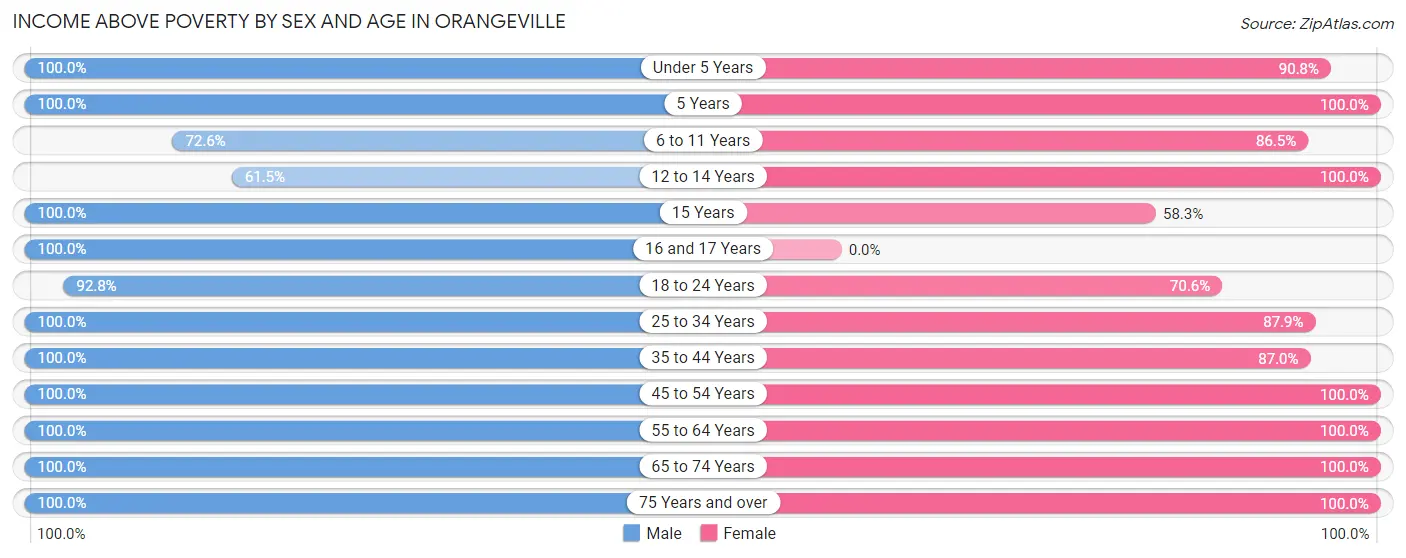
| Age Bracket | Male | Female |
| Under 5 Years | 43 (100.0%) | 59 (90.8%) |
| 5 Years | 10 (100.0%) | 15 (100.0%) |
| 6 to 11 Years | 37 (72.6%) | 45 (86.5%) |
| 12 to 14 Years | 24 (61.5%) | 11 (100.0%) |
| 15 Years | 34 (100.0%) | 14 (58.3%) |
| 16 and 17 Years | 12 (100.0%) | 0 (0.0%) |
| 18 to 24 Years | 103 (92.8%) | 36 (70.6%) |
| 25 to 34 Years | 43 (100.0%) | 58 (87.9%) |
| 35 to 44 Years | 62 (100.0%) | 60 (87.0%) |
| 45 to 54 Years | 65 (100.0%) | 86 (100.0%) |
| 55 to 64 Years | 106 (100.0%) | 100 (100.0%) |
| 65 to 74 Years | 77 (100.0%) | 68 (100.0%) |
| 75 Years and over | 14 (100.0%) | 45 (100.0%) |
| Total | 630 (94.5%) | 597 (88.8%) |
Income Below Poverty Among Married-Couple Families in Orangeville
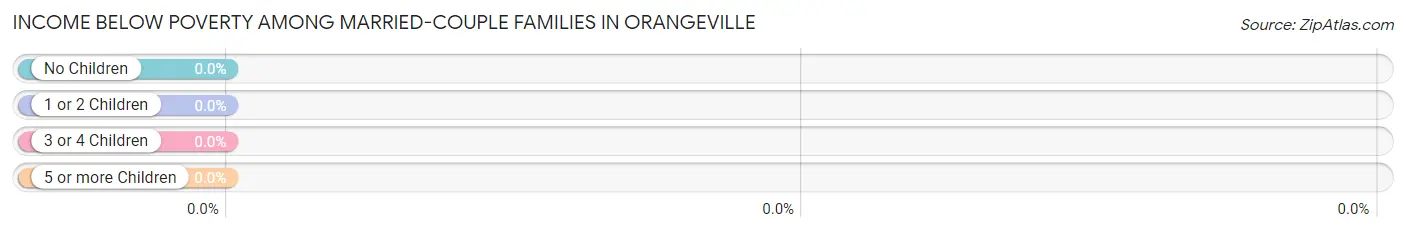
| Children | Above Poverty | Below Poverty |
| No Children | 197 (100.0%) | 0 (0.0%) |
| 1 or 2 Children | 117 (100.0%) | 0 (0.0%) |
| 3 or 4 Children | 11 (100.0%) | 0 (0.0%) |
| 5 or more Children | 6 (100.0%) | 0 (0.0%) |
| Total | 331 (100.0%) | 0 (0.0%) |
Income Below Poverty Among Single-Parent Households in Orangeville
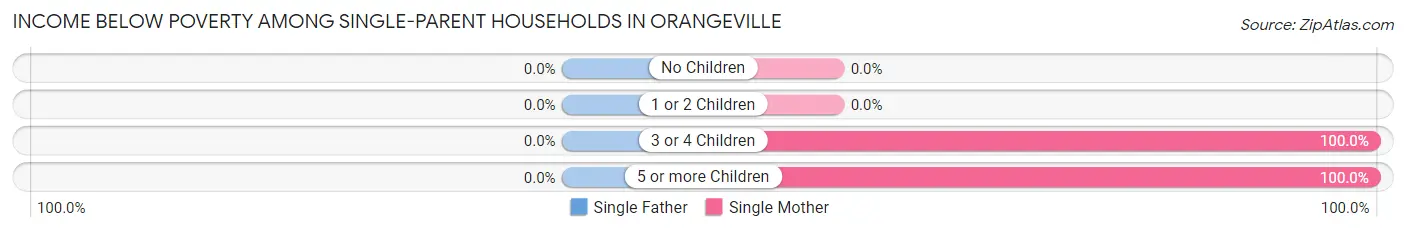
| Children | Single Father | Single Mother |
| No Children | 0 (0.0%) | 0 (0.0%) |
| 1 or 2 Children | 0 (0.0%) | 0 (0.0%) |
| 3 or 4 Children | 0 (0.0%) | 8 (100.0%) |
| 5 or more Children | 0 (0.0%) | 9 (100.0%) |
| Total | 0 (0.0%) | 17 (41.5%) |
Income Below Poverty Among Married-Couple vs Single-Parent Households in Orangeville
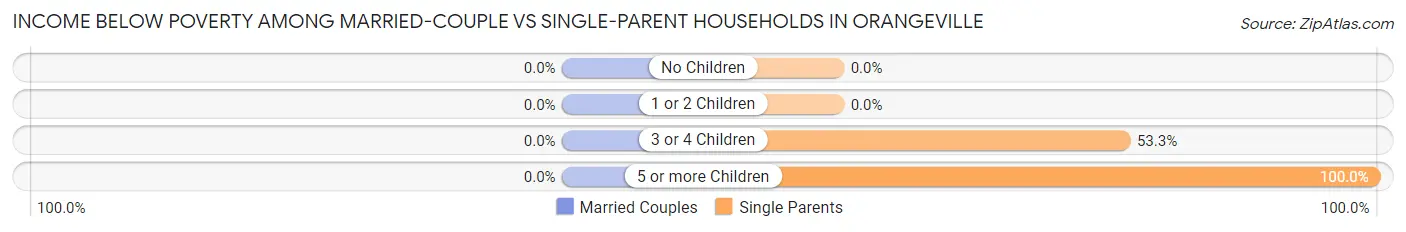
| Children | Married-Couple Families | Single-Parent Households |
| No Children | 0 (0.0%) | 0 (0.0%) |
| 1 or 2 Children | 0 (0.0%) | 0 (0.0%) |
| 3 or 4 Children | 0 (0.0%) | 8 (53.3%) |
| 5 or more Children | 0 (0.0%) | 9 (100.0%) |
| Total | 0 (0.0%) | 17 (28.3%) |
Race in Orangeville
The most populous races in Orangeville are White / Caucasian (1,273 | 95.0%), Two or more Races (67 | 5.0%), and Hispanic or Latino (47 | 3.5%).
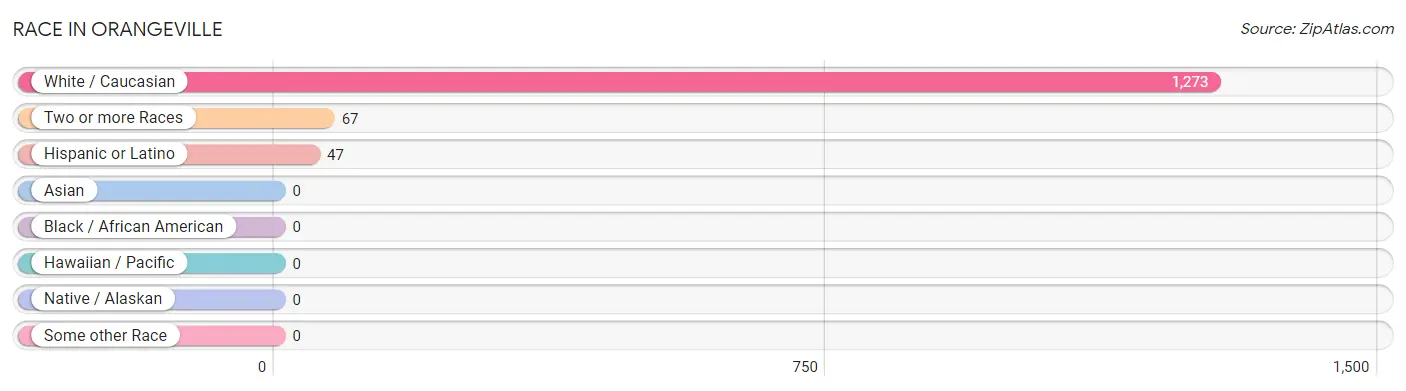
| Race | # Population | % Population |
| Asian | 0 | 0.0% |
| Black / African American | 0 | 0.0% |
| Hawaiian / Pacific | 0 | 0.0% |
| Hispanic or Latino | 47 | 3.5% |
| Native / Alaskan | 0 | 0.0% |
| White / Caucasian | 1,273 | 95.0% |
| Two or more Races | 67 | 5.0% |
| Some other Race | 0 | 0.0% |
| Total | 1,340 | 100.0% |
Ancestry in Orangeville
The most populous ancestries reported in Orangeville are English (523 | 39.0%), German (145 | 10.8%), Swedish (118 | 8.8%), European (88 | 6.6%), and Norwegian (88 | 6.6%), together accounting for 71.8% of all Orangeville residents.
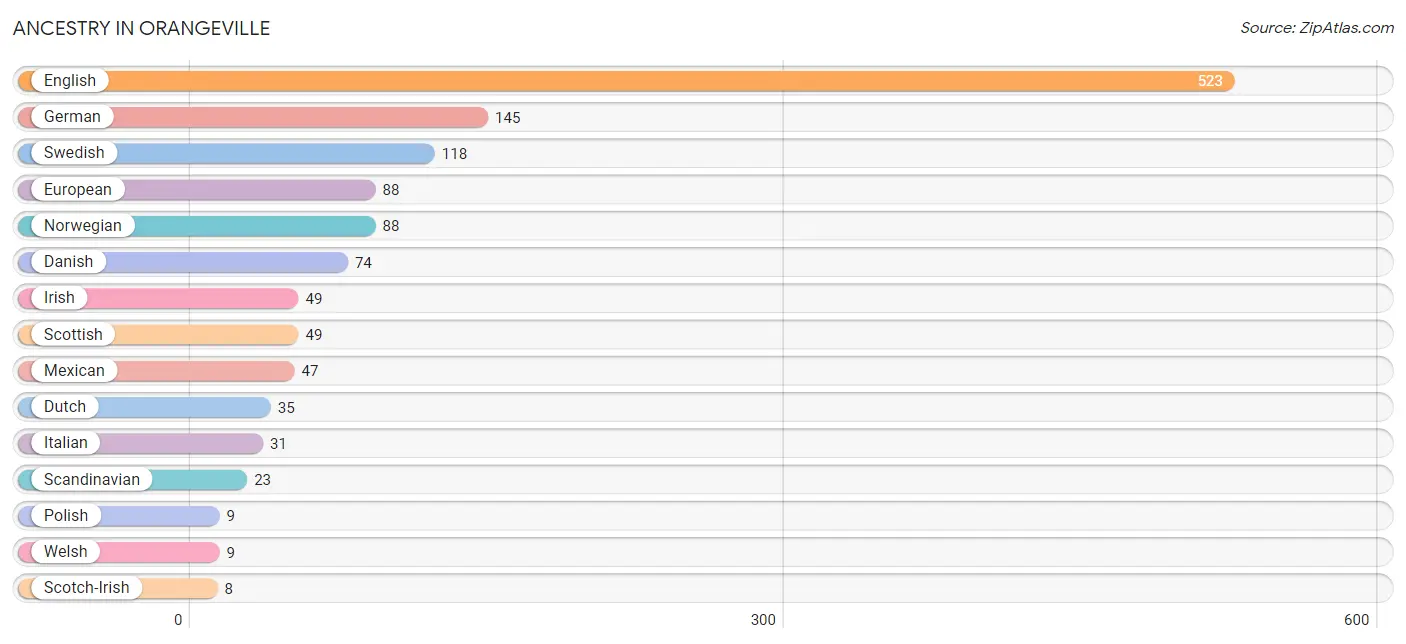
| Ancestry | # Population | % Population |
| Danish | 74 | 5.5% |
| Dutch | 35 | 2.6% |
| English | 523 | 39.0% |
| European | 88 | 6.6% |
| German | 145 | 10.8% |
| Irish | 49 | 3.7% |
| Italian | 31 | 2.3% |
| Mexican | 47 | 3.5% |
| Norwegian | 88 | 6.6% |
| Polish | 9 | 0.7% |
| Russian | 7 | 0.5% |
| Scandinavian | 23 | 1.7% |
| Scotch-Irish | 8 | 0.6% |
| Scottish | 49 | 3.7% |
| Swedish | 118 | 8.8% |
| Welsh | 9 | 0.7% | View All 16 Rows |
Immigrants in Orangeville

| Immigration Origin | # Population | % Population | View All 0 Rows |
Sex and Age in Orangeville
Sex and Age in Orangeville
The most populous age groups in Orangeville are 60 to 64 Years (94 | 14.1%) for men and 60 to 64 Years (78 | 11.6%) for women.
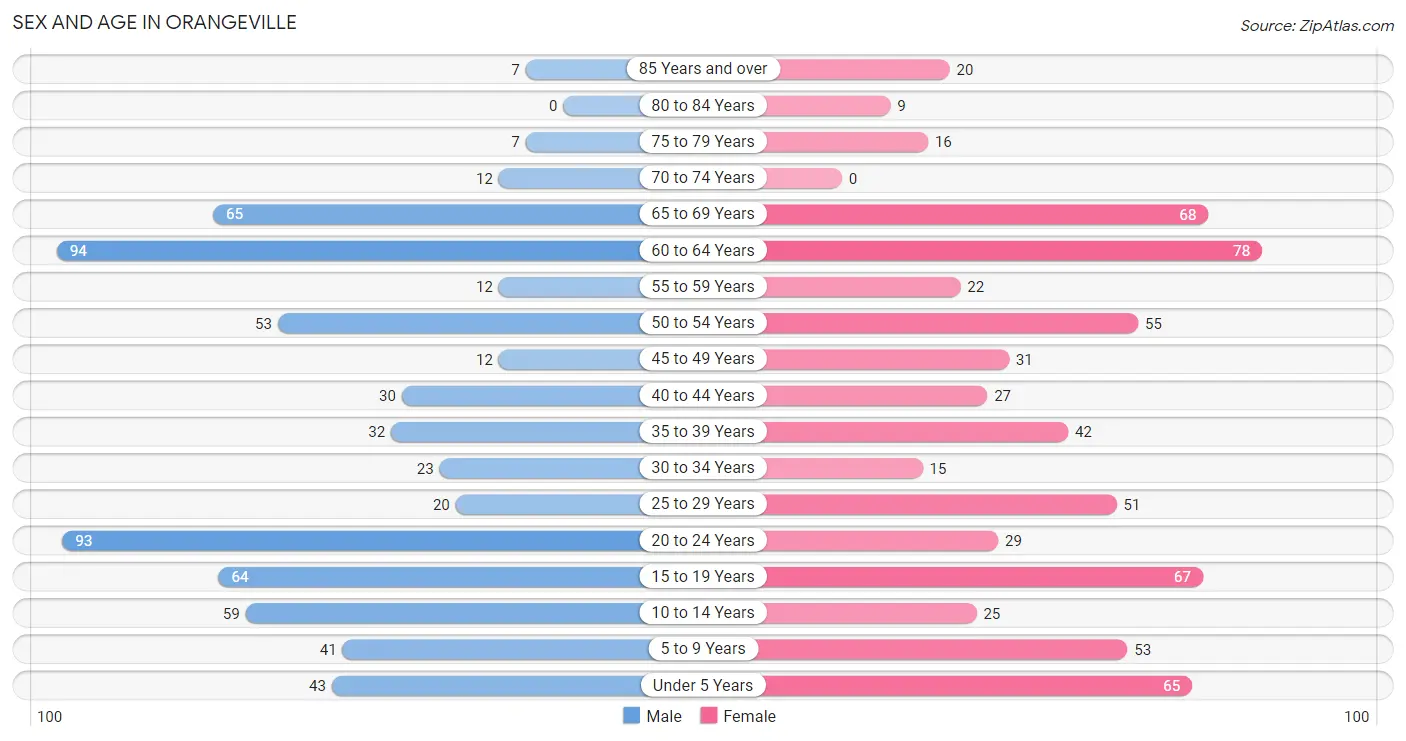
| Age Bracket | Male | Female |
| Under 5 Years | 43 (6.5%) | 65 (9.7%) |
| 5 to 9 Years | 41 (6.1%) | 53 (7.9%) |
| 10 to 14 Years | 59 (8.8%) | 25 (3.7%) |
| 15 to 19 Years | 64 (9.6%) | 67 (10.0%) |
| 20 to 24 Years | 93 (13.9%) | 29 (4.3%) |
| 25 to 29 Years | 20 (3.0%) | 51 (7.6%) |
| 30 to 34 Years | 23 (3.5%) | 15 (2.2%) |
| 35 to 39 Years | 32 (4.8%) | 42 (6.2%) |
| 40 to 44 Years | 30 (4.5%) | 27 (4.0%) |
| 45 to 49 Years | 12 (1.8%) | 31 (4.6%) |
| 50 to 54 Years | 53 (8.0%) | 55 (8.2%) |
| 55 to 59 Years | 12 (1.8%) | 22 (3.3%) |
| 60 to 64 Years | 94 (14.1%) | 78 (11.6%) |
| 65 to 69 Years | 65 (9.8%) | 68 (10.1%) |
| 70 to 74 Years | 12 (1.8%) | 0 (0.0%) |
| 75 to 79 Years | 7 (1.1%) | 16 (2.4%) |
| 80 to 84 Years | 0 (0.0%) | 9 (1.3%) |
| 85 Years and over | 7 (1.1%) | 20 (3.0%) |
| Total | 667 (100.0%) | 673 (100.0%) |
Families and Households in Orangeville
Median Family Size in Orangeville
The median family size in Orangeville is 3.15 persons per family, with single female/mother families (41 | 10.5%) accounting for the largest median family size of 3.68 persons per family. On the other hand, married-couple families (331 | 84.7%) represent the smallest median family size with 3.06 persons per family.
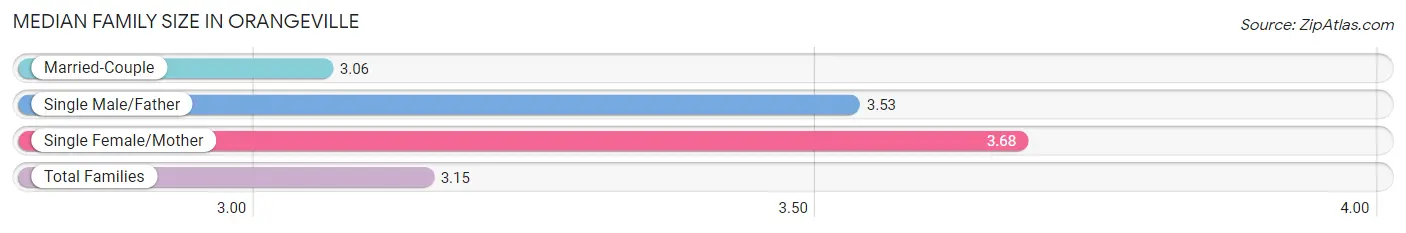
| Family Type | # Families | Family Size |
| Married-Couple | 331 (84.7%) | 3.06 |
| Single Male/Father | 19 (4.9%) | 3.53 |
| Single Female/Mother | 41 (10.5%) | 3.68 |
| Total Families | 391 (100.0%) | 3.15 |
Median Household Size in Orangeville
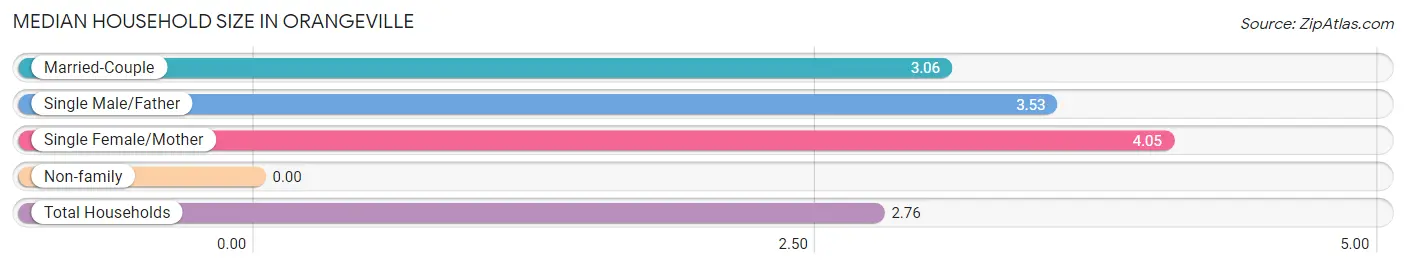
| Household Type | # Households | Household Size |
| Married-Couple | 331 (68.2%) | 3.06 |
| Single Male/Father | 19 (3.9%) | 3.53 |
| Single Female/Mother | 41 (8.5%) | 4.05 |
| Non-family | 94 (19.4%) | - |
| Total Households | 485 (100.0%) | 2.76 |
Household Size by Marriage Status in Orangeville
Out of a total of 485 households in Orangeville, 391 (80.6%) are family households, while 94 (19.4%) are nonfamily households. The most numerous type of family households are 2-person households, comprising 181, and the most common type of nonfamily households are 1-person households, comprising 94.
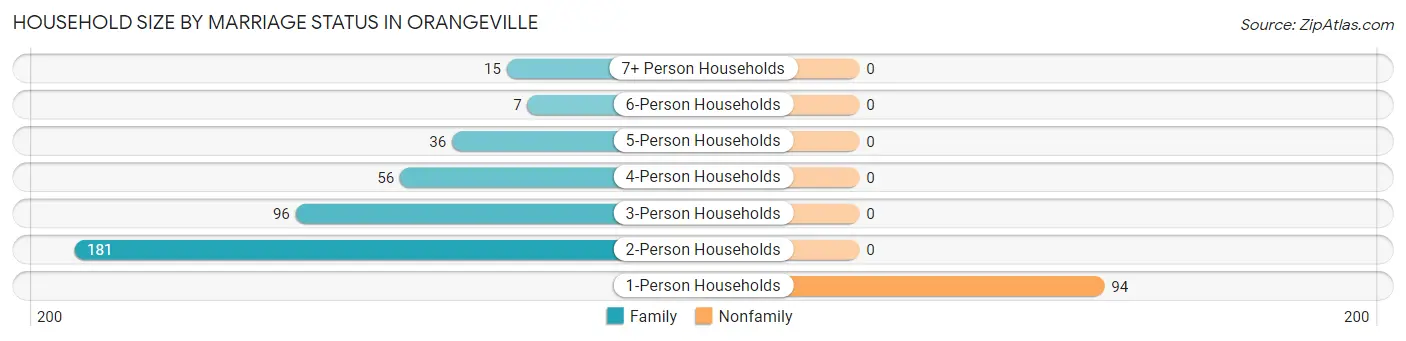
| Household Size | Family Households | Nonfamily Households |
| 1-Person Households | - | 94 (19.4%) |
| 2-Person Households | 181 (37.3%) | 0 (0.0%) |
| 3-Person Households | 96 (19.8%) | 0 (0.0%) |
| 4-Person Households | 56 (11.6%) | 0 (0.0%) |
| 5-Person Households | 36 (7.4%) | 0 (0.0%) |
| 6-Person Households | 7 (1.4%) | 0 (0.0%) |
| 7+ Person Households | 15 (3.1%) | 0 (0.0%) |
| Total | 391 (80.6%) | 94 (19.4%) |
Female Fertility in Orangeville
Fertility by Age in Orangeville
Average fertility rate in Orangeville is 35.0 births per 1,000 women. Women in the age bracket of 20 to 34 years have the highest fertility rate with 84.0 births per 1,000 women. Women in the age bracket of 20 to 34 years acount for 80.0% of all women with births.
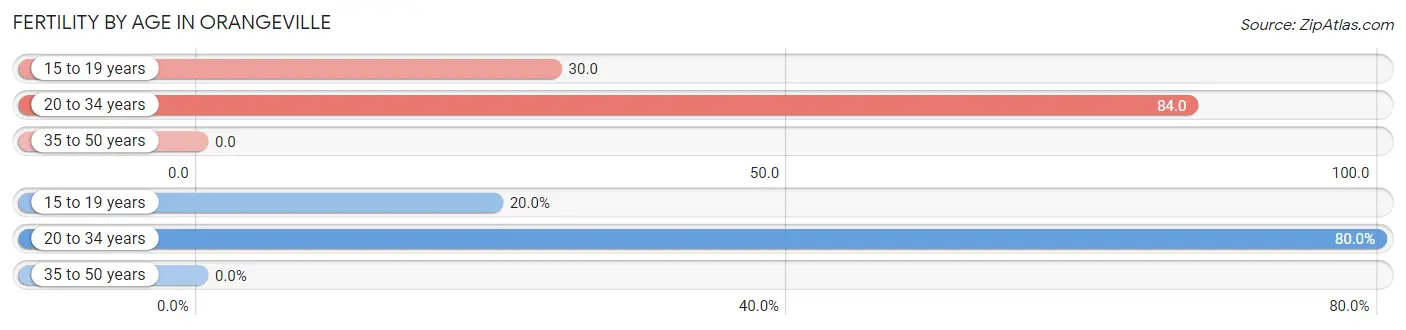
| Age Bracket | Women with Births | Births / 1,000 Women |
| 15 to 19 years | 2 (20.0%) | 30.0 |
| 20 to 34 years | 8 (80.0%) | 84.0 |
| 35 to 50 years | 0 (0.0%) | 0.0 |
| Total | 10 (100.0%) | 35.0 |
Fertility by Age by Marriage Status in Orangeville
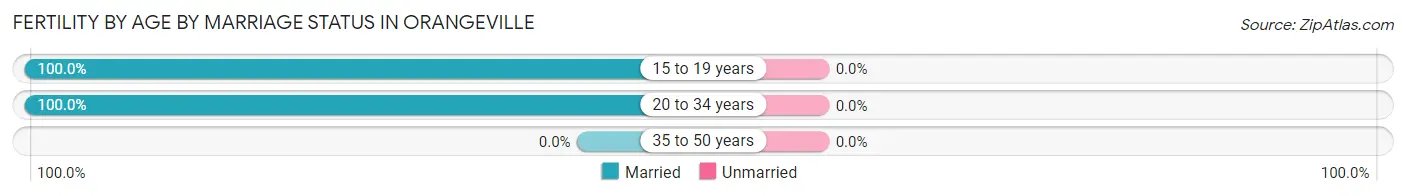
| Age Bracket | Married | Unmarried |
| 15 to 19 years | 2 (100.0%) | 0 (0.0%) |
| 20 to 34 years | 8 (100.0%) | 0 (0.0%) |
| 35 to 50 years | 0 (0.0%) | 0 (0.0%) |
| Total | 10 (100.0%) | 0 (0.0%) |
Fertility by Education in Orangeville
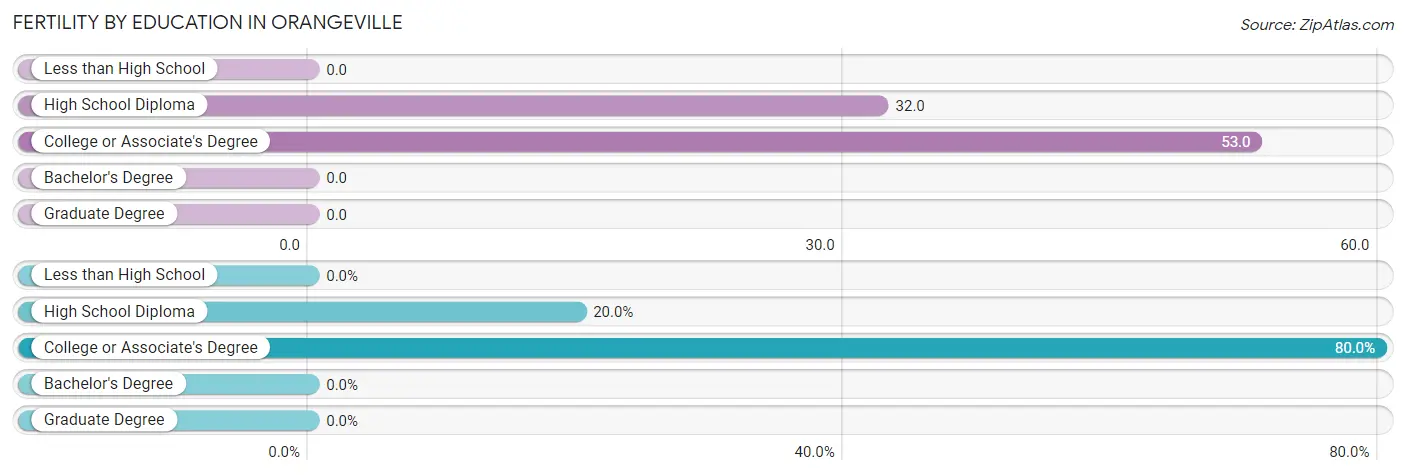
| Educational Attainment | Women with Births | Births / 1,000 Women |
| Less than High School | 0 (0.0%) | 0.0 |
| High School Diploma | 2 (20.0%) | 32.0 |
| College or Associate's Degree | 8 (80.0%) | 53.0 |
| Bachelor's Degree | 0 (0.0%) | 0.0 |
| Graduate Degree | 0 (0.0%) | 0.0 |
| Total | 10 (100.0%) | 35.0 |
Fertility by Education by Marriage Status in Orangeville
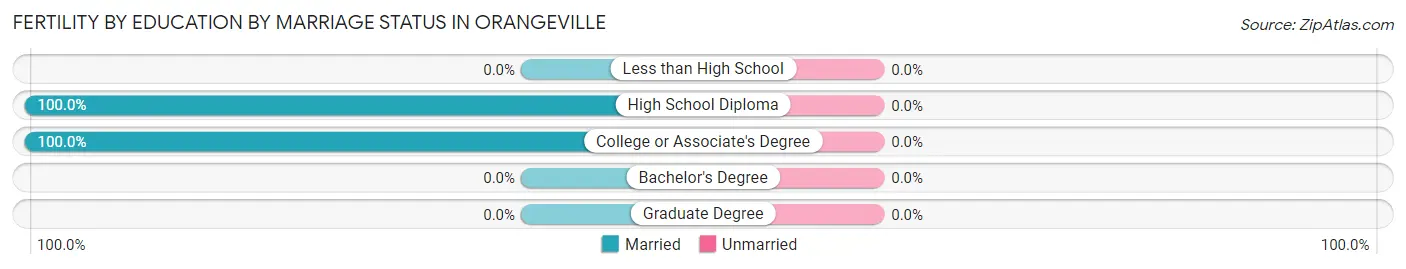
| Educational Attainment | Married | Unmarried |
| Less than High School | 0 (0.0%) | 0 (0.0%) |
| High School Diploma | 2 (100.0%) | 0 (0.0%) |
| College or Associate's Degree | 8 (100.0%) | 0 (0.0%) |
| Bachelor's Degree | 0 (0.0%) | 0 (0.0%) |
| Graduate Degree | 0 (0.0%) | 0 (0.0%) |
| Total | 10 (100.0%) | 0 (0.0%) |
Employment Characteristics in Orangeville
Employment by Class of Employer in Orangeville
Among the 583 employed individuals in Orangeville, private company employees (367 | 62.9%), local government employees (105 | 18.0%), and state government employees (47 | 8.1%) make up the most common classes of employment.
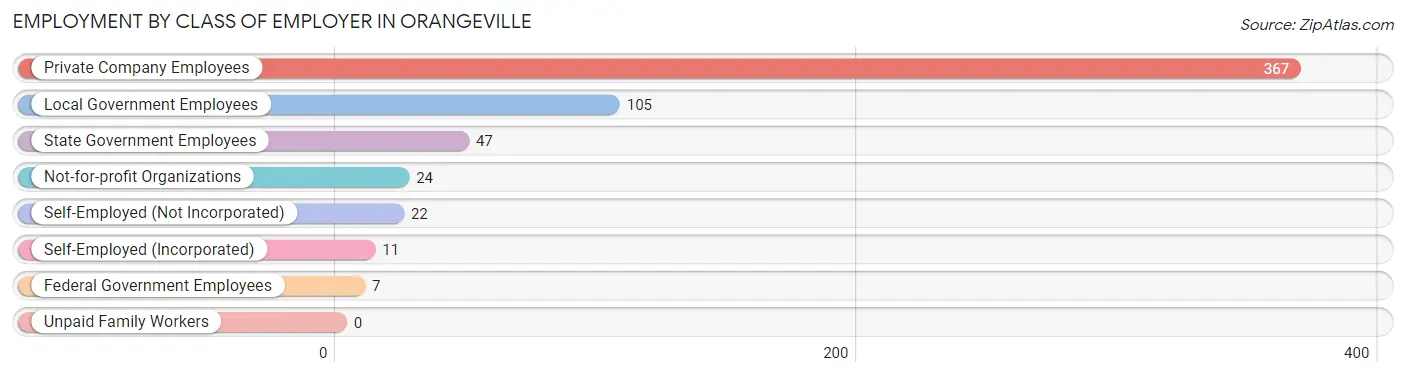
| Employer Class | # Employees | % Employees |
| Private Company Employees | 367 | 62.9% |
| Self-Employed (Incorporated) | 11 | 1.9% |
| Self-Employed (Not Incorporated) | 22 | 3.8% |
| Not-for-profit Organizations | 24 | 4.1% |
| Local Government Employees | 105 | 18.0% |
| State Government Employees | 47 | 8.1% |
| Federal Government Employees | 7 | 1.2% |
| Unpaid Family Workers | 0 | 0.0% |
| Total | 583 | 100.0% |
Employment Status by Age in Orangeville
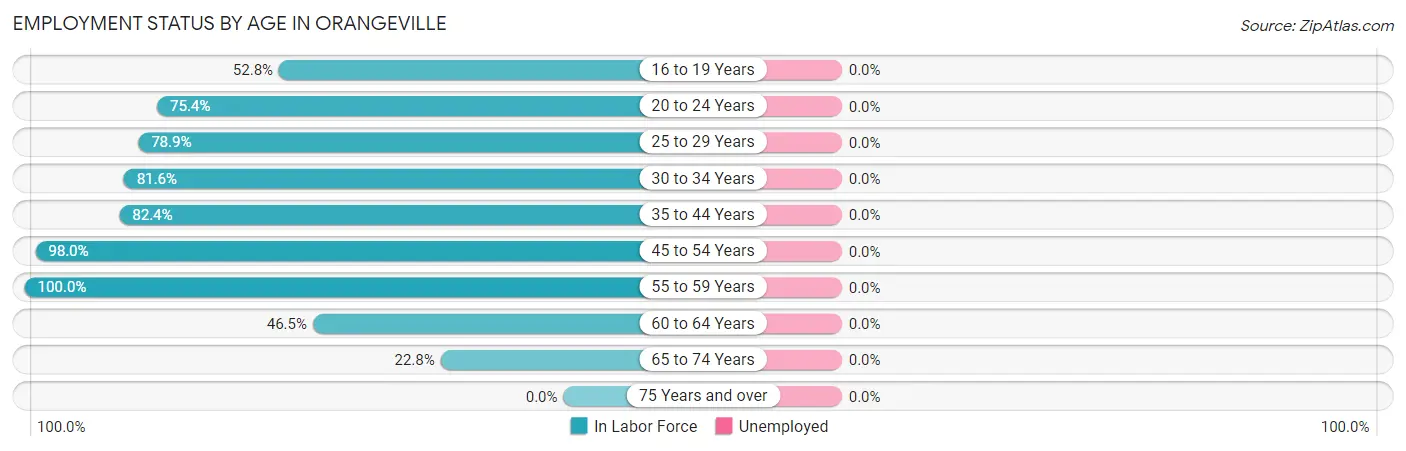
| Age Bracket | In Labor Force | Unemployed |
| 16 to 19 Years | 38 (52.8%) | 0 (0.0%) |
| 20 to 24 Years | 92 (75.4%) | 0 (0.0%) |
| 25 to 29 Years | 56 (78.9%) | 0 (0.0%) |
| 30 to 34 Years | 31 (81.6%) | 0 (0.0%) |
| 35 to 44 Years | 108 (82.4%) | 0 (0.0%) |
| 45 to 54 Years | 148 (98.0%) | 0 (0.0%) |
| 55 to 59 Years | 34 (100.0%) | 0 (0.0%) |
| 60 to 64 Years | 80 (46.5%) | 0 (0.0%) |
| 65 to 74 Years | 33 (22.8%) | 0 (0.0%) |
| 75 Years and over | 0 (0.0%) | 0 (0.0%) |
| Total | 620 (62.3%) | 0 (0.0%) |
Employment Status by Educational Attainment in Orangeville
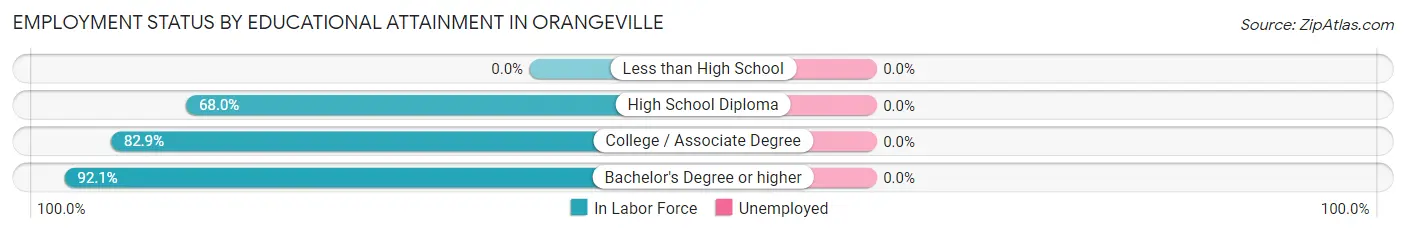
| Educational Attainment | In Labor Force | Unemployed |
| Less than High School | 0 (0.0%) | 0 (0.0%) |
| High School Diploma | 123 (68.0%) | 0 (0.0%) |
| College / Associate Degree | 276 (82.9%) | 0 (0.0%) |
| Bachelor's Degree or higher | 58 (92.1%) | 0 (0.0%) |
| Total | 457 (76.5%) | 0 (0.0%) |
Employment Occupations by Sex in Orangeville
Management, Business, Science and Arts Occupations
The most common Management, Business, Science and Arts occupations in Orangeville are Management (58 | 9.5%), Community & Social Service (45 | 7.3%), Education Instruction & Library (42 | 6.9%), Health Diagnosing & Treating (38 | 6.2%), and Health Technologists (27 | 4.4%).
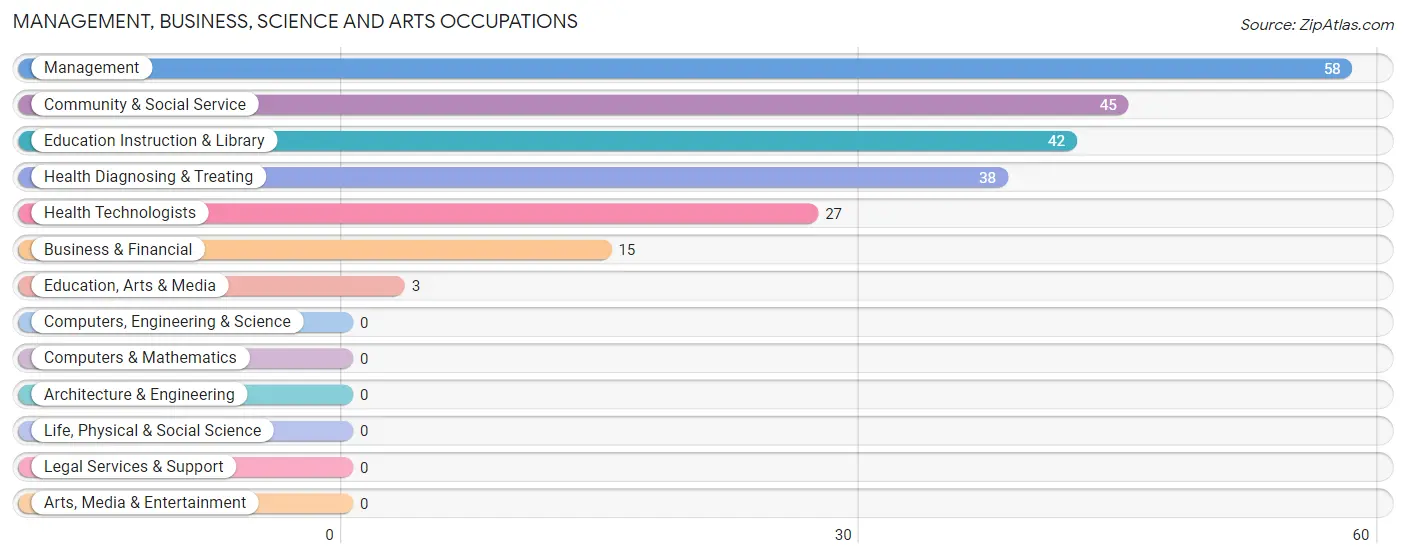
Management, Business, Science and Arts Occupations by Sex
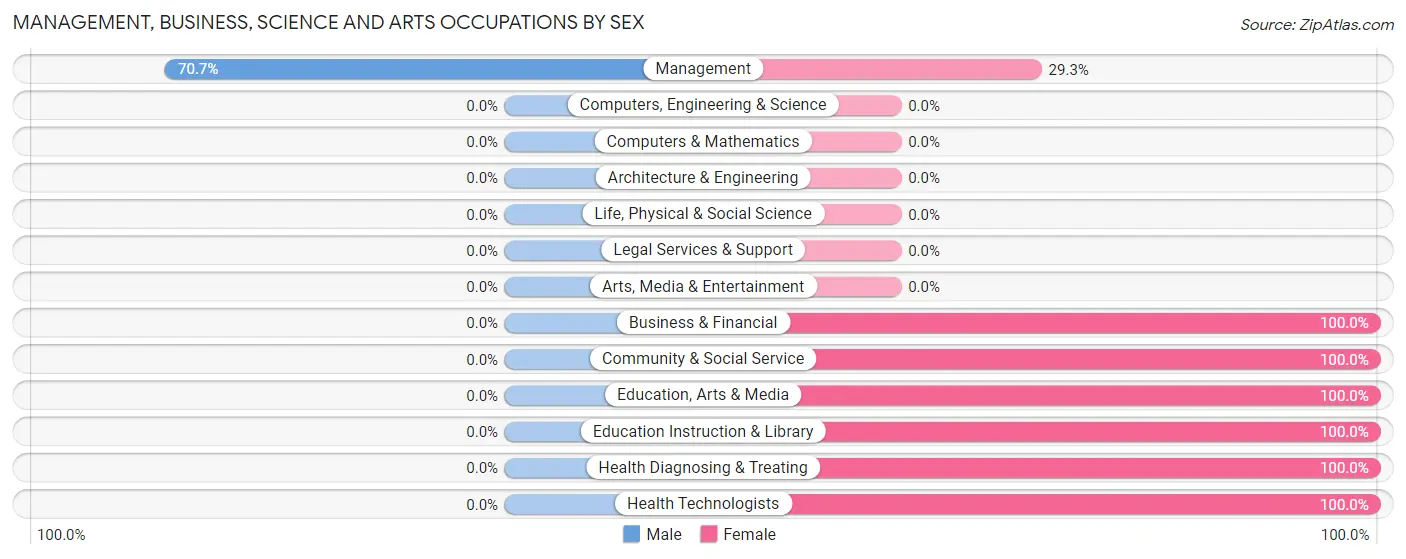
| Occupation | Male | Female |
| Management | 41 (70.7%) | 17 (29.3%) |
| Business & Financial | 0 (0.0%) | 15 (100.0%) |
| Computers, Engineering & Science | 0 (0.0%) | 0 (0.0%) |
| Computers & Mathematics | 0 (0.0%) | 0 (0.0%) |
| Architecture & Engineering | 0 (0.0%) | 0 (0.0%) |
| Life, Physical & Social Science | 0 (0.0%) | 0 (0.0%) |
| Community & Social Service | 0 (0.0%) | 45 (100.0%) |
| Education, Arts & Media | 0 (0.0%) | 3 (100.0%) |
| Legal Services & Support | 0 (0.0%) | 0 (0.0%) |
| Education Instruction & Library | 0 (0.0%) | 42 (100.0%) |
| Arts, Media & Entertainment | 0 (0.0%) | 0 (0.0%) |
| Health Diagnosing & Treating | 0 (0.0%) | 38 (100.0%) |
| Health Technologists | 0 (0.0%) | 27 (100.0%) |
| Total (Category) | 41 (26.3%) | 115 (73.7%) |
| Total (Overall) | 299 (48.8%) | 314 (51.2%) |
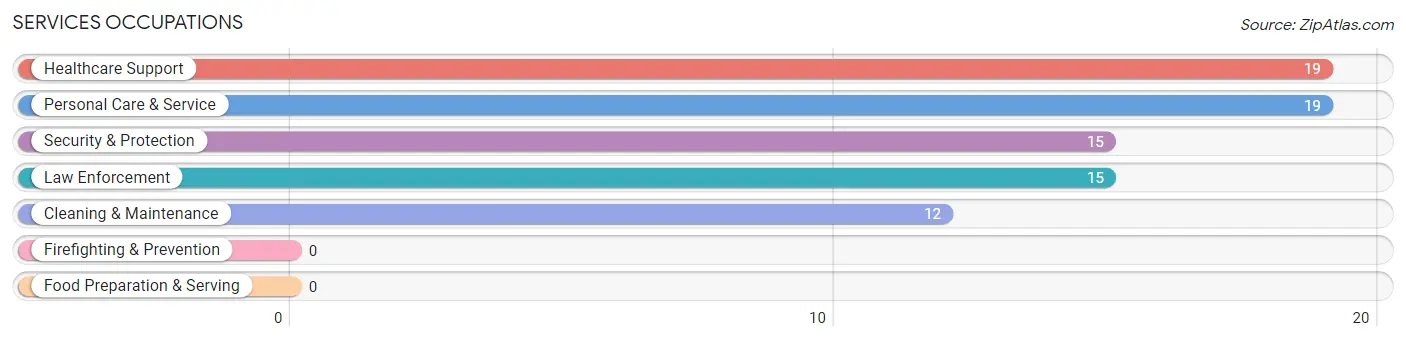
Services Occupations
The most common Services occupations in Orangeville are Healthcare Support (19 | 3.1%), Personal Care & Service (19 | 3.1%), Security & Protection (15 | 2.5%), Law Enforcement (15 | 2.5%), and Cleaning & Maintenance (12 | 2.0%).
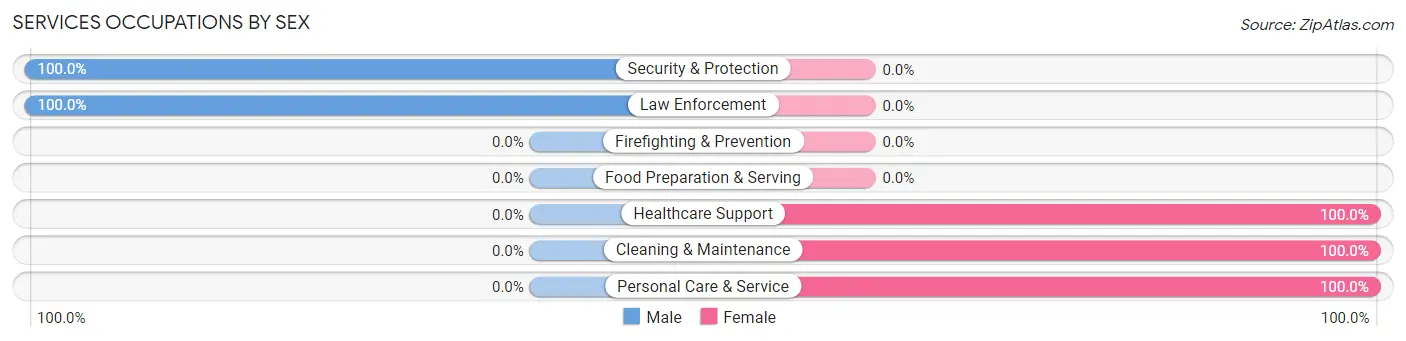
Services Occupations by Sex
Within the Services occupations in Orangeville, the most male-oriented occupations are Security & Protection (100.0%), and Law Enforcement (100.0%), while the most female-oriented occupations are Healthcare Support (100.0%), Cleaning & Maintenance (100.0%), and Personal Care & Service (100.0%).
| Occupation | Male | Female |
| Healthcare Support | 0 (0.0%) | 19 (100.0%) |
| Security & Protection | 15 (100.0%) | 0 (0.0%) |
| Firefighting & Prevention | 0 (0.0%) | 0 (0.0%) |
| Law Enforcement | 15 (100.0%) | 0 (0.0%) |
| Food Preparation & Serving | 0 (0.0%) | 0 (0.0%) |
| Cleaning & Maintenance | 0 (0.0%) | 12 (100.0%) |
| Personal Care & Service | 0 (0.0%) | 19 (100.0%) |
| Total (Category) | 15 (23.1%) | 50 (76.9%) |
| Total (Overall) | 299 (48.8%) | 314 (51.2%) |
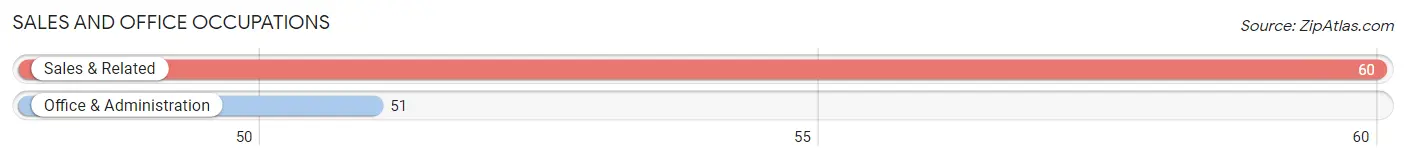
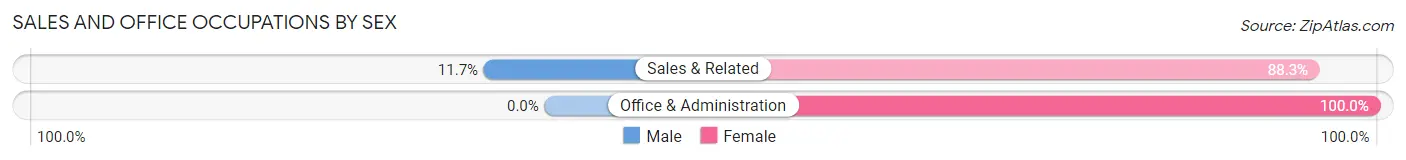
Sales and Office Occupations
The most common Sales and Office occupations in Orangeville are Sales & Related (60 | 9.8%), and Office & Administration (51 | 8.3%).
Sales and Office Occupations by Sex
| Occupation | Male | Female |
| Sales & Related | 7 (11.7%) | 53 (88.3%) |
| Office & Administration | 0 (0.0%) | 51 (100.0%) |
| Total (Category) | 7 (6.3%) | 104 (93.7%) |
| Total (Overall) | 299 (48.8%) | 314 (51.2%) |
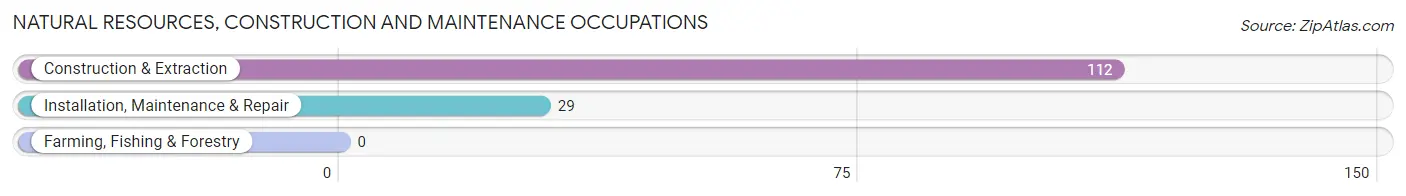
Natural Resources, Construction and Maintenance Occupations
The most common Natural Resources, Construction and Maintenance occupations in Orangeville are Construction & Extraction (112 | 18.3%), and Installation, Maintenance & Repair (29 | 4.7%).
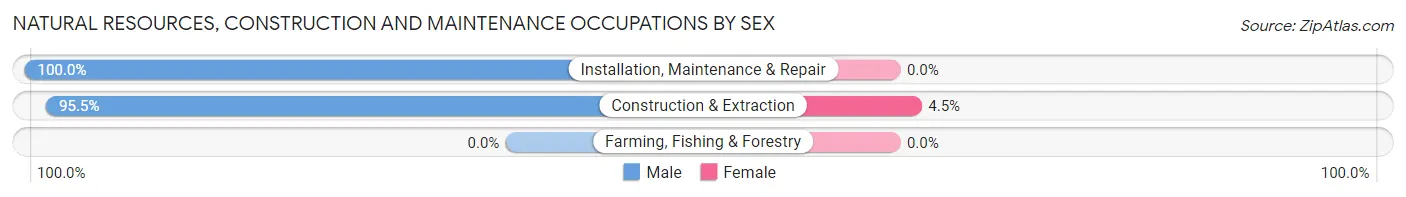
Natural Resources, Construction and Maintenance Occupations by Sex
| Occupation | Male | Female |
| Farming, Fishing & Forestry | 0 (0.0%) | 0 (0.0%) |
| Construction & Extraction | 107 (95.5%) | 5 (4.5%) |
| Installation, Maintenance & Repair | 29 (100.0%) | 0 (0.0%) |
| Total (Category) | 136 (96.5%) | 5 (3.5%) |
| Total (Overall) | 299 (48.8%) | 314 (51.2%) |
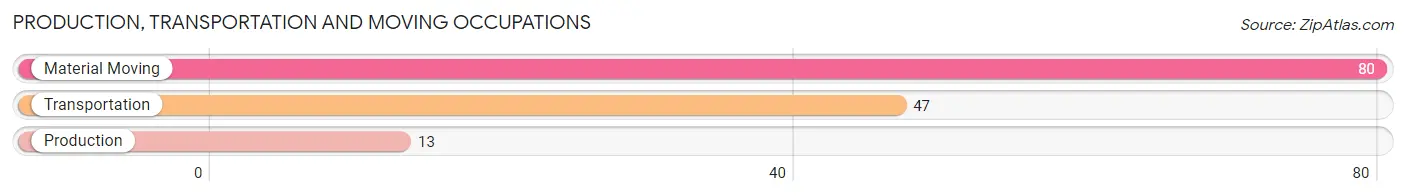
Production, Transportation and Moving Occupations
The most common Production, Transportation and Moving occupations in Orangeville are Material Moving (80 | 13.1%), Transportation (47 | 7.7%), and Production (13 | 2.1%).
Production, Transportation and Moving Occupations by Sex
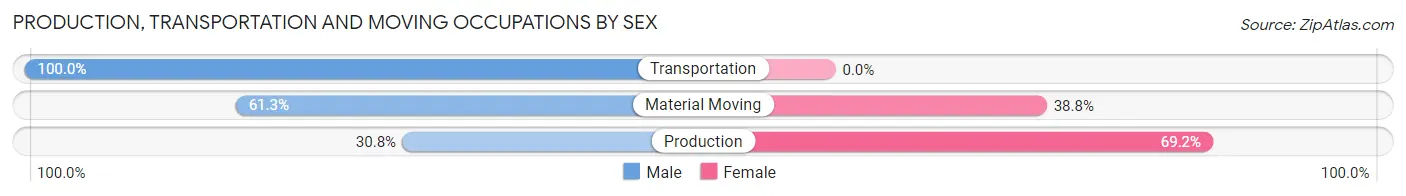
| Occupation | Male | Female |
| Production | 4 (30.8%) | 9 (69.2%) |
| Transportation | 47 (100.0%) | 0 (0.0%) |
| Material Moving | 49 (61.3%) | 31 (38.8%) |
| Total (Category) | 100 (71.4%) | 40 (28.6%) |
| Total (Overall) | 299 (48.8%) | 314 (51.2%) |
Employment Industries by Sex in Orangeville
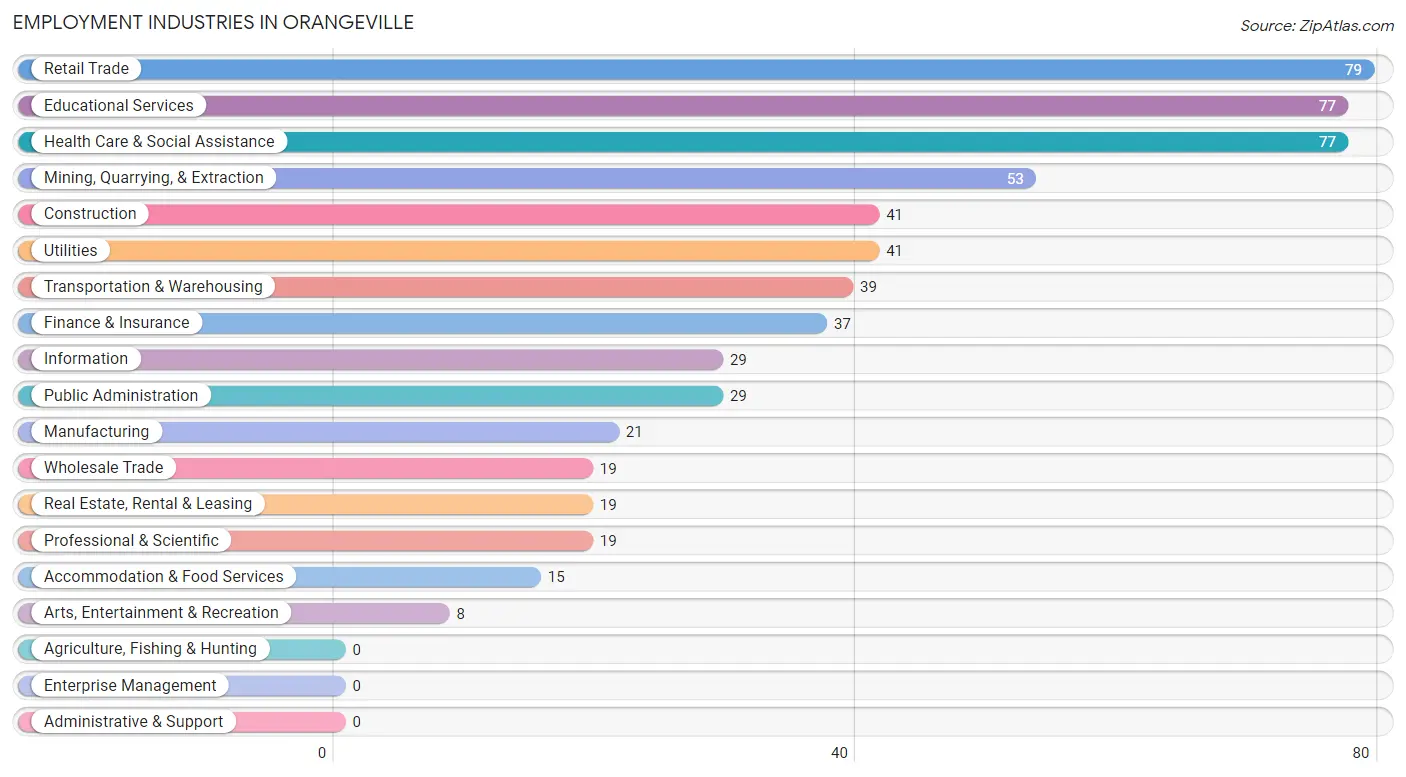
Employment Industries in Orangeville
The major employment industries in Orangeville include Retail Trade (79 | 12.9%), Educational Services (77 | 12.6%), Health Care & Social Assistance (77 | 12.6%), Mining, Quarrying, & Extraction (53 | 8.6%), and Construction (41 | 6.7%).
Employment Industries by Sex in Orangeville
The Orangeville industries that see more men than women are Construction (100.0%), Transportation & Warehousing (100.0%), and Utilities (100.0%), whereas the industries that tend to have a higher number of women are Finance & Insurance (100.0%), Health Care & Social Assistance (100.0%), and Educational Services (85.7%).
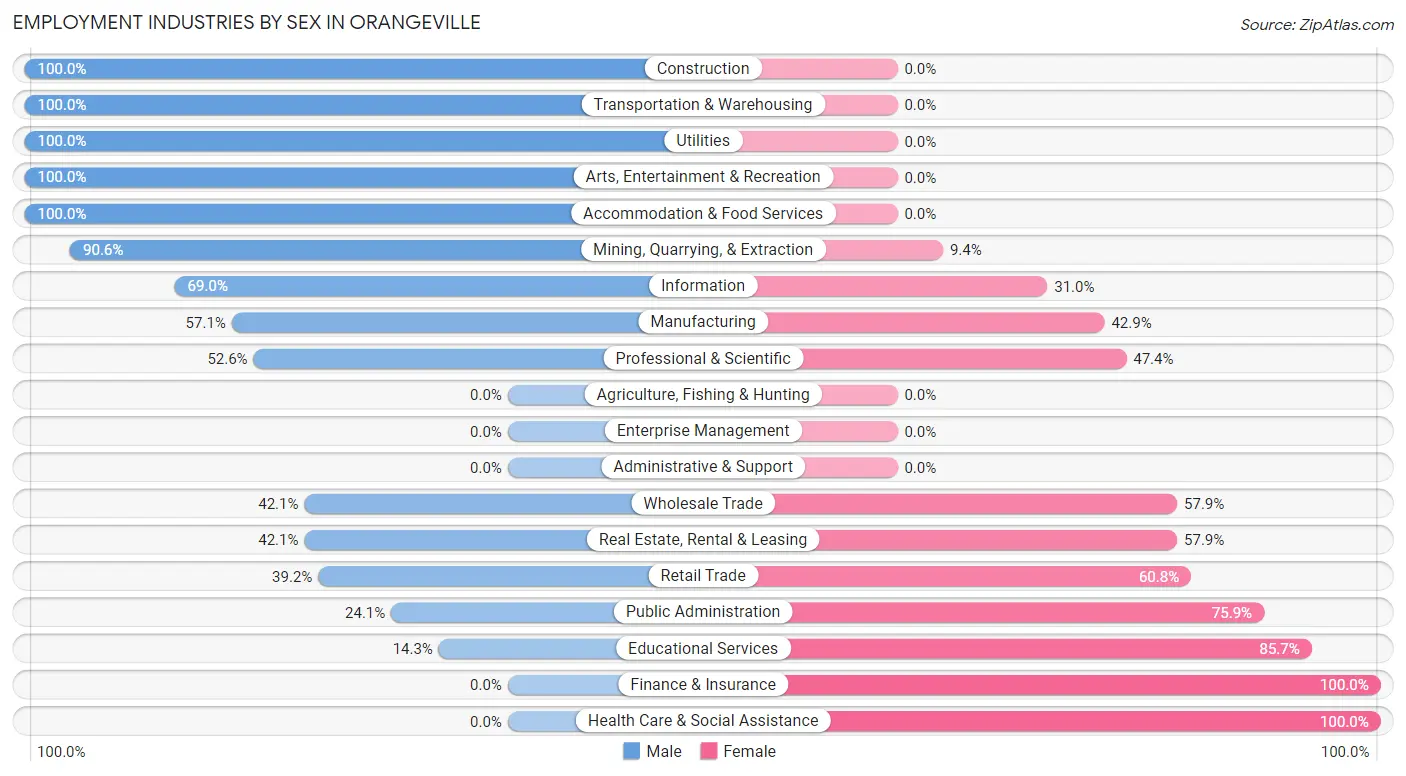
| Industry | Male | Female |
| Agriculture, Fishing & Hunting | 0 (0.0%) | 0 (0.0%) |
| Mining, Quarrying, & Extraction | 48 (90.6%) | 5 (9.4%) |
| Construction | 41 (100.0%) | 0 (0.0%) |
| Manufacturing | 12 (57.1%) | 9 (42.9%) |
| Wholesale Trade | 8 (42.1%) | 11 (57.9%) |
| Retail Trade | 31 (39.2%) | 48 (60.8%) |
| Transportation & Warehousing | 39 (100.0%) | 0 (0.0%) |
| Utilities | 41 (100.0%) | 0 (0.0%) |
| Information | 20 (69.0%) | 9 (31.0%) |
| Finance & Insurance | 0 (0.0%) | 37 (100.0%) |
| Real Estate, Rental & Leasing | 8 (42.1%) | 11 (57.9%) |
| Professional & Scientific | 10 (52.6%) | 9 (47.4%) |
| Enterprise Management | 0 (0.0%) | 0 (0.0%) |
| Administrative & Support | 0 (0.0%) | 0 (0.0%) |
| Educational Services | 11 (14.3%) | 66 (85.7%) |
| Health Care & Social Assistance | 0 (0.0%) | 77 (100.0%) |
| Arts, Entertainment & Recreation | 8 (100.0%) | 0 (0.0%) |
| Accommodation & Food Services | 15 (100.0%) | 0 (0.0%) |
| Public Administration | 7 (24.1%) | 22 (75.9%) |
| Total | 299 (48.8%) | 314 (51.2%) |
Education in Orangeville
School Enrollment in Orangeville
The most common levels of schooling among the 357 students in Orangeville are high school (143 | 40.1%), elementary school (71 | 19.9%), and middle school (48 | 13.5%).
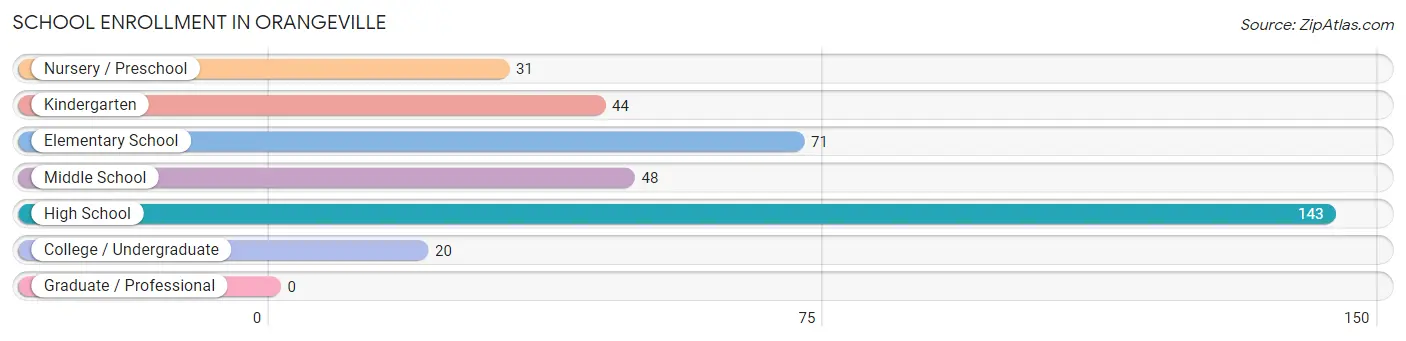
| School Level | # Students | % Students |
| Nursery / Preschool | 31 | 8.7% |
| Kindergarten | 44 | 12.3% |
| Elementary School | 71 | 19.9% |
| Middle School | 48 | 13.5% |
| High School | 143 | 40.1% |
| College / Undergraduate | 20 | 5.6% |
| Graduate / Professional | 0 | 0.0% |
| Total | 357 | 100.0% |
School Enrollment by Age by Funding Source in Orangeville
Out of a total of 357 students who are enrolled in schools in Orangeville, 9 (2.5%) attend a private institution, while the remaining 348 (97.5%) are enrolled in public schools. The age group of 3 to 4 year olds has the highest likelihood of being enrolled in private schools, with 8 (25.8% in the age bracket) enrolled. Conversely, the age group of 5 to 9 year old has the lowest likelihood of being enrolled in a private school, with 94 (100.0% in the age bracket) attending a public institution.
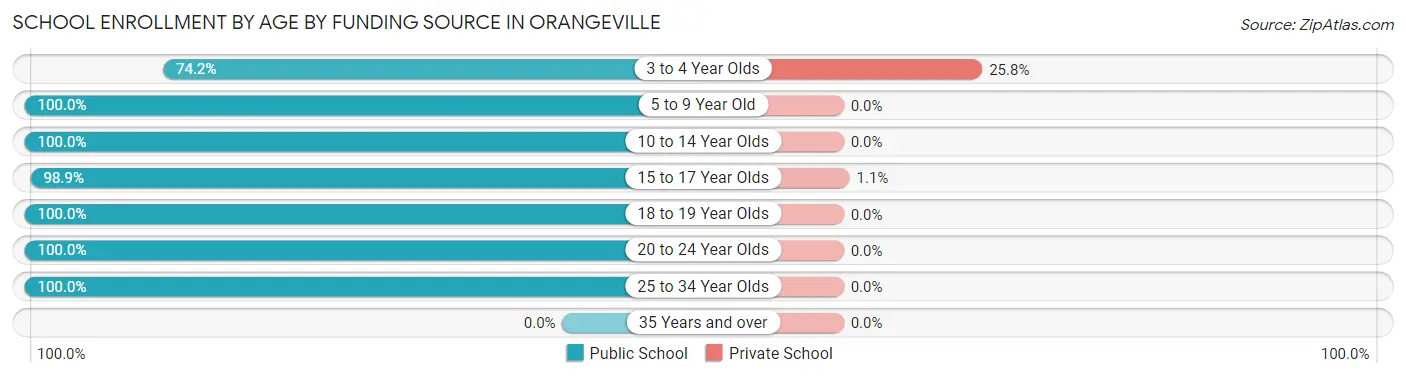
| Age Bracket | Public School | Private School |
| 3 to 4 Year Olds | 23 (74.2%) | 8 (25.8%) |
| 5 to 9 Year Old | 94 (100.0%) | 0 (0.0%) |
| 10 to 14 Year Olds | 76 (100.0%) | 0 (0.0%) |
| 15 to 17 Year Olds | 90 (98.9%) | 1 (1.1%) |
| 18 to 19 Year Olds | 30 (100.0%) | 0 (0.0%) |
| 20 to 24 Year Olds | 15 (100.0%) | 0 (0.0%) |
| 25 to 34 Year Olds | 20 (100.0%) | 0 (0.0%) |
| 35 Years and over | 0 (0.0%) | 0 (0.0%) |
| Total | 348 (97.5%) | 9 (2.5%) |
Educational Attainment by Field of Study in Orangeville
Education (91 | 54.8%), business (29 | 17.5%), arts & humanities (17 | 10.2%), multidisciplinary studies (11 | 6.6%), and bio, nature & agricultural (8 | 4.8%) are the most common fields of study among 166 individuals in Orangeville who have obtained a bachelor's degree or higher.
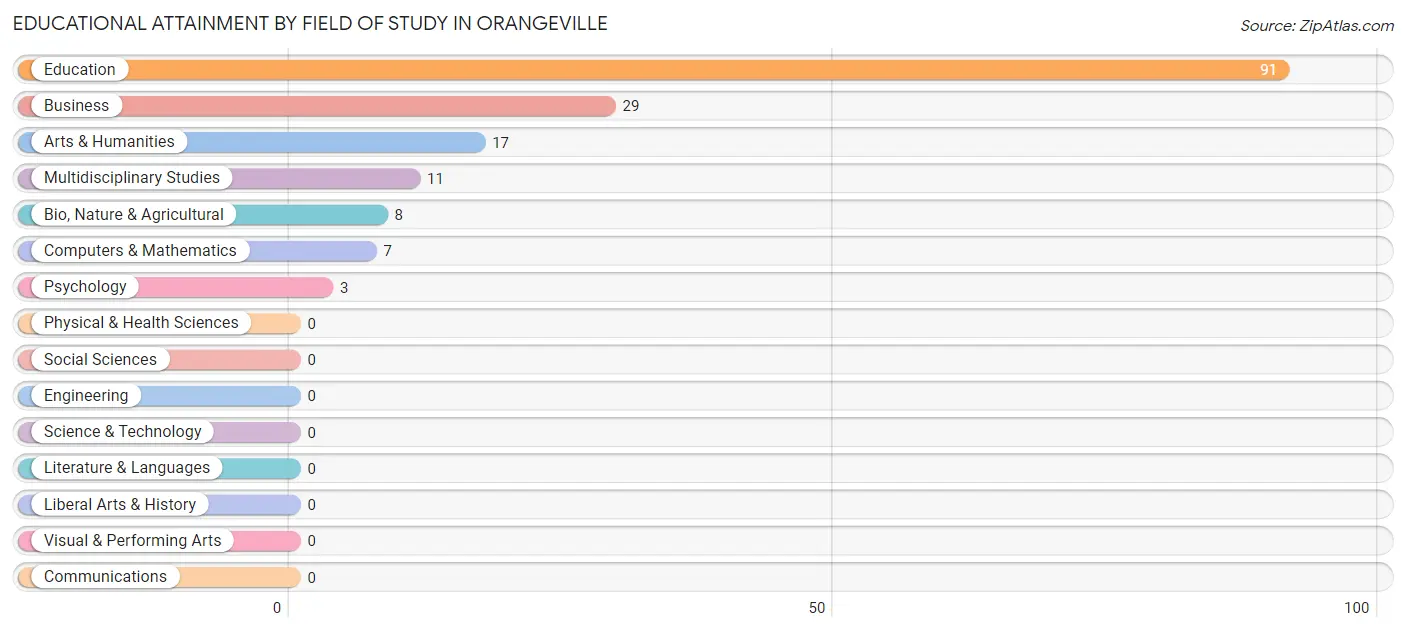
| Field of Study | # Graduates | % Graduates |
| Computers & Mathematics | 7 | 4.2% |
| Bio, Nature & Agricultural | 8 | 4.8% |
| Physical & Health Sciences | 0 | 0.0% |
| Psychology | 3 | 1.8% |
| Social Sciences | 0 | 0.0% |
| Engineering | 0 | 0.0% |
| Multidisciplinary Studies | 11 | 6.6% |
| Science & Technology | 0 | 0.0% |
| Business | 29 | 17.5% |
| Education | 91 | 54.8% |
| Literature & Languages | 0 | 0.0% |
| Liberal Arts & History | 0 | 0.0% |
| Visual & Performing Arts | 0 | 0.0% |
| Communications | 0 | 0.0% |
| Arts & Humanities | 17 | 10.2% |
| Total | 166 | 100.0% |
Transportation & Commute in Orangeville
Vehicle Availability by Sex in Orangeville
The most prevalent vehicle ownership categories in Orangeville are males with 2 vehicles (93, accounting for 33.1%) and females with 2 vehicles (91, making up 30.8%).
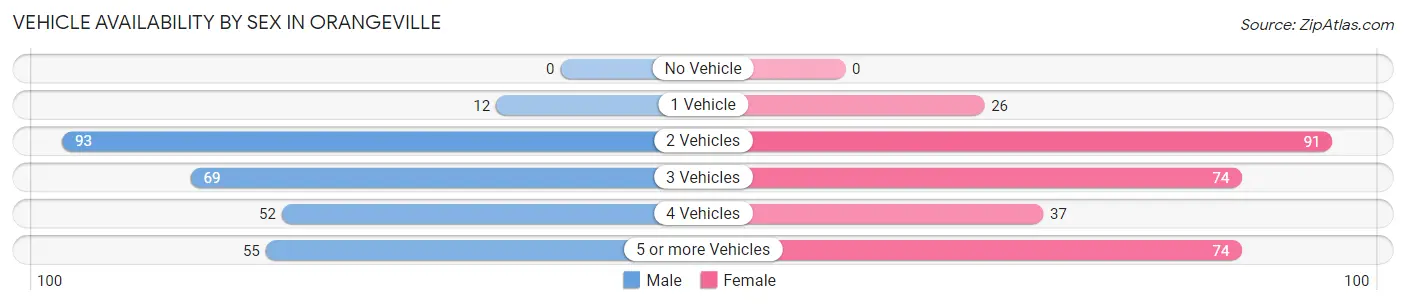
| Vehicles Available | Male | Female |
| No Vehicle | 0 (0.0%) | 0 (0.0%) |
| 1 Vehicle | 12 (4.3%) | 26 (8.6%) |
| 2 Vehicles | 93 (33.1%) | 91 (30.1%) |
| 3 Vehicles | 69 (24.6%) | 74 (24.5%) |
| 4 Vehicles | 52 (18.5%) | 37 (12.2%) |
| 5 or more Vehicles | 55 (19.6%) | 74 (24.5%) |
| Total | 281 (100.0%) | 302 (100.0%) |
Commute Time in Orangeville
The most frequently occuring commute durations in Orangeville are 5 to 9 minutes (230 commuters, 42.1%), 15 to 19 minutes (85 commuters, 15.6%), and 30 to 34 minutes (59 commuters, 10.8%).
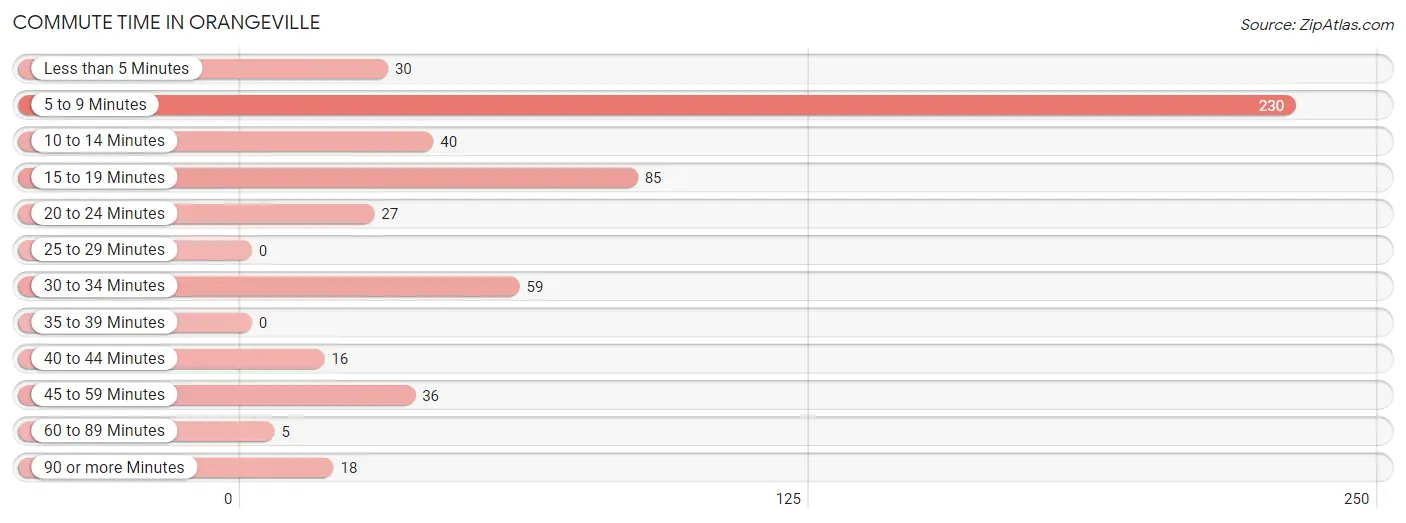
| Commute Time | # Commuters | % Commuters |
| Less than 5 Minutes | 30 | 5.5% |
| 5 to 9 Minutes | 230 | 42.1% |
| 10 to 14 Minutes | 40 | 7.3% |
| 15 to 19 Minutes | 85 | 15.6% |
| 20 to 24 Minutes | 27 | 5.0% |
| 25 to 29 Minutes | 0 | 0.0% |
| 30 to 34 Minutes | 59 | 10.8% |
| 35 to 39 Minutes | 0 | 0.0% |
| 40 to 44 Minutes | 16 | 2.9% |
| 45 to 59 Minutes | 36 | 6.6% |
| 60 to 89 Minutes | 5 | 0.9% |
| 90 or more Minutes | 18 | 3.3% |
Commute Time by Sex in Orangeville
The most common commute times in Orangeville are 5 to 9 minutes (71 commuters, 27.0%) for males and 5 to 9 minutes (159 commuters, 56.2%) for females.
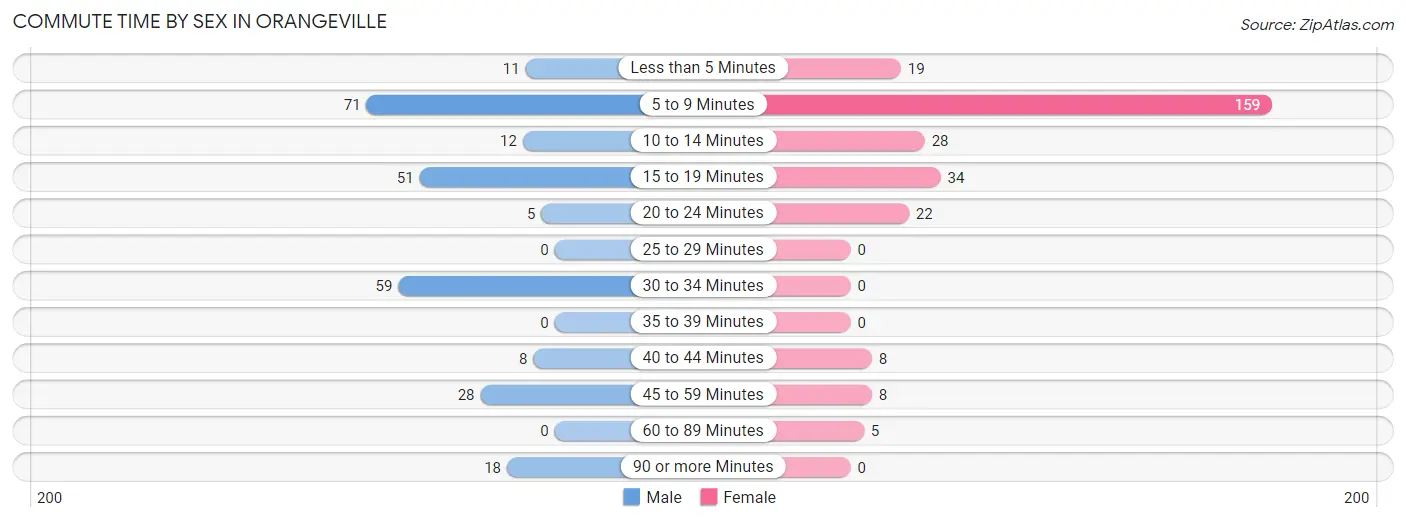
| Commute Time | Male | Female |
| Less than 5 Minutes | 11 (4.2%) | 19 (6.7%) |
| 5 to 9 Minutes | 71 (27.0%) | 159 (56.2%) |
| 10 to 14 Minutes | 12 (4.6%) | 28 (9.9%) |
| 15 to 19 Minutes | 51 (19.4%) | 34 (12.0%) |
| 20 to 24 Minutes | 5 (1.9%) | 22 (7.8%) |
| 25 to 29 Minutes | 0 (0.0%) | 0 (0.0%) |
| 30 to 34 Minutes | 59 (22.4%) | 0 (0.0%) |
| 35 to 39 Minutes | 0 (0.0%) | 0 (0.0%) |
| 40 to 44 Minutes | 8 (3.0%) | 8 (2.8%) |
| 45 to 59 Minutes | 28 (10.6%) | 8 (2.8%) |
| 60 to 89 Minutes | 0 (0.0%) | 5 (1.8%) |
| 90 or more Minutes | 18 (6.8%) | 0 (0.0%) |
Time of Departure to Work by Sex in Orangeville
The most frequent times of departure to work in Orangeville are 6:30 AM to 6:59 AM (59, 22.4%) for males and 12:00 AM to 4:59 AM (56, 19.8%) for females.
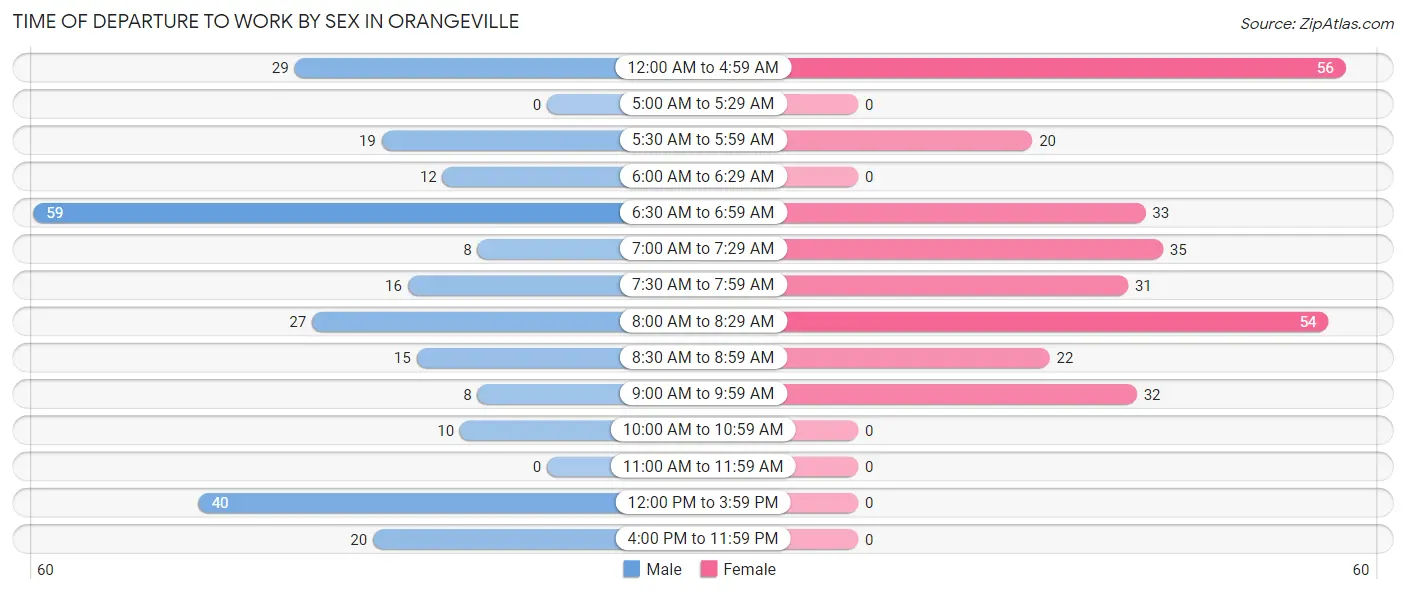
| Time of Departure | Male | Female |
| 12:00 AM to 4:59 AM | 29 (11.0%) | 56 (19.8%) |
| 5:00 AM to 5:29 AM | 0 (0.0%) | 0 (0.0%) |
| 5:30 AM to 5:59 AM | 19 (7.2%) | 20 (7.1%) |
| 6:00 AM to 6:29 AM | 12 (4.6%) | 0 (0.0%) |
| 6:30 AM to 6:59 AM | 59 (22.4%) | 33 (11.7%) |
| 7:00 AM to 7:29 AM | 8 (3.0%) | 35 (12.4%) |
| 7:30 AM to 7:59 AM | 16 (6.1%) | 31 (11.0%) |
| 8:00 AM to 8:29 AM | 27 (10.3%) | 54 (19.1%) |
| 8:30 AM to 8:59 AM | 15 (5.7%) | 22 (7.8%) |
| 9:00 AM to 9:59 AM | 8 (3.0%) | 32 (11.3%) |
| 10:00 AM to 10:59 AM | 10 (3.8%) | 0 (0.0%) |
| 11:00 AM to 11:59 AM | 0 (0.0%) | 0 (0.0%) |
| 12:00 PM to 3:59 PM | 40 (15.2%) | 0 (0.0%) |
| 4:00 PM to 11:59 PM | 20 (7.6%) | 0 (0.0%) |
| Total | 263 (100.0%) | 283 (100.0%) |
Housing Occupancy in Orangeville
Occupancy by Ownership in Orangeville
Of the total 485 dwellings in Orangeville, owner-occupied units account for 399 (82.3%), while renter-occupied units make up 86 (17.7%).
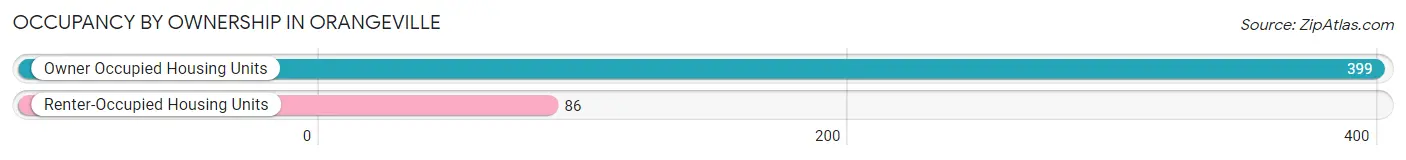
| Occupancy | # Housing Units | % Housing Units |
| Owner Occupied Housing Units | 399 | 82.3% |
| Renter-Occupied Housing Units | 86 | 17.7% |
| Total Occupied Housing Units | 485 | 100.0% |
Occupancy by Household Size in Orangeville
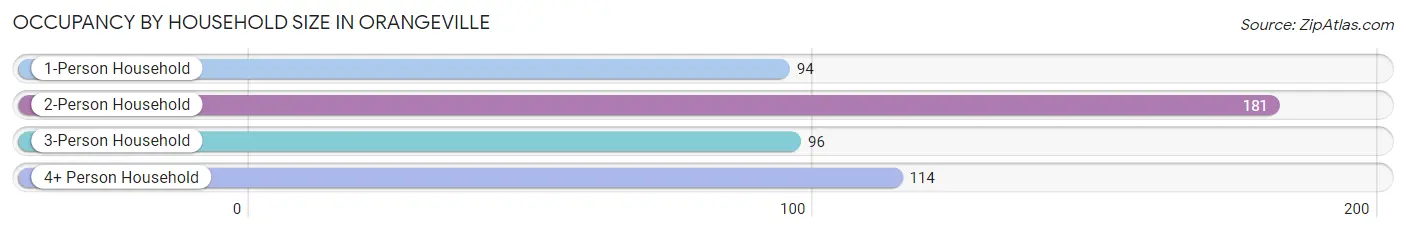
| Household Size | # Housing Units | % Housing Units |
| 1-Person Household | 94 | 19.4% |
| 2-Person Household | 181 | 37.3% |
| 3-Person Household | 96 | 19.8% |
| 4+ Person Household | 114 | 23.5% |
| Total Housing Units | 485 | 100.0% |
Occupancy by Ownership by Household Size in Orangeville
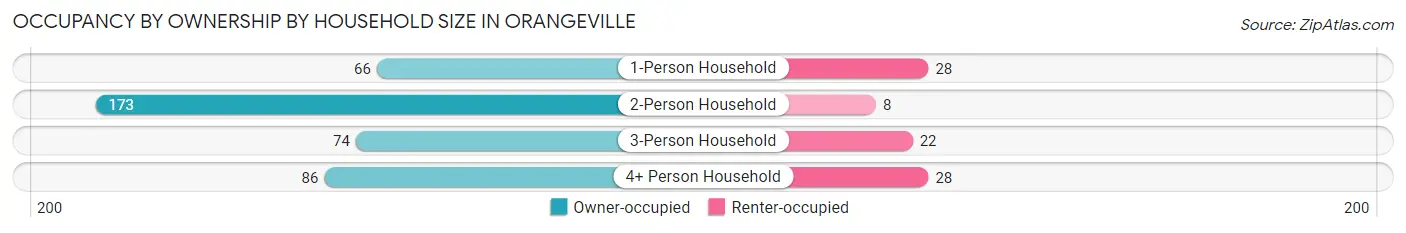
| Household Size | Owner-occupied | Renter-occupied |
| 1-Person Household | 66 (70.2%) | 28 (29.8%) |
| 2-Person Household | 173 (95.6%) | 8 (4.4%) |
| 3-Person Household | 74 (77.1%) | 22 (22.9%) |
| 4+ Person Household | 86 (75.4%) | 28 (24.6%) |
| Total Housing Units | 399 (82.3%) | 86 (17.7%) |
Occupancy by Educational Attainment in Orangeville
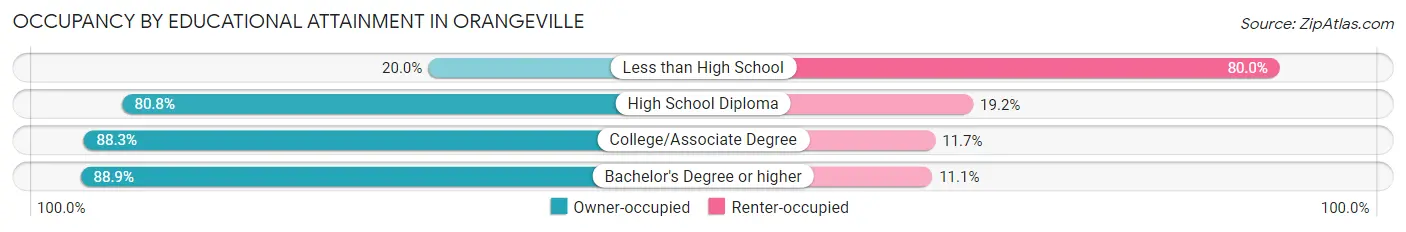
| Household Size | Owner-occupied | Renter-occupied |
| Less than High School | 7 (20.0%) | 28 (80.0%) |
| High School Diploma | 63 (80.8%) | 15 (19.2%) |
| College/Associate Degree | 241 (88.3%) | 32 (11.7%) |
| Bachelor's Degree or higher | 88 (88.9%) | 11 (11.1%) |
Occupancy by Age of Householder in Orangeville
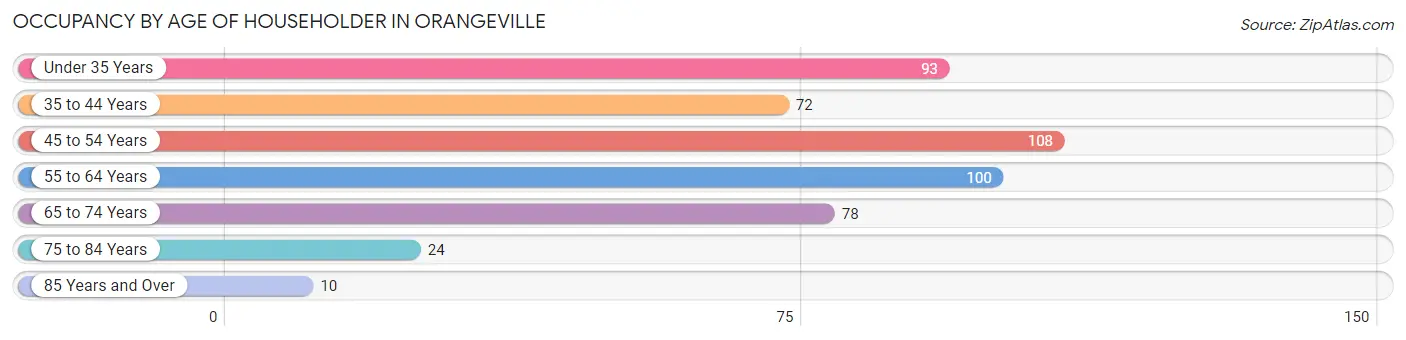
| Age Bracket | # Households | % Households |
| Under 35 Years | 93 | 19.2% |
| 35 to 44 Years | 72 | 14.8% |
| 45 to 54 Years | 108 | 22.3% |
| 55 to 64 Years | 100 | 20.6% |
| 65 to 74 Years | 78 | 16.1% |
| 75 to 84 Years | 24 | 5.0% |
| 85 Years and Over | 10 | 2.1% |
| Total | 485 | 100.0% |
Housing Finances in Orangeville
Median Income by Occupancy in Orangeville
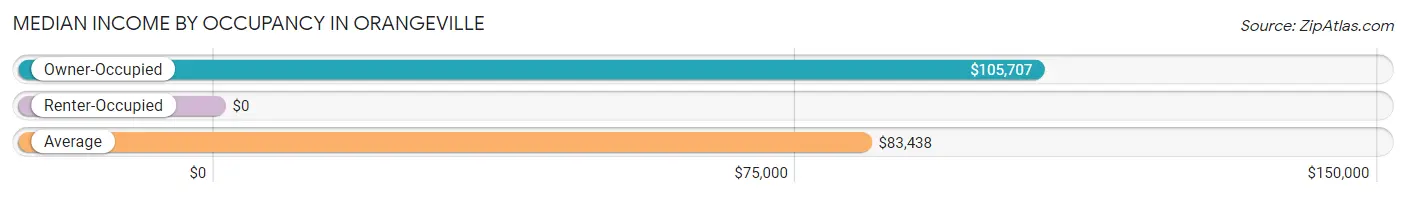
| Occupancy Type | # Households | Median Income |
| Owner-Occupied | 399 (82.3%) | $105,707 |
| Renter-Occupied | 86 (17.7%) | $0 |
| Average | 485 (100.0%) | $83,438 |
Occupancy by Householder Income Bracket in Orangeville
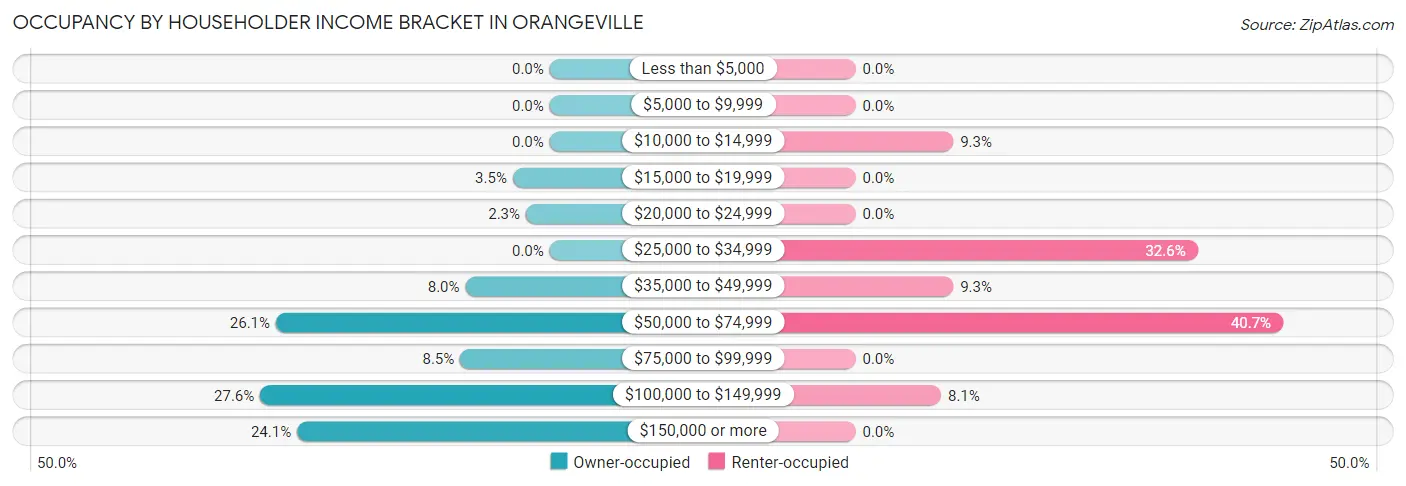
| Income Bracket | Owner-occupied | Renter-occupied |
| Less than $5,000 | 0 (0.0%) | 0 (0.0%) |
| $5,000 to $9,999 | 0 (0.0%) | 0 (0.0%) |
| $10,000 to $14,999 | 0 (0.0%) | 8 (9.3%) |
| $15,000 to $19,999 | 14 (3.5%) | 0 (0.0%) |
| $20,000 to $24,999 | 9 (2.3%) | 0 (0.0%) |
| $25,000 to $34,999 | 0 (0.0%) | 28 (32.6%) |
| $35,000 to $49,999 | 32 (8.0%) | 8 (9.3%) |
| $50,000 to $74,999 | 104 (26.1%) | 35 (40.7%) |
| $75,000 to $99,999 | 34 (8.5%) | 0 (0.0%) |
| $100,000 to $149,999 | 110 (27.6%) | 7 (8.1%) |
| $150,000 or more | 96 (24.1%) | 0 (0.0%) |
| Total | 399 (100.0%) | 86 (100.0%) |
Monthly Housing Cost Tiers in Orangeville
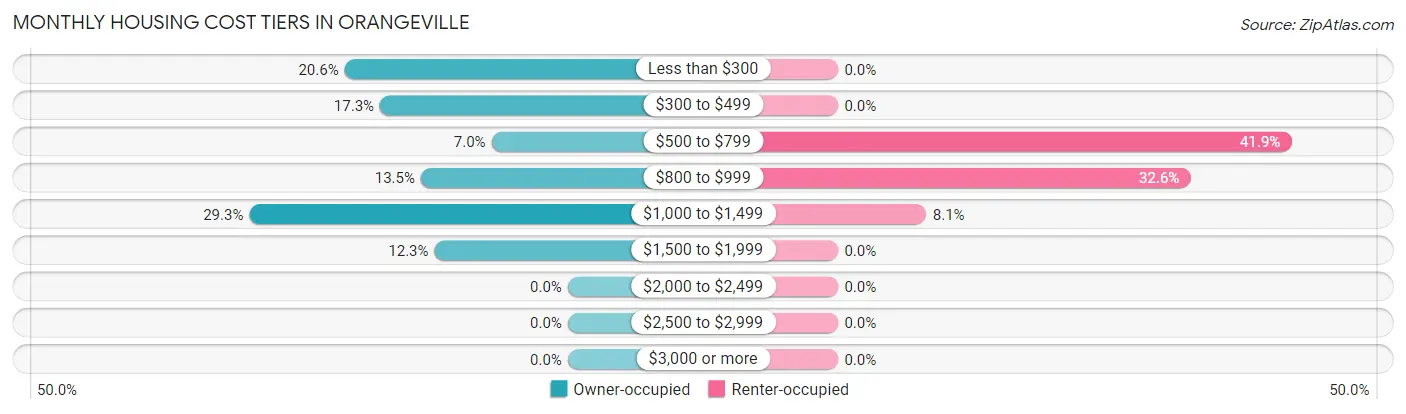
| Monthly Cost | Owner-occupied | Renter-occupied |
| Less than $300 | 82 (20.5%) | 0 (0.0%) |
| $300 to $499 | 69 (17.3%) | 0 (0.0%) |
| $500 to $799 | 28 (7.0%) | 36 (41.9%) |
| $800 to $999 | 54 (13.5%) | 28 (32.6%) |
| $1,000 to $1,499 | 117 (29.3%) | 7 (8.1%) |
| $1,500 to $1,999 | 49 (12.3%) | 0 (0.0%) |
| $2,000 to $2,499 | 0 (0.0%) | 0 (0.0%) |
| $2,500 to $2,999 | 0 (0.0%) | 0 (0.0%) |
| $3,000 or more | 0 (0.0%) | 0 (0.0%) |
| Total | 399 (100.0%) | 86 (100.0%) |
Physical Housing Characteristics in Orangeville
Housing Structures in Orangeville
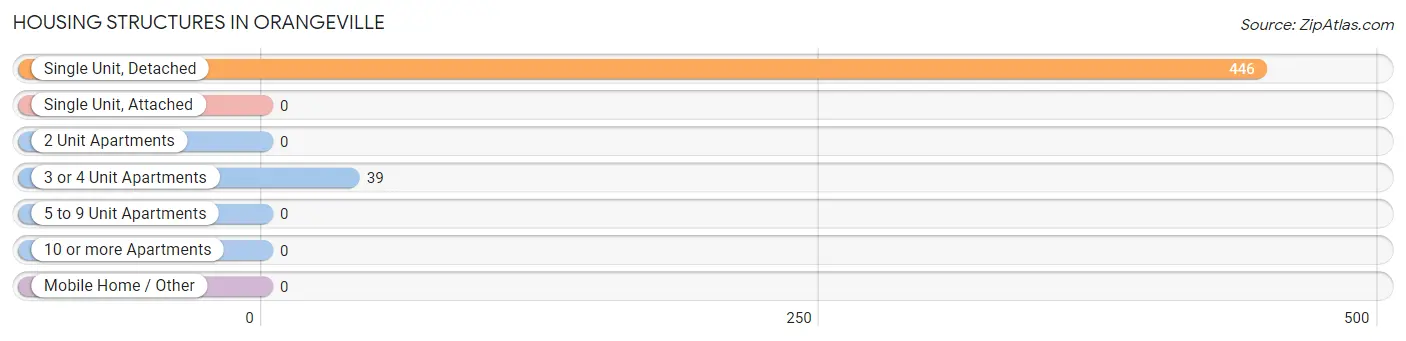
| Structure Type | # Housing Units | % Housing Units |
| Single Unit, Detached | 446 | 92.0% |
| Single Unit, Attached | 0 | 0.0% |
| 2 Unit Apartments | 0 | 0.0% |
| 3 or 4 Unit Apartments | 39 | 8.0% |
| 5 to 9 Unit Apartments | 0 | 0.0% |
| 10 or more Apartments | 0 | 0.0% |
| Mobile Home / Other | 0 | 0.0% |
| Total | 485 | 100.0% |
Housing Structures by Occupancy in Orangeville
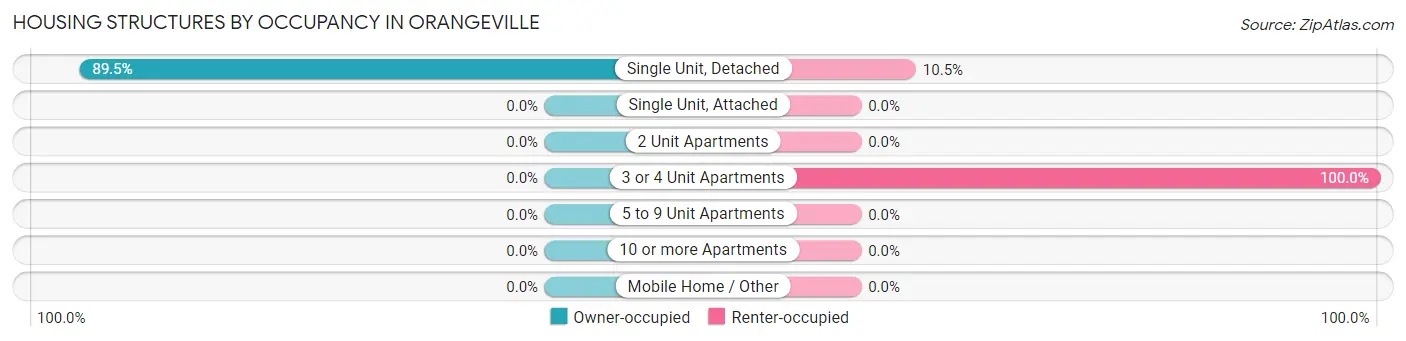
| Structure Type | Owner-occupied | Renter-occupied |
| Single Unit, Detached | 399 (89.5%) | 47 (10.5%) |
| Single Unit, Attached | 0 (0.0%) | 0 (0.0%) |
| 2 Unit Apartments | 0 (0.0%) | 0 (0.0%) |
| 3 or 4 Unit Apartments | 0 (0.0%) | 39 (100.0%) |
| 5 to 9 Unit Apartments | 0 (0.0%) | 0 (0.0%) |
| 10 or more Apartments | 0 (0.0%) | 0 (0.0%) |
| Mobile Home / Other | 0 (0.0%) | 0 (0.0%) |
| Total | 399 (82.3%) | 86 (17.7%) |
Housing Structures by Number of Rooms in Orangeville
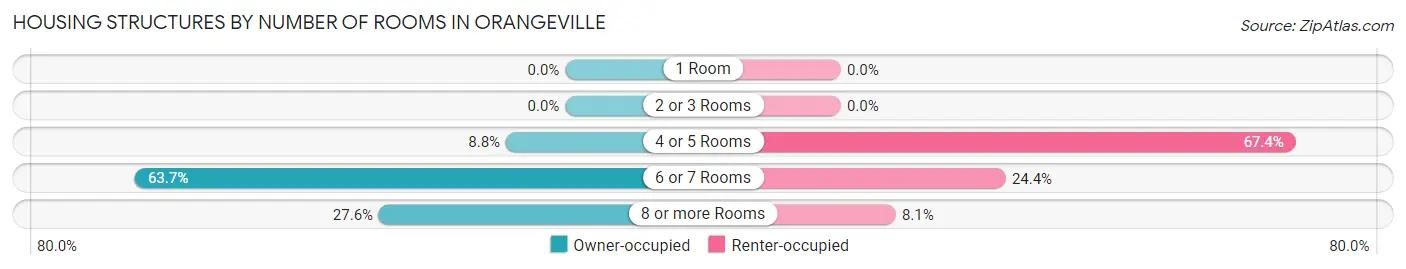
| Number of Rooms | Owner-occupied | Renter-occupied |
| 1 Room | 0 (0.0%) | 0 (0.0%) |
| 2 or 3 Rooms | 0 (0.0%) | 0 (0.0%) |
| 4 or 5 Rooms | 35 (8.8%) | 58 (67.4%) |
| 6 or 7 Rooms | 254 (63.7%) | 21 (24.4%) |
| 8 or more Rooms | 110 (27.6%) | 7 (8.1%) |
| Total | 399 (100.0%) | 86 (100.0%) |
Housing Structure by Heating Type in Orangeville
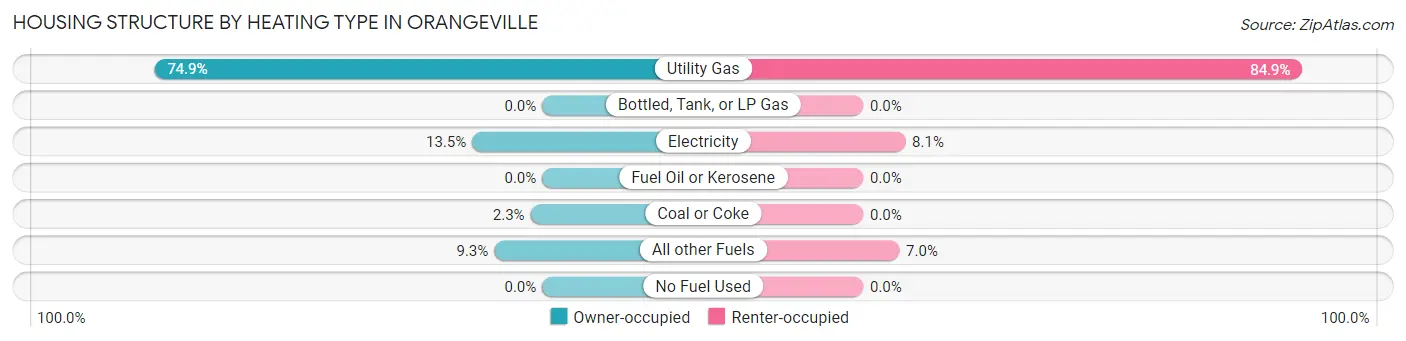
| Heating Type | Owner-occupied | Renter-occupied |
| Utility Gas | 299 (74.9%) | 73 (84.9%) |
| Bottled, Tank, or LP Gas | 0 (0.0%) | 0 (0.0%) |
| Electricity | 54 (13.5%) | 7 (8.1%) |
| Fuel Oil or Kerosene | 0 (0.0%) | 0 (0.0%) |
| Coal or Coke | 9 (2.3%) | 0 (0.0%) |
| All other Fuels | 37 (9.3%) | 6 (7.0%) |
| No Fuel Used | 0 (0.0%) | 0 (0.0%) |
| Total | 399 (100.0%) | 86 (100.0%) |
Household Vehicle Usage in Orangeville
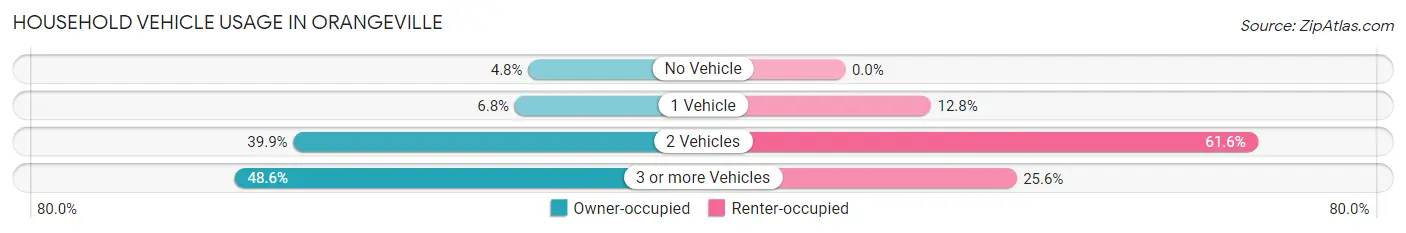
| Vehicles per Household | Owner-occupied | Renter-occupied |
| No Vehicle | 19 (4.8%) | 0 (0.0%) |
| 1 Vehicle | 27 (6.8%) | 11 (12.8%) |
| 2 Vehicles | 159 (39.9%) | 53 (61.6%) |
| 3 or more Vehicles | 194 (48.6%) | 22 (25.6%) |
| Total | 399 (100.0%) | 86 (100.0%) |
Real Estate & Mortgages in Orangeville
Real Estate and Mortgage Overview in Orangeville
| Characteristic | Without Mortgage | With Mortgage |
| Housing Units | 183 | 216 |
| Median Property Value | $162,100 | $197,600 |
| Median Household Income | $83,438 | $50 |
| Monthly Housing Costs | $314 | $0 |
| Real Estate Taxes | $1,098 | $0 |
Property Value by Mortgage Status in Orangeville
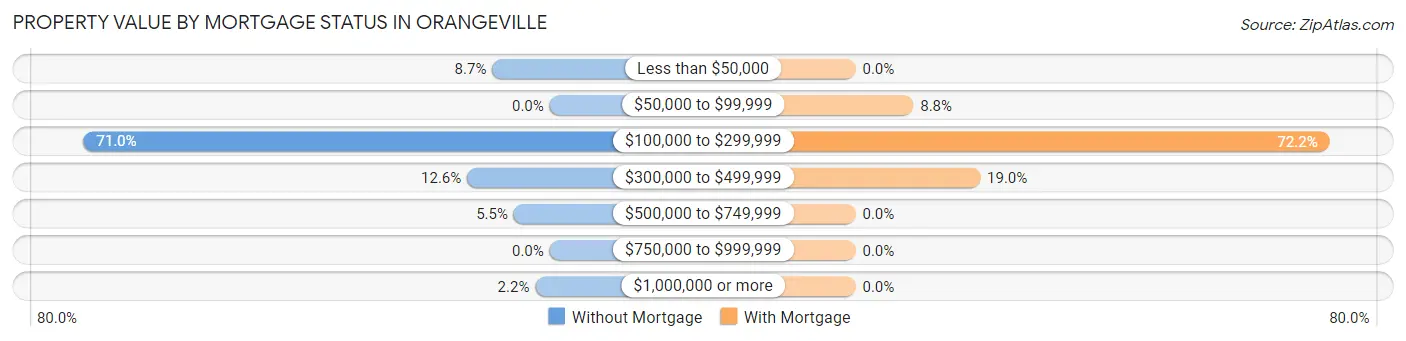
| Property Value | Without Mortgage | With Mortgage |
| Less than $50,000 | 16 (8.7%) | 0 (0.0%) |
| $50,000 to $99,999 | 0 (0.0%) | 19 (8.8%) |
| $100,000 to $299,999 | 130 (71.0%) | 156 (72.2%) |
| $300,000 to $499,999 | 23 (12.6%) | 41 (19.0%) |
| $500,000 to $749,999 | 10 (5.5%) | 0 (0.0%) |
| $750,000 to $999,999 | 0 (0.0%) | 0 (0.0%) |
| $1,000,000 or more | 4 (2.2%) | 0 (0.0%) |
| Total | 183 (100.0%) | 216 (100.0%) |
Household Income by Mortgage Status in Orangeville
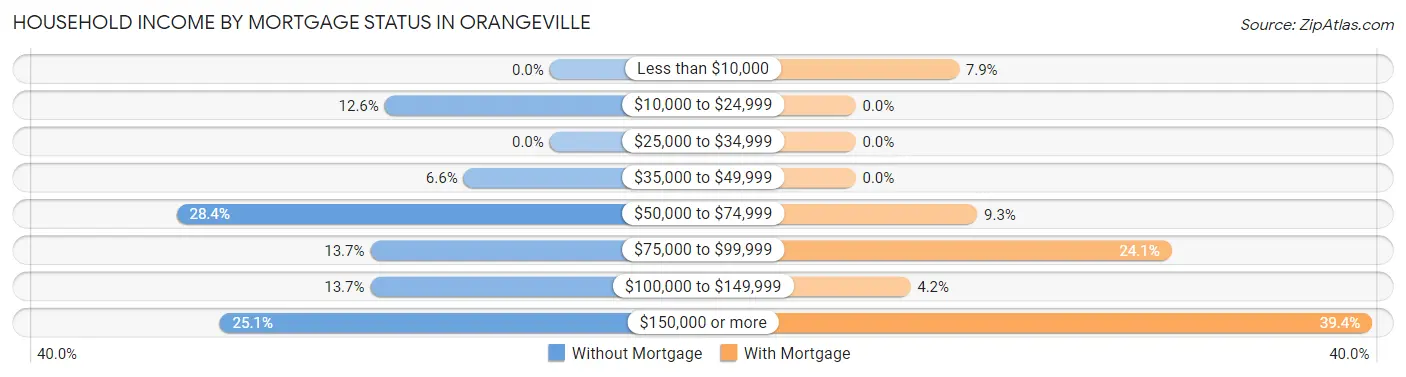
| Household Income | Without Mortgage | With Mortgage |
| Less than $10,000 | 0 (0.0%) | 17 (7.9%) |
| $10,000 to $24,999 | 23 (12.6%) | 0 (0.0%) |
| $25,000 to $34,999 | 0 (0.0%) | 0 (0.0%) |
| $35,000 to $49,999 | 12 (6.6%) | 0 (0.0%) |
| $50,000 to $74,999 | 52 (28.4%) | 20 (9.3%) |
| $75,000 to $99,999 | 25 (13.7%) | 52 (24.1%) |
| $100,000 to $149,999 | 25 (13.7%) | 9 (4.2%) |
| $150,000 or more | 46 (25.1%) | 85 (39.4%) |
| Total | 183 (100.0%) | 216 (100.0%) |
Property Value to Household Income Ratio in Orangeville
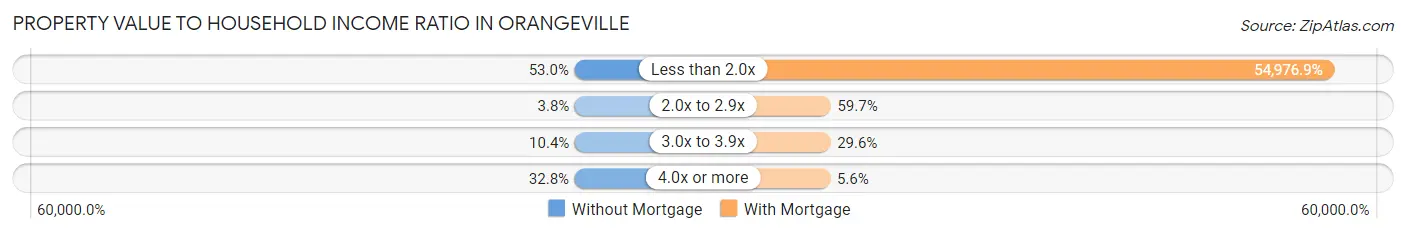
| Value-to-Income Ratio | Without Mortgage | With Mortgage |
| Less than 2.0x | 97 (53.0%) | 118,750 (54,976.9%) |
| 2.0x to 2.9x | 7 (3.8%) | 129 (59.7%) |
| 3.0x to 3.9x | 19 (10.4%) | 64 (29.6%) |
| 4.0x or more | 60 (32.8%) | 12 (5.6%) |
| Total | 183 (100.0%) | 216 (100.0%) |
Real Estate Taxes by Mortgage Status in Orangeville
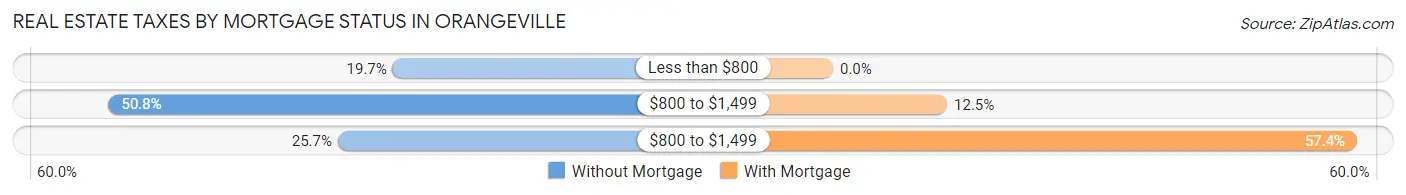
| Property Taxes | Without Mortgage | With Mortgage |
| Less than $800 | 36 (19.7%) | 0 (0.0%) |
| $800 to $1,499 | 93 (50.8%) | 27 (12.5%) |
| $800 to $1,499 | 47 (25.7%) | 124 (57.4%) |
| Total | 183 (100.0%) | 216 (100.0%) |
Health & Disability in Orangeville
Health Insurance Coverage by Age in Orangeville
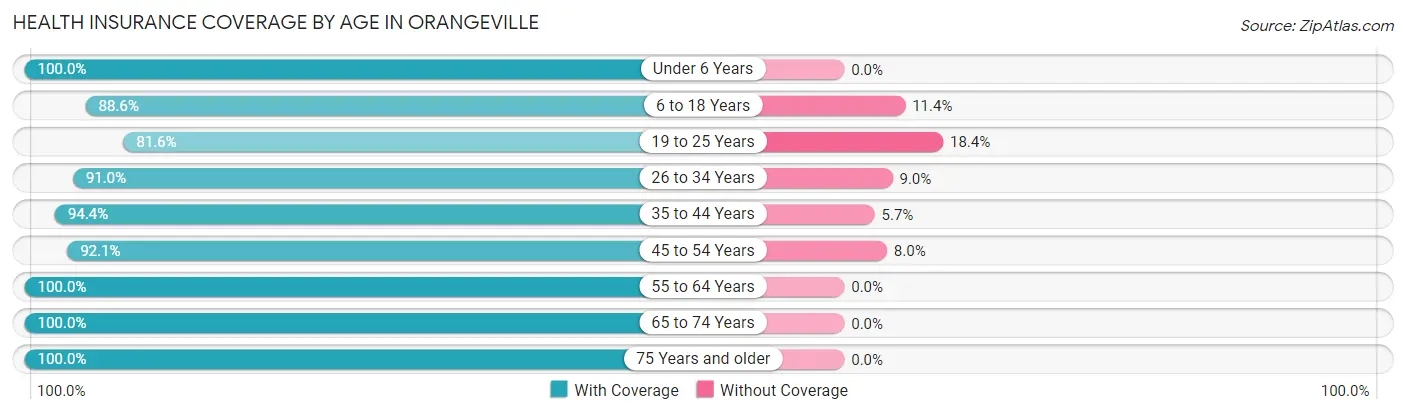
| Age Bracket | With Coverage | Without Coverage |
| Under 6 Years | 133 (100.0%) | 0 (0.0%) |
| 6 to 18 Years | 242 (88.6%) | 31 (11.4%) |
| 19 to 25 Years | 124 (81.6%) | 28 (18.4%) |
| 26 to 34 Years | 81 (91.0%) | 8 (9.0%) |
| 35 to 44 Years | 117 (94.4%) | 7 (5.7%) |
| 45 to 54 Years | 139 (92.0%) | 12 (8.0%) |
| 55 to 64 Years | 206 (100.0%) | 0 (0.0%) |
| 65 to 74 Years | 145 (100.0%) | 0 (0.0%) |
| 75 Years and older | 59 (100.0%) | 0 (0.0%) |
| Total | 1,246 (93.5%) | 86 (6.5%) |
Health Insurance Coverage by Citizenship Status in Orangeville
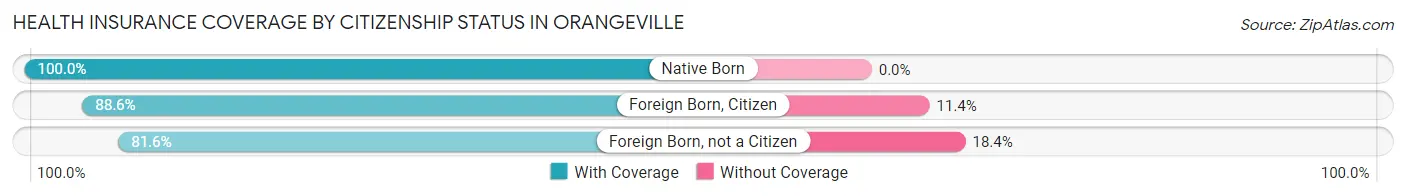
| Citizenship Status | With Coverage | Without Coverage |
| Native Born | 133 (100.0%) | 0 (0.0%) |
| Foreign Born, Citizen | 242 (88.6%) | 31 (11.4%) |
| Foreign Born, not a Citizen | 124 (81.6%) | 28 (18.4%) |
Health Insurance Coverage by Household Income in Orangeville
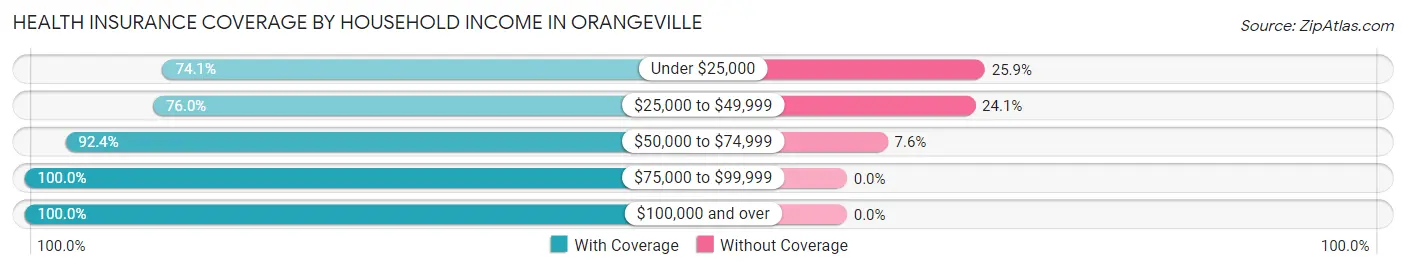
| Household Income | With Coverage | Without Coverage |
| Under $25,000 | 43 (74.1%) | 15 (25.9%) |
| $25,000 to $49,999 | 120 (75.9%) | 38 (24.0%) |
| $50,000 to $74,999 | 399 (92.4%) | 33 (7.6%) |
| $75,000 to $99,999 | 90 (100.0%) | 0 (0.0%) |
| $100,000 and over | 594 (100.0%) | 0 (0.0%) |
Public vs Private Health Insurance Coverage by Age in Orangeville
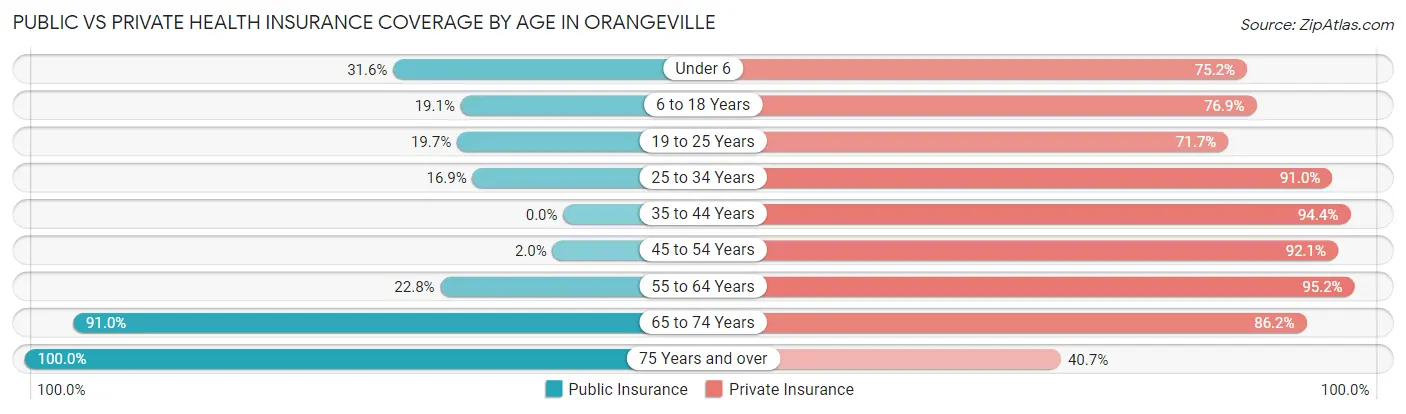
| Age Bracket | Public Insurance | Private Insurance |
| Under 6 | 42 (31.6%) | 100 (75.2%) |
| 6 to 18 Years | 52 (19.1%) | 210 (76.9%) |
| 19 to 25 Years | 30 (19.7%) | 109 (71.7%) |
| 25 to 34 Years | 15 (16.9%) | 81 (91.0%) |
| 35 to 44 Years | 0 (0.0%) | 117 (94.4%) |
| 45 to 54 Years | 3 (2.0%) | 139 (92.0%) |
| 55 to 64 Years | 47 (22.8%) | 196 (95.2%) |
| 65 to 74 Years | 132 (91.0%) | 125 (86.2%) |
| 75 Years and over | 59 (100.0%) | 24 (40.7%) |
| Total | 380 (28.5%) | 1,101 (82.7%) |
Disability Status by Sex by Age in Orangeville
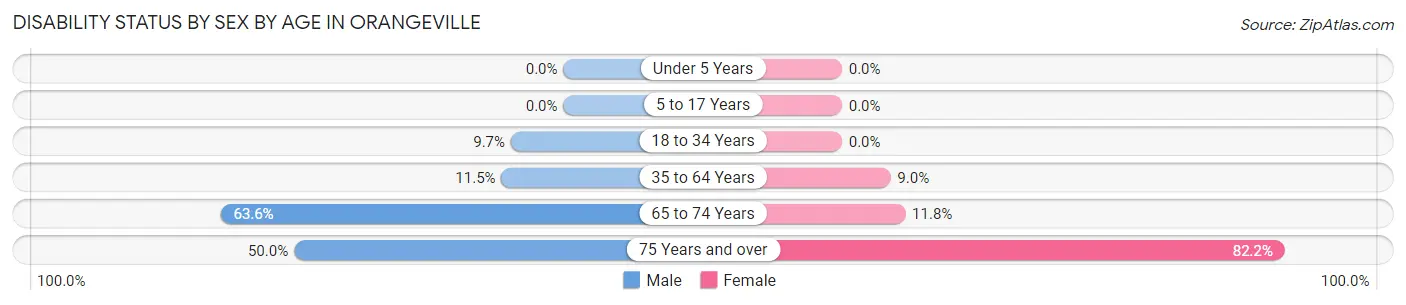
| Age Bracket | Male | Female |
| Under 5 Years | 0 (0.0%) | 0 (0.0%) |
| 5 to 17 Years | 0 (0.0%) | 0 (0.0%) |
| 18 to 34 Years | 15 (9.7%) | 0 (0.0%) |
| 35 to 64 Years | 26 (11.5%) | 23 (9.0%) |
| 65 to 74 Years | 49 (63.6%) | 8 (11.8%) |
| 75 Years and over | 7 (50.0%) | 37 (82.2%) |
Disability Class by Sex by Age in Orangeville
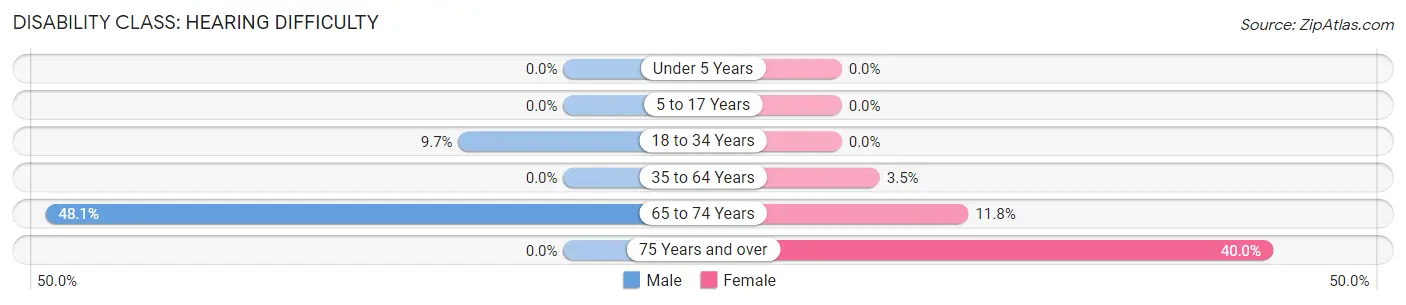
Disability Class: Hearing Difficulty
| Age Bracket | Male | Female |
| Under 5 Years | 0 (0.0%) | 0 (0.0%) |
| 5 to 17 Years | 0 (0.0%) | 0 (0.0%) |
| 18 to 34 Years | 15 (9.7%) | 0 (0.0%) |
| 35 to 64 Years | 0 (0.0%) | 9 (3.5%) |
| 65 to 74 Years | 37 (48.0%) | 8 (11.8%) |
| 75 Years and over | 0 (0.0%) | 18 (40.0%) |
Disability Class: Vision Difficulty
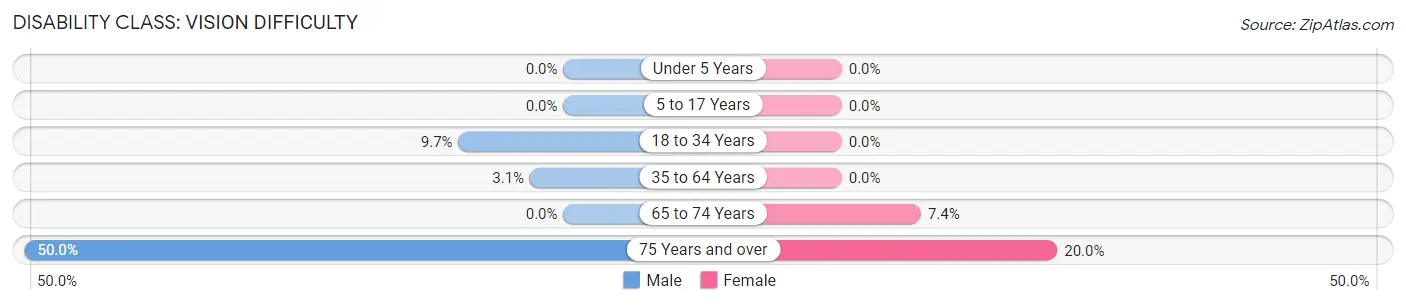
| Age Bracket | Male | Female |
| Under 5 Years | 0 (0.0%) | 0 (0.0%) |
| 5 to 17 Years | 0 (0.0%) | 0 (0.0%) |
| 18 to 34 Years | 15 (9.7%) | 0 (0.0%) |
| 35 to 64 Years | 7 (3.1%) | 0 (0.0%) |
| 65 to 74 Years | 0 (0.0%) | 5 (7.3%) |
| 75 Years and over | 7 (50.0%) | 9 (20.0%) |
Disability Class: Cognitive Difficulty
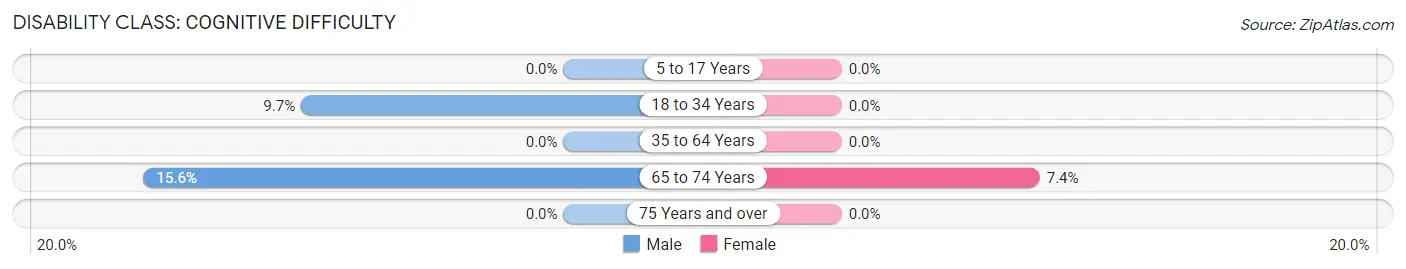
| Age Bracket | Male | Female |
| 5 to 17 Years | 0 (0.0%) | 0 (0.0%) |
| 18 to 34 Years | 15 (9.7%) | 0 (0.0%) |
| 35 to 64 Years | 0 (0.0%) | 0 (0.0%) |
| 65 to 74 Years | 12 (15.6%) | 5 (7.3%) |
| 75 Years and over | 0 (0.0%) | 0 (0.0%) |
Disability Class: Ambulatory Difficulty
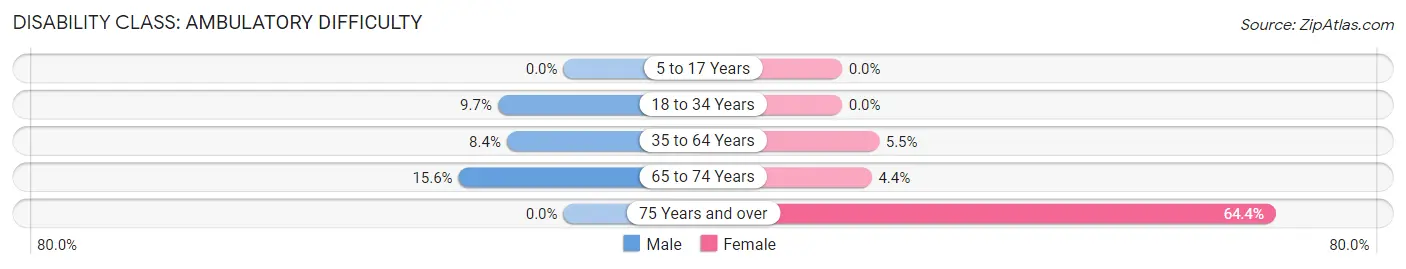
| Age Bracket | Male | Female |
| 5 to 17 Years | 0 (0.0%) | 0 (0.0%) |
| 18 to 34 Years | 15 (9.7%) | 0 (0.0%) |
| 35 to 64 Years | 19 (8.4%) | 14 (5.5%) |
| 65 to 74 Years | 12 (15.6%) | 3 (4.4%) |
| 75 Years and over | 0 (0.0%) | 29 (64.4%) |
Disability Class: Self-Care Difficulty
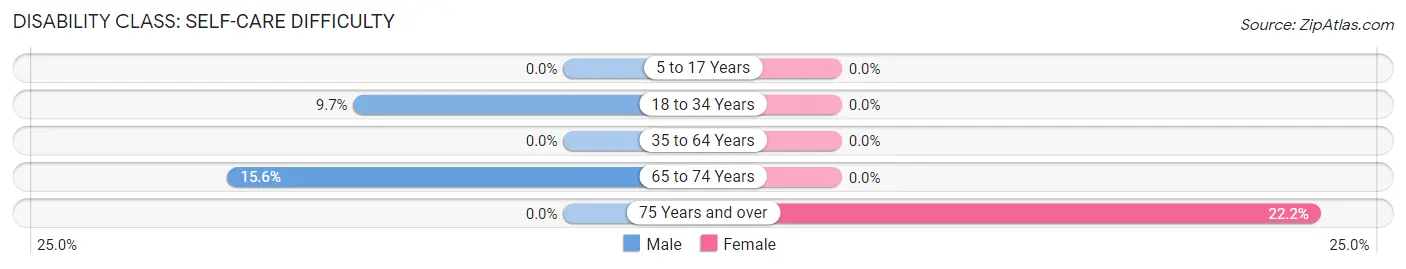
| Age Bracket | Male | Female |
| 5 to 17 Years | 0 (0.0%) | 0 (0.0%) |
| 18 to 34 Years | 15 (9.7%) | 0 (0.0%) |
| 35 to 64 Years | 0 (0.0%) | 0 (0.0%) |
| 65 to 74 Years | 12 (15.6%) | 0 (0.0%) |
| 75 Years and over | 0 (0.0%) | 10 (22.2%) |
Technology Access in Orangeville
Computing Device Access in Orangeville
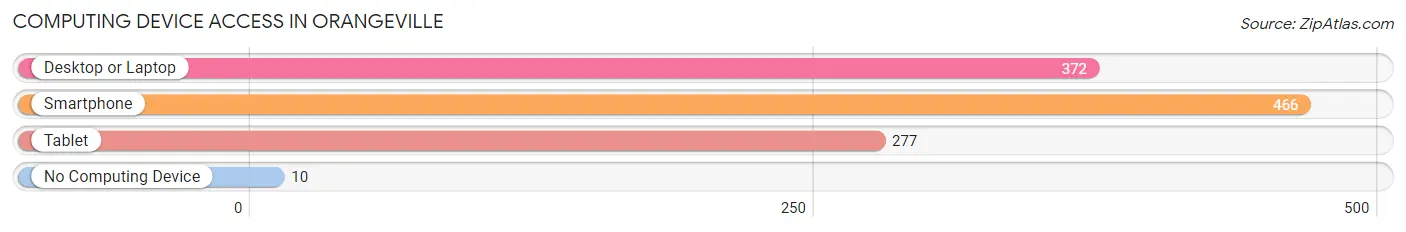
| Device Type | # Households | % Households |
| Desktop or Laptop | 372 | 76.7% |
| Smartphone | 466 | 96.1% |
| Tablet | 277 | 57.1% |
| No Computing Device | 10 | 2.1% |
| Total | 485 | 100.0% |
Internet Access in Orangeville
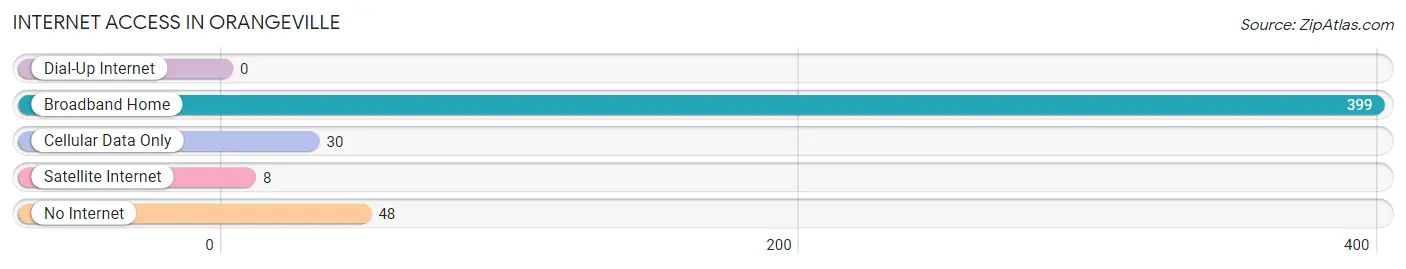
| Internet Type | # Households | % Households |
| Dial-Up Internet | 0 | 0.0% |
| Broadband Home | 399 | 82.3% |
| Cellular Data Only | 30 | 6.2% |
| Satellite Internet | 8 | 1.7% |
| No Internet | 48 | 9.9% |
| Total | 485 | 100.0% |
Orangeville Summary
Introduction
The small town of Orangeville, Utah is located in Emery County in the southeastern part of the state. It is situated in a rural area, surrounded by mountains and desert. The town has a population of approximately 1,000 people and is known for its small-town charm and friendly atmosphere. The town is home to a variety of businesses, including a grocery store, a hardware store, a restaurant, and a few other small businesses. The town is also home to a number of churches, including the Church of Jesus Christ of Latter-day Saints, the Catholic Church, and the United Methodist Church.
History
Orangeville was founded in 1877 by a group of Mormon settlers who were looking for a place to settle and raise their families. The town was named after the orange trees that were planted in the area. The settlers built a fort to protect themselves from Native American attacks, and the town grew quickly. By the early 1900s, Orangeville had become a thriving community with a population of over 1,000 people.
The town was an important stop on the Denver and Rio Grande Western Railroad, and the railroad brought many new people to the area. The town also had a number of businesses, including a hotel, a bank, a general store, and a post office.
In the early 1900s, the town was also home to a number of coal mines, which provided jobs for many of the town’s residents. The coal mines were eventually closed, but the town continued to thrive.
Geography
Orangeville is located in Emery County in the southeastern part of Utah. The town is situated in a rural area, surrounded by mountains and desert. The town is located at an elevation of 5,000 feet, and the climate is semi-arid. The town is located near the San Rafael Swell, a large area of rugged terrain that is popular with hikers and campers.
Economy
The economy of Orangeville is largely based on agriculture and tourism. The town is home to a number of farms, which produce a variety of crops, including hay, alfalfa, and wheat. The town is also home to a number of tourist attractions, including the San Rafael Swell, which attracts hikers and campers from all over the country.
The town is also home to a number of businesses, including a grocery store, a hardware store, a restaurant, and a few other small businesses. The town is also home to a number of churches, including the Church of Jesus Christ of Latter-day Saints, the Catholic Church, and the United Methodist Church.
Demographics
As of the 2010 census, the population of Orangeville was 1,000 people. The town is predominantly white, with a small Hispanic population. The median household income is $37,000, and the median age is 37. The town is home to a number of churches, including the Church of Jesus Christ of Latter-day Saints, the Catholic Church, and the United Methodist Church.
Conclusion
Orangeville, Utah is a small town with a population of approximately 1,000 people. The town is located in Emery County in the southeastern part of the state and is surrounded by mountains and desert. The town is known for its small-town charm and friendly atmosphere. The town is home to a variety of businesses, including a grocery store, a hardware store, a restaurant, and a few other small businesses. The town is also home to a number of churches, including the Church of Jesus Christ of Latter-day Saints, the Catholic Church, and the United Methodist Church. The economy of Orangeville is largely based on agriculture and tourism, and the town is home to a number of farms and tourist attractions. The population of Orangeville is predominantly white, with a small Hispanic population.
Common Questions
What is Per Capita Income in Orangeville?
Per Capita income in Orangeville is $34,255.
What is the Median Family Income in Orangeville?
Median Family Income in Orangeville is $100,893.
What is the Median Household income in Orangeville?
Median Household Income in Orangeville is $83,438.
What is Income or Wage Gap in Orangeville?
Income or Wage Gap in Orangeville is 56.5%.
Women in Orangeville earn 43.5 cents for every dollar earned by a man.
What is Inequality or Gini Index in Orangeville?
Inequality or Gini Index in Orangeville is 0.32.
What is the Total Population of Orangeville?
Total Population of Orangeville is 1,340.
What is the Total Male Population of Orangeville?
Total Male Population of Orangeville is 667.
What is the Total Female Population of Orangeville?
Total Female Population of Orangeville is 673.
What is the Ratio of Males per 100 Females in Orangeville?
There are 99.11 Males per 100 Females in Orangeville.
What is the Ratio of Females per 100 Males in Orangeville?
There are 100.90 Females per 100 Males in Orangeville.
What is the Median Population Age in Orangeville?
Median Population Age in Orangeville is 36.5 Years.
What is the Average Family Size in Orangeville
Average Family Size in Orangeville is 3.1 People.
What is the Average Household Size in Orangeville
Average Household Size in Orangeville is 2.8 People.
How Large is the Labor Force in Orangeville?
There are 620 People in the Labor Forcein in Orangeville.
What is the Percentage of People in the Labor Force in Orangeville?
62.3% of People are in the Labor Force in Orangeville.